. 2024 Jun 25;43(6):114288.
doi: 10.1016/j.celrep.2024.114288. Epub 2024 May 29.

G-protein-coupled receptor 84 regulates acute inflammation in normal and diabetic skin wounds

Affiliations

G-protein-coupled receptor 84 regulates acute inflammation in normal and diabetic skin wounds

Paula O Cooper et al. Cell Rep. .

Abstract

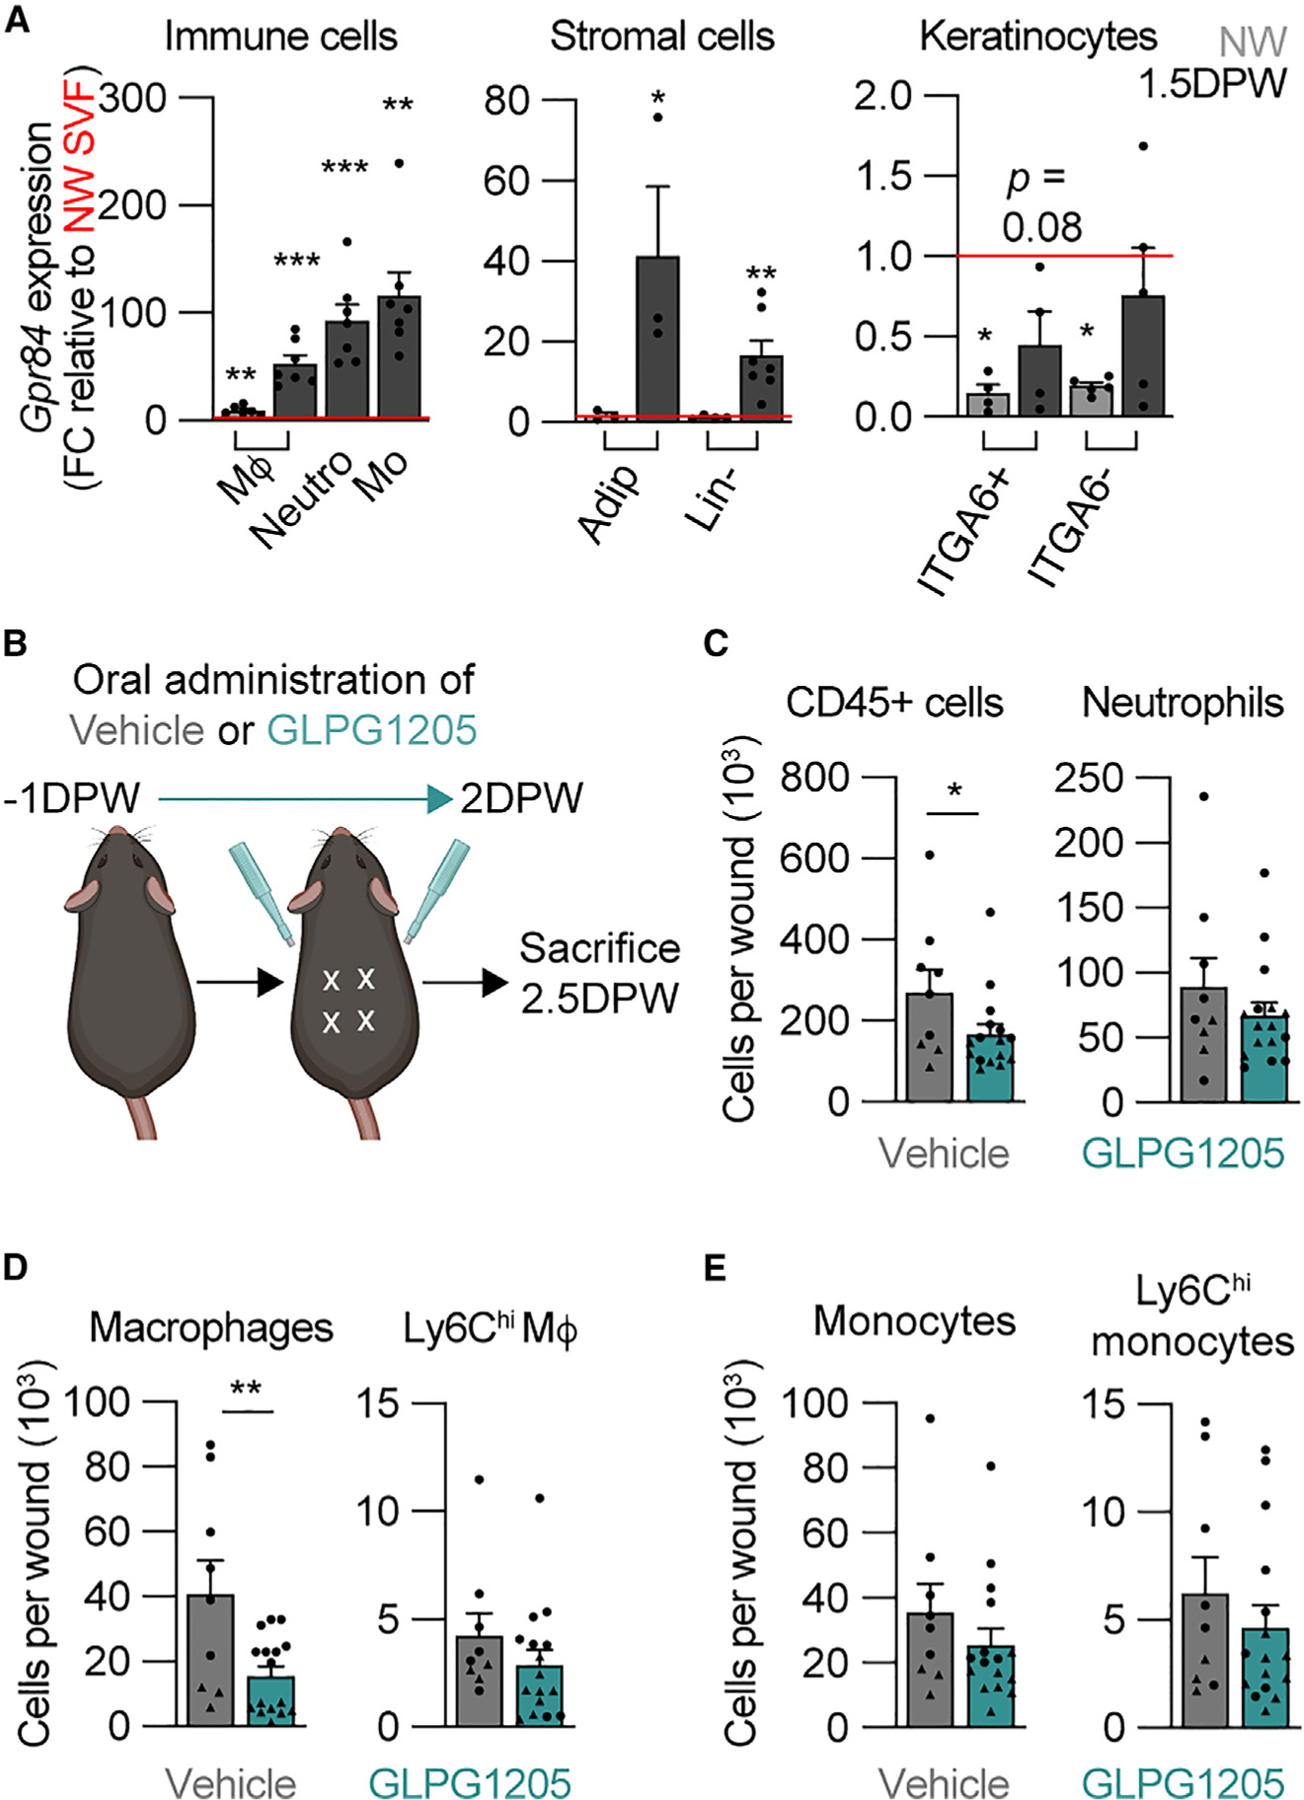
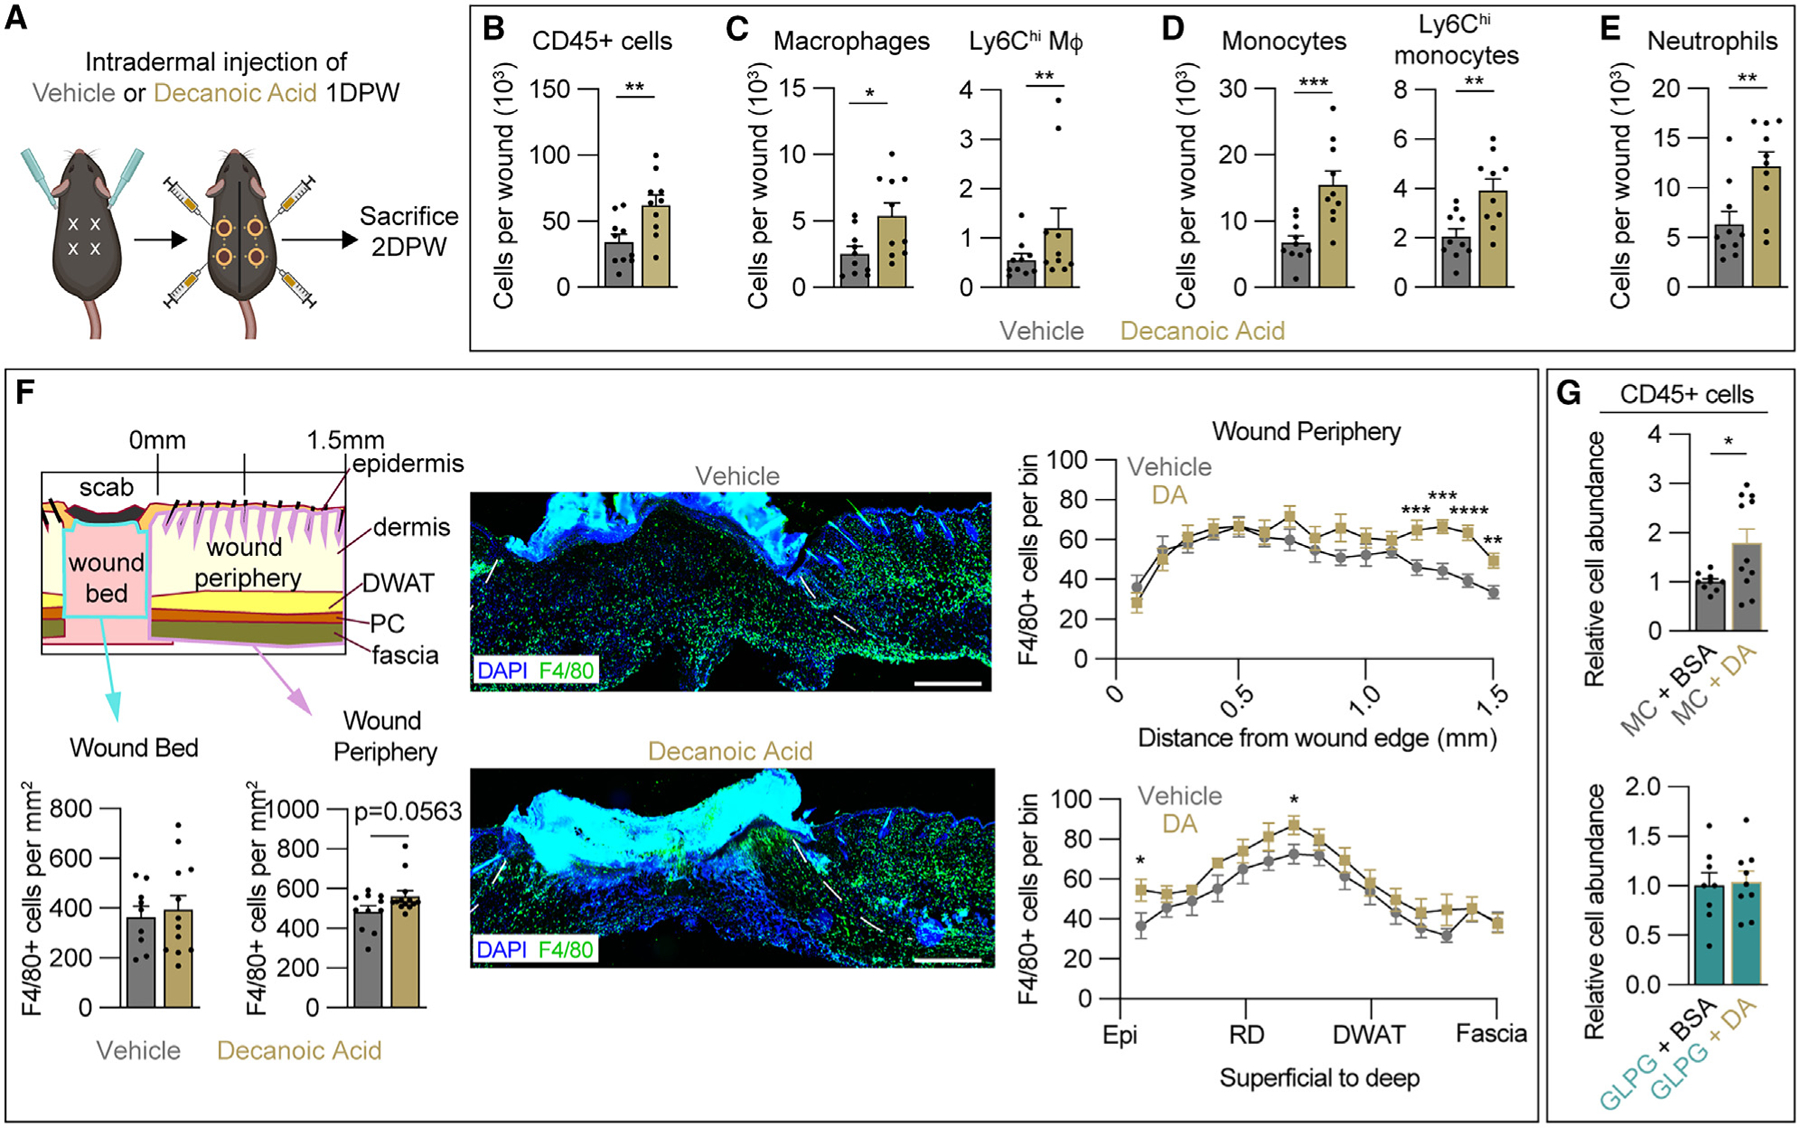
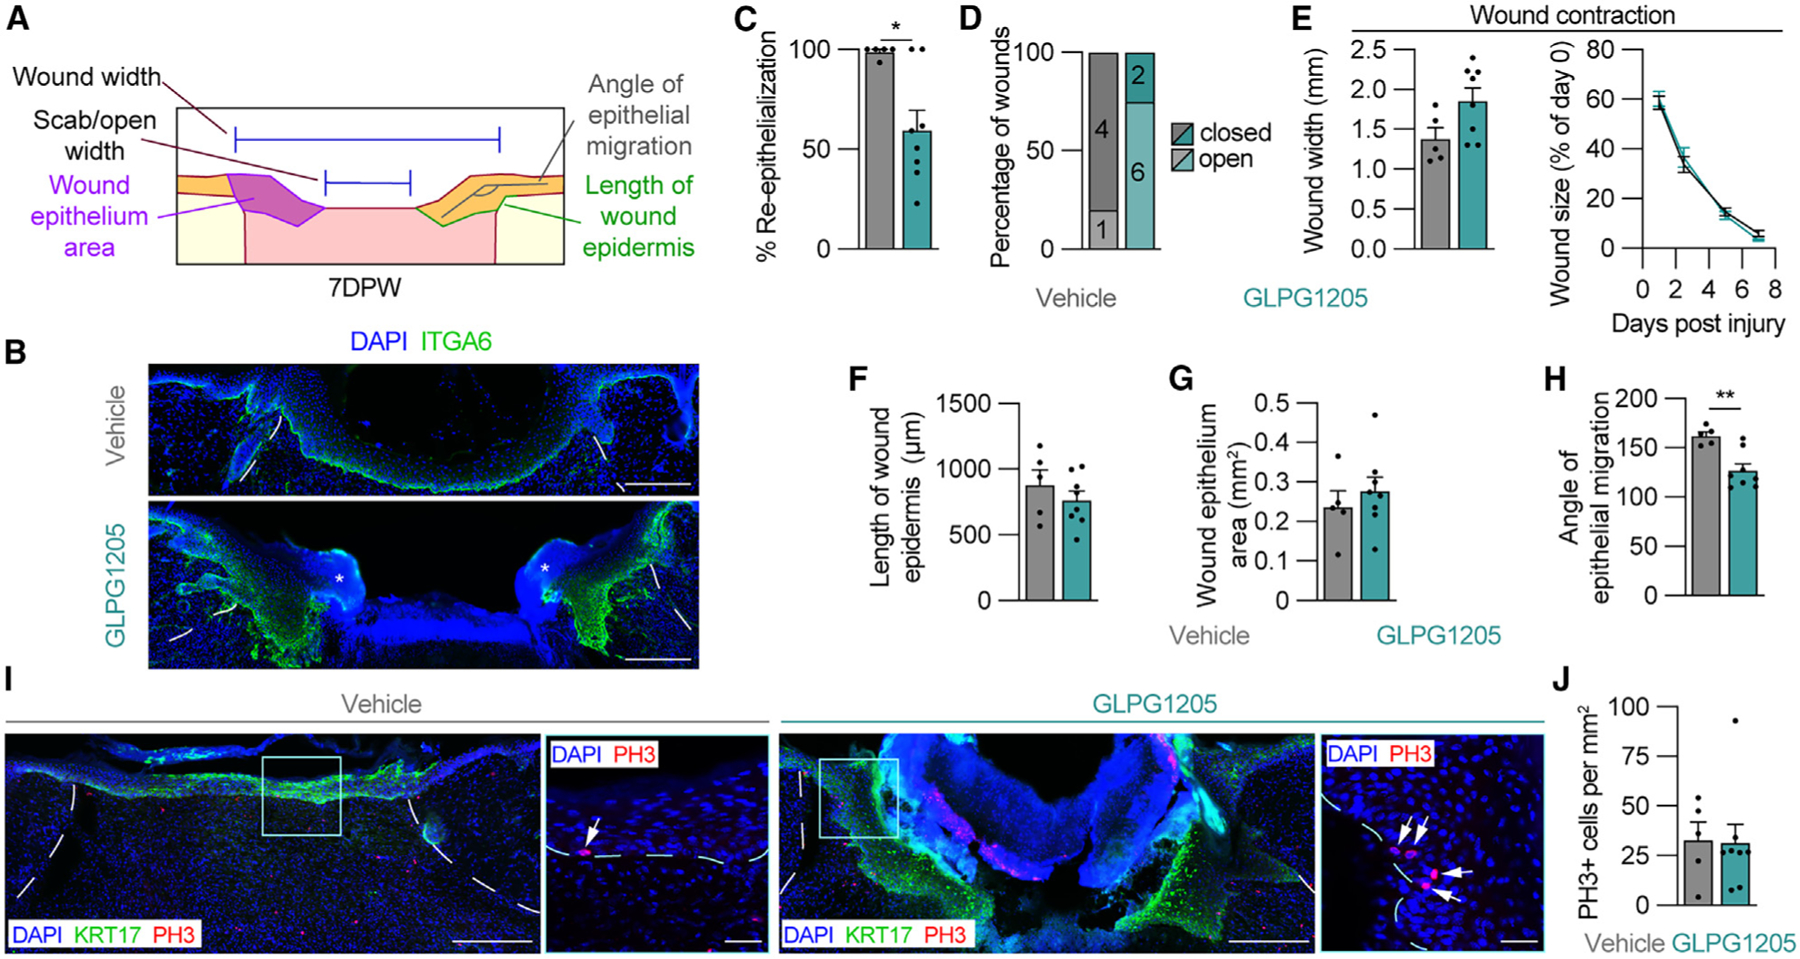
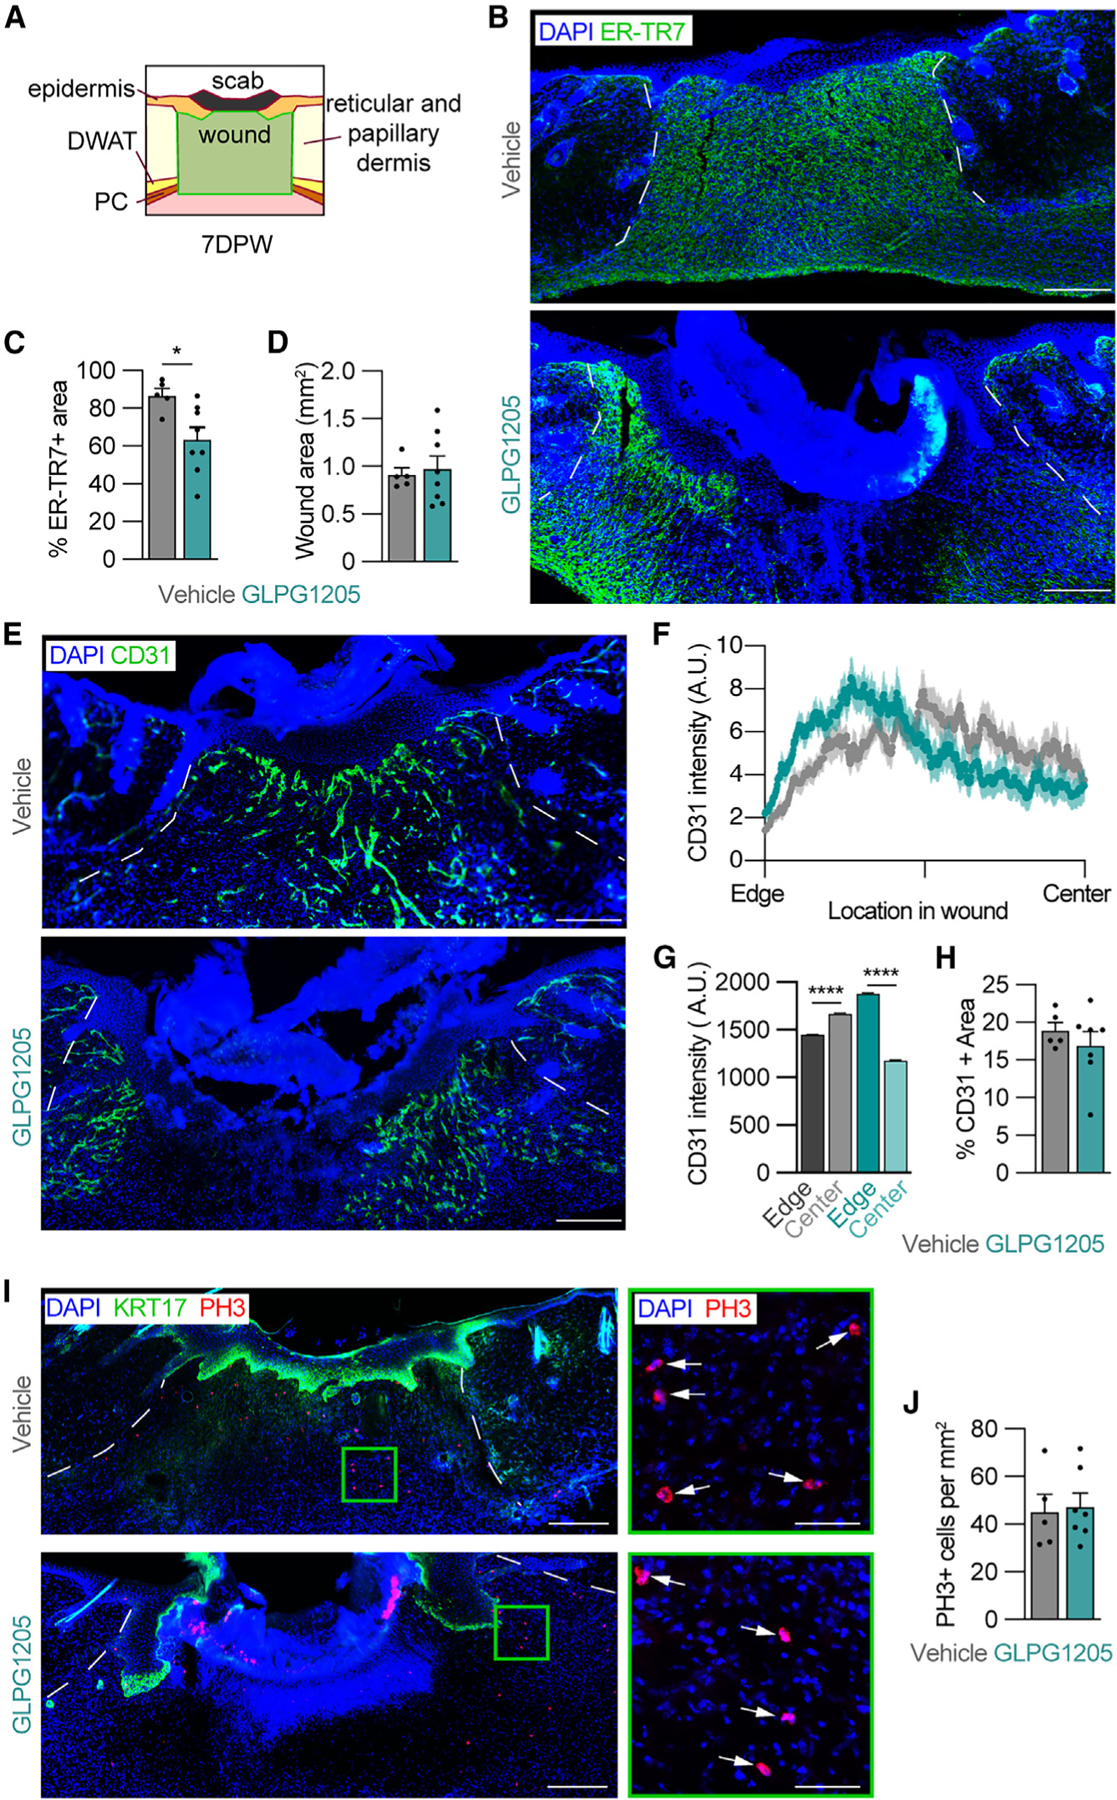
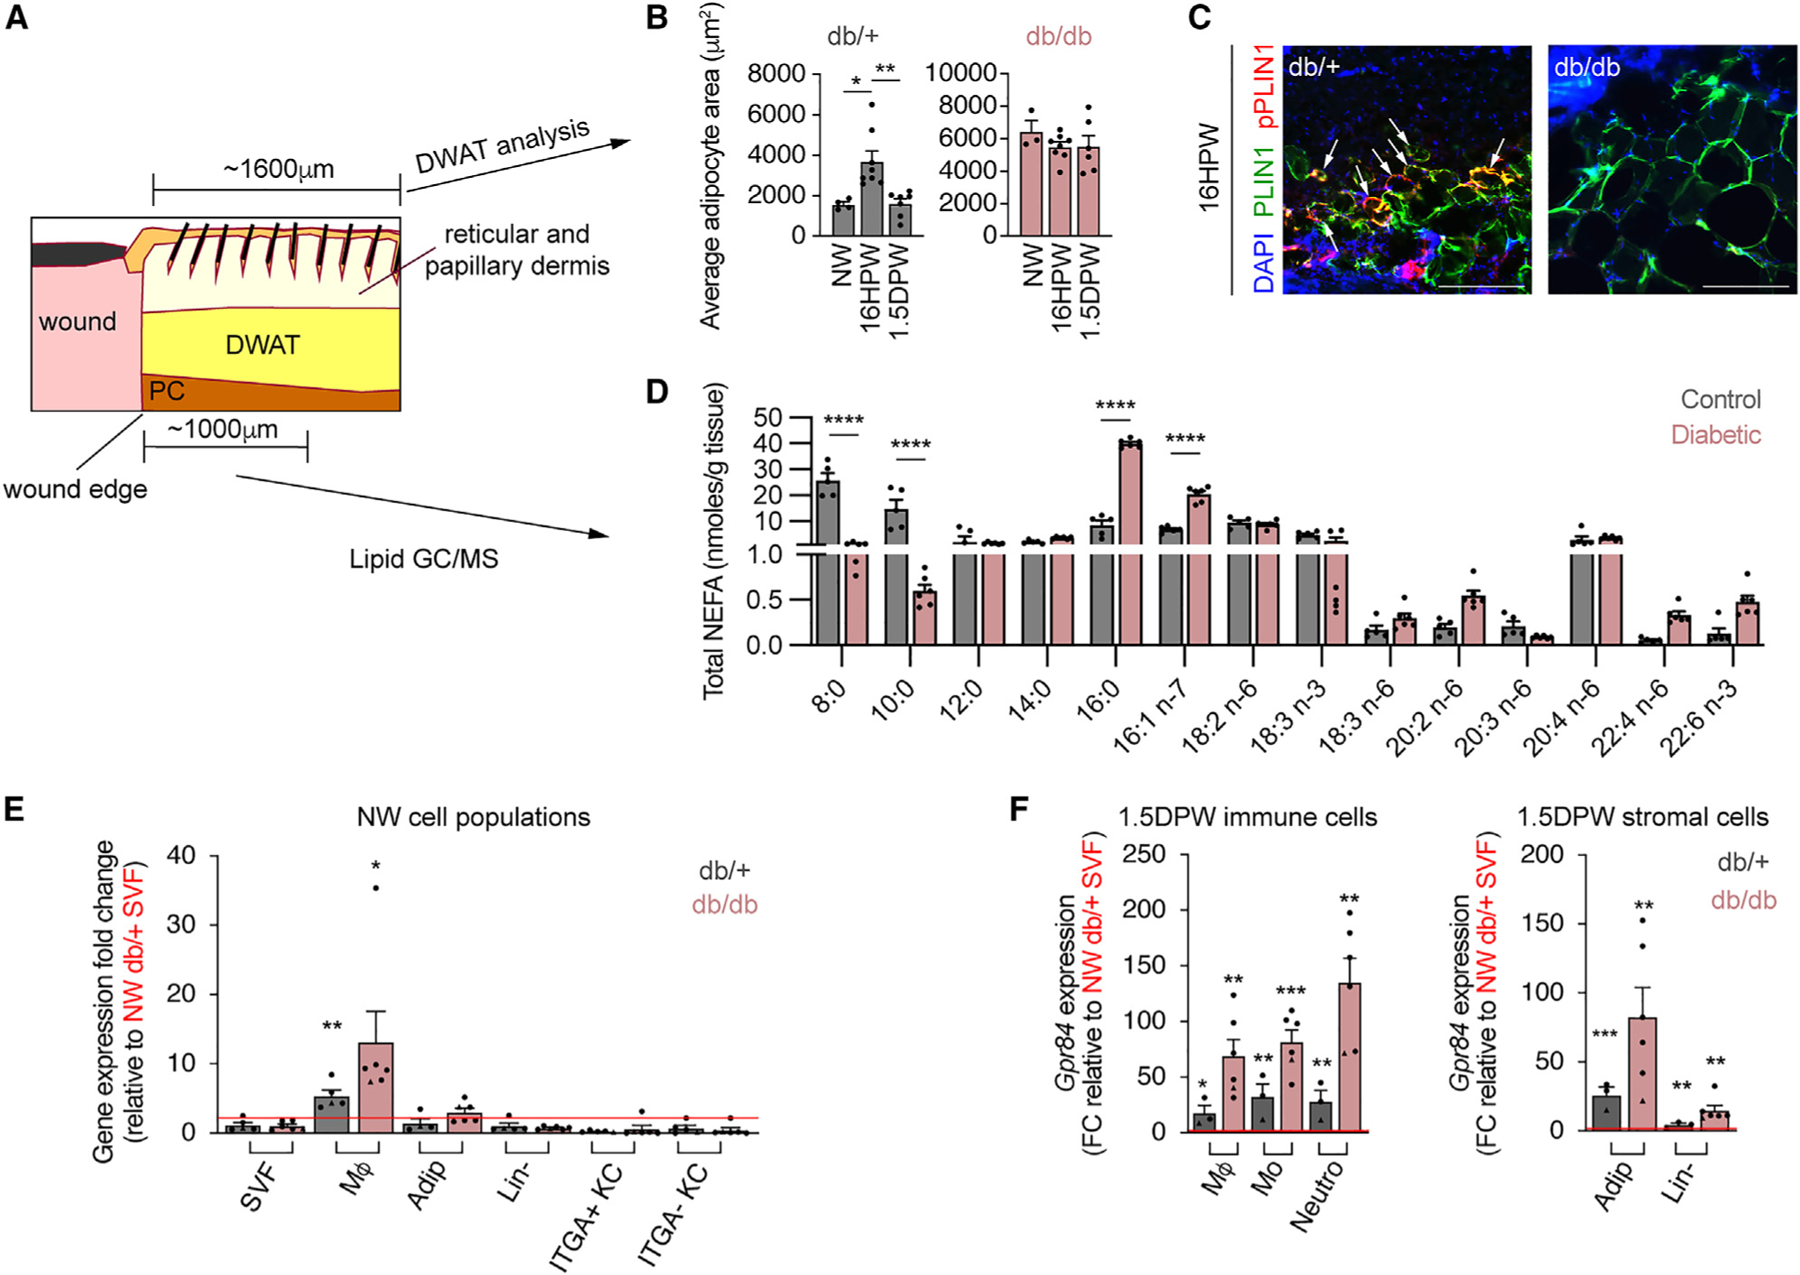
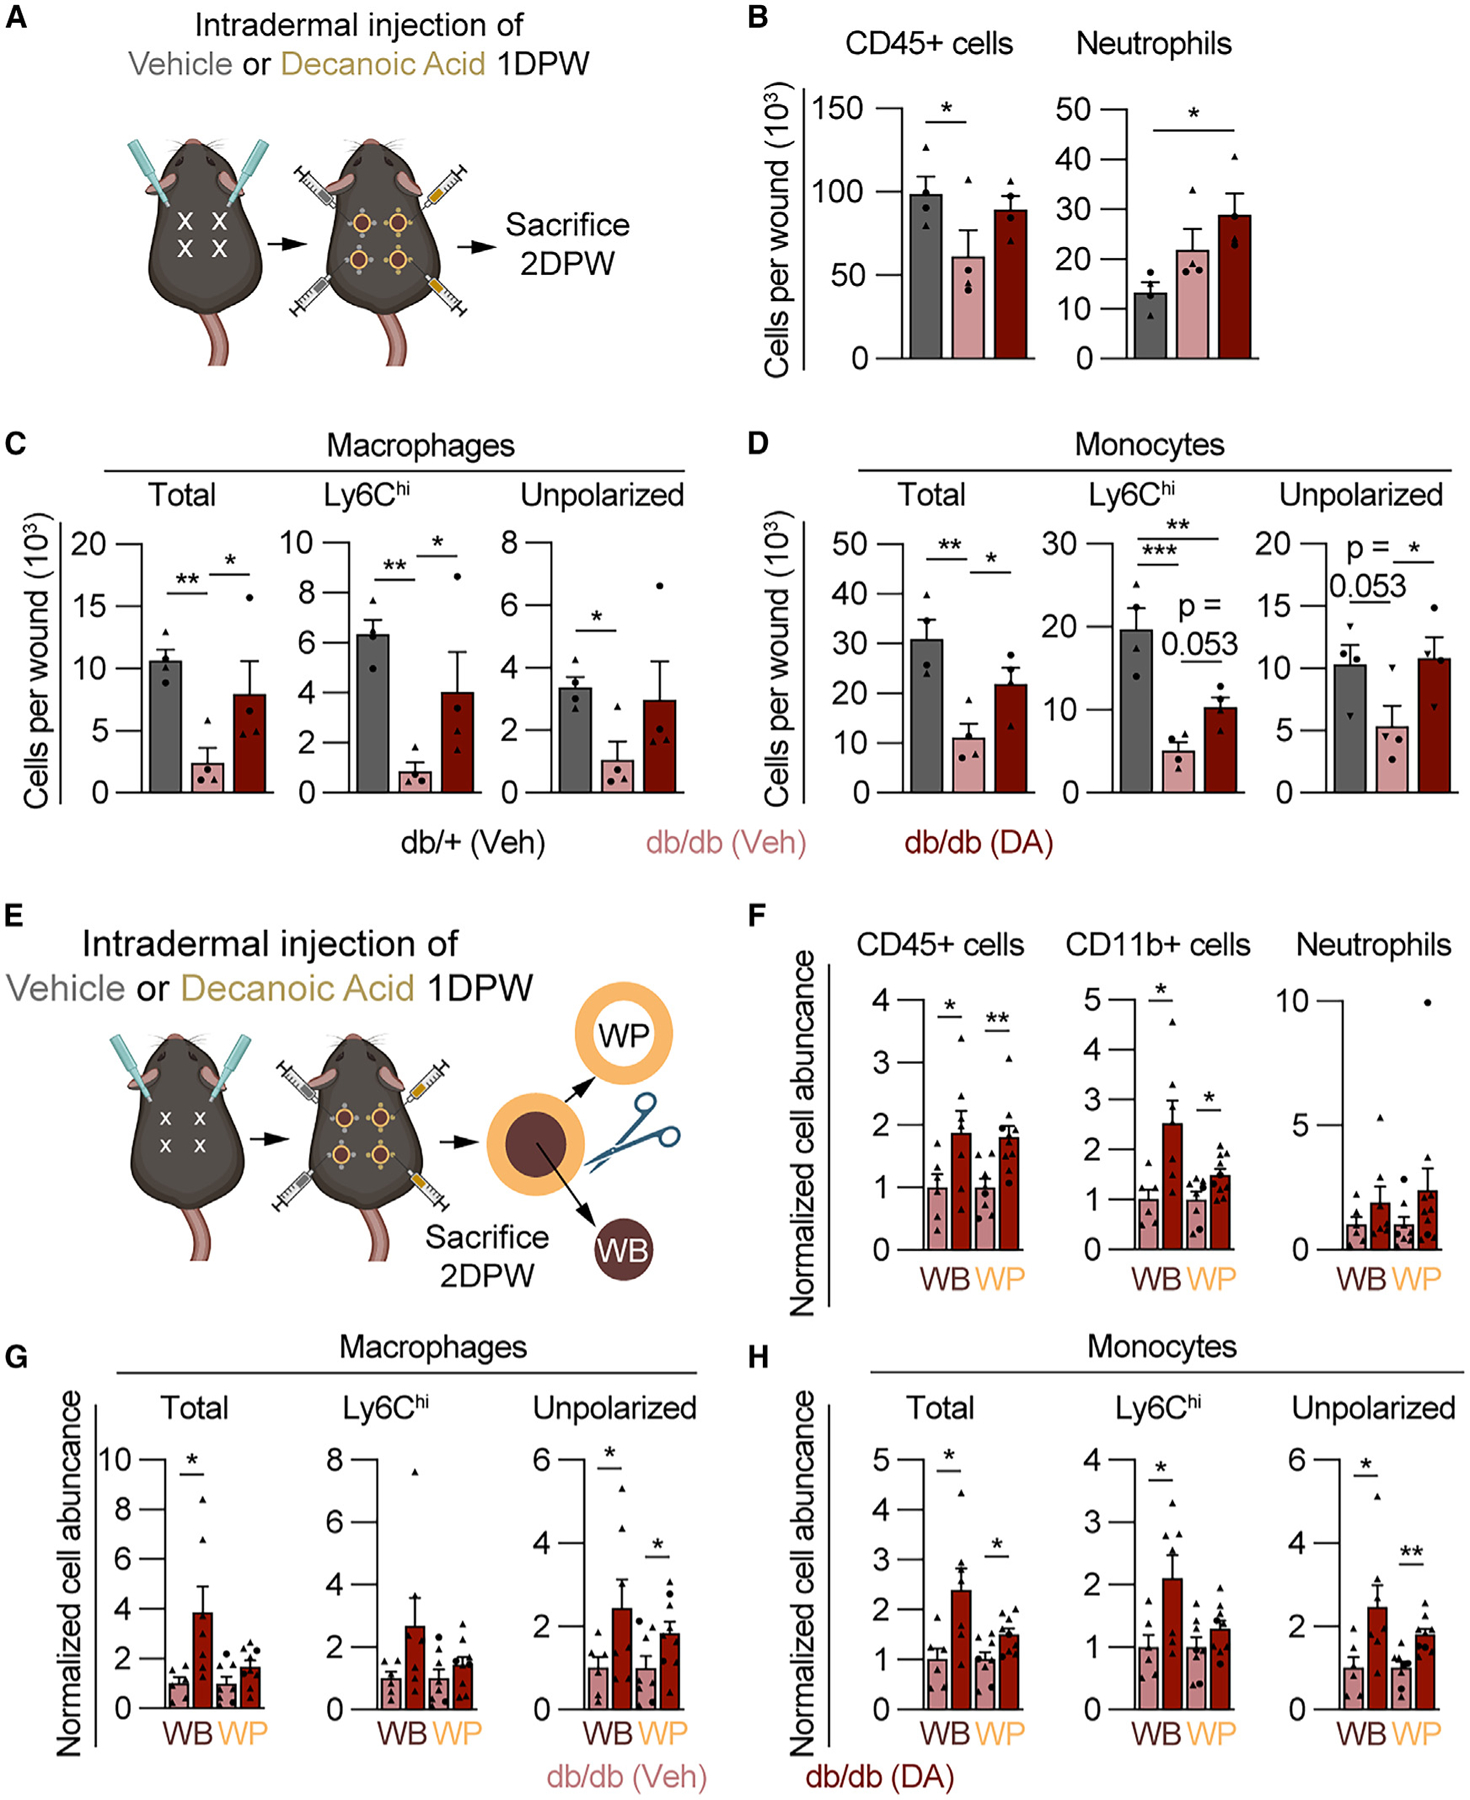
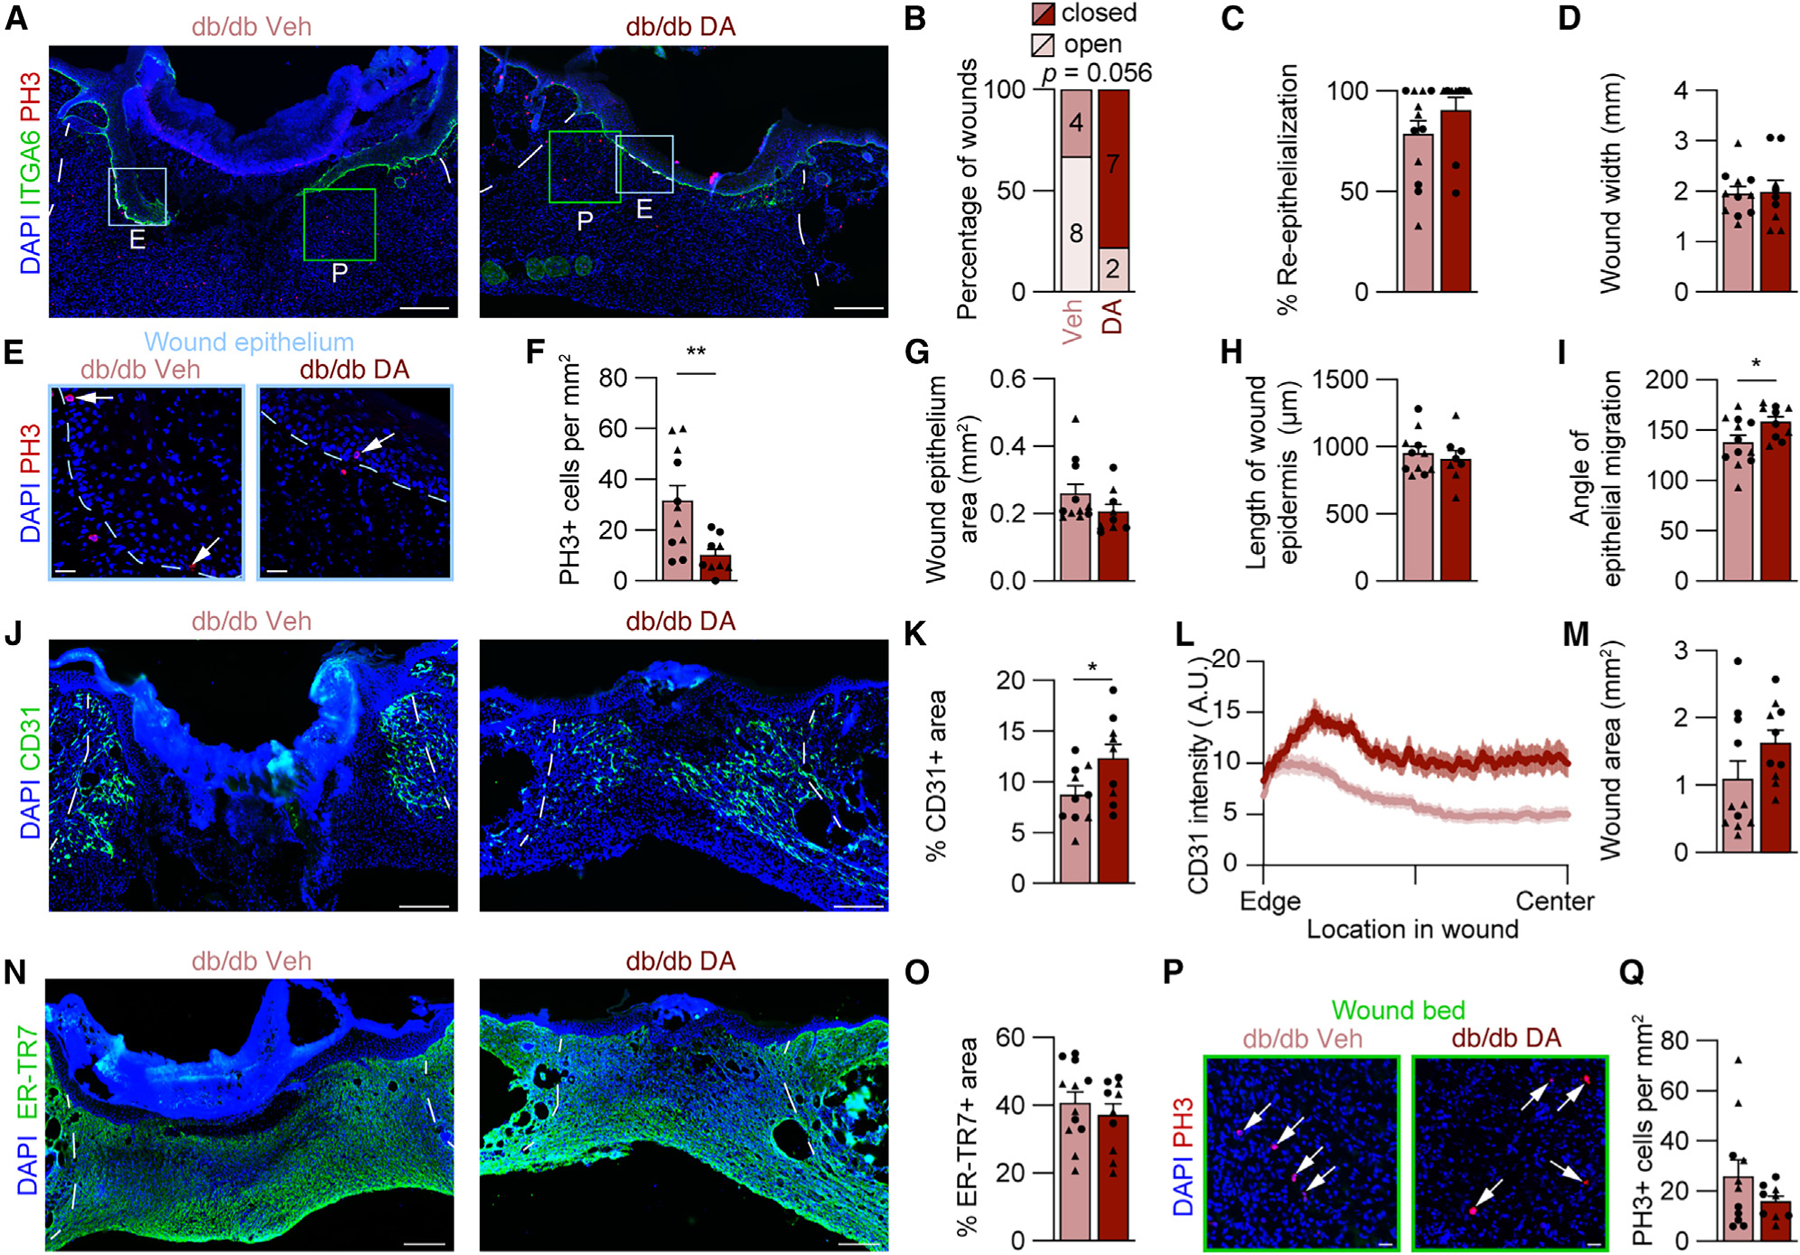
Lipids have emerged as potent regulators of immune cell function. In the skin, adipocyte lipolysis increases the local pool of free fatty acids and is essential for coordinating early macrophage inflammation following injury. Here, we investigate G-protein-coupled receptor 84 (GPR84), a medium-chain fatty acid (MCFA) receptor, for its potential to propagate pro-inflammatory signaling after skin injury. GPR84 signaling was identified as a key component of regulating myeloid cell numbers and subsequent tissue repair through in vivo administration of a pharmacological antagonist and the MCFA decanoic acid. We found that impaired injury-induced dermal adipocyte lipolysis is a hallmark of diabetes, and lipidomic analysis demonstrated that MCFAs are significantly reduced in diabetic murine wounds. Furthermore, local administration of decanoic acid rescued myeloid cell numbers and tissue repair during diabetic wound healing. Thus, GPR84 is a readily targetable lipid signaling pathway for manipulating injury-induced tissue inflammation with beneficial effects on acute diabetic healing.

Keywords: CP: Metabolism; GPR84; diabetes; inflammation; macrophage; medium-chain fatty acid; wound healing.


Conflict of interest statement

Declaration of interests The authors have no competing interests.

Figures

Figure 1.
Figure 1.. Inhibition of GPR84 reduces myeloid cell numbers during early inflammation
(A) Comparison of Gpr84 expression in immune, stromal, and keratinocyte cells from NW and 1.5 DPW skin relative to NW stromal vascular fraction (SVF) (n ≥ 3 male mice per condition). Significance was determined by one-way ANOVA prior to two-tailed Student’s t test between the cell type of interest and the NW SVF. (B) Schematic of the timeline of GLPG1205 treatment. (C–E) Quantification from flow cytometry analysis of SYTOX (C) immune cells (CD45+) and neutrophils, (D) total wound macrophages and Ly6Chi macrophages, and (E) total monocytes and Ly6Chi monocytes in wound beds (WBs) 2.5 DPW (n ≥ 9 mice, circles denote males and triangles denote females). Significance was determined by a two-tailed Student’s t test. Error bars indicate mean ± SEM. *p < 0.05, **p < 0.01, and ***p < 0.001. FC, fold change; M4, macrophage; Mo, monocyte; Neutro, neutrophil; Adip, adipocyte; Lin–, lineage-negative cells; NW, non-wounded; DPW, days post-wounding.
Figure 2.
Figure 2.. Injection of DA increases myeloid cell numbers during the inflammation phase of acute skin wound healing
(A) Schematic of decanoic acid (DA) treatment paradigm. (B–E) Quantification from flow cytometry analysis of Zombie (B) CD45+ cells, (C) total wound macrophages and Ly6Chi macrophages, (D) total monocytes and Ly6Chi monocytes, and (E) neutrophils 2 DPW (n = 10 wounds from 5 male mice per condition). (F) Spatial analysis of tissues immunostained for F4/80 to determine macrophage numbers in the wound bed (WB) and wound periphery (WP) of vehicle- and DA-treated animals. Dashed white lines delineate wound edges. Scale bars, 500 μm. (G) Quantification from flow cytometry analysis of SYTOX CD45+ immune cells in methyl cellulose- (MC; top) or GLPG1205 (bottom)-treated mice injected intradermally at the WP with vehicle (BSA) or DA (n ≥ 11 wounds for each condition in males). Error bars indicate mean ± SEM. Significance was determined using a two-tailed Student’s t test. *p < 0.05, **p < 0.01, ***p < 0.001, and ****p < 0.0001. M4, macrophage; DPW, days post-wounding; Epi, epidermis; RD, reticular dermis; DWAT, dermal white adipose tissue.
Figure 3.
Figure 3.. Inhibition of GPR84 signaling delays epidermal repair during skin wound healing
(A) Schematic of measurements used to assess the epithelium of wounds 7 DPW. (B) ITGA6 immunostained tissue sections from the center of wounds obtained from vehicle- and GLPG1205-treated mice. Asterisks indicate scab. (C–H) Quantification of parameters that assess epithelial repair including (C) WB re-epithelialization, (D) percentage of open versus closed wounds, (E) wound width and wound size, (F) length of wound epidermis, (G) wound epithelium area, and (H) the angle of epithelial migration. The angle of epithelial migration was measured on both sides of each section analyzed. (I) Tissue immunostained for KRT17 and PH3. High-magnification images show PH3 in the epithelium. Arrows point to PH3+ nuclei. (J) Quantification of PH3+ cells per area of wound epithelium (n ≥ 5 wounds from ≥3 male mice per condition). Dashed white lines delineate wound edges, and dashed blue lines delineate epithelium. Scale bars, 250 μm in composite images and 25 μm in high-magnification images. Error bars indicate mean ± SEM. Significance was determined using a two-tailed Student’s t test for all analyses except (D), where a Fisher’s exact test was used. *p < 0.05 and **p < 0.01. KRT17, keratin 17; PH3, phospho-histone H3.
Figure 4.
Figure 4.. GPR84 contributes to dermal repair
(A) Schematic of the area analyzed to quantify the WB (outlined in green) 7 DPW. (B) Images of 7 day wounds immunostained for ER-TR7 (fibroblasts) and quantification of (C) the percentage of ER-TR7+ area and (D) total WB area. (E–H) 7 day wounds immunostained for CD31 (revascularization) (E) and corresponding quantification of the spatial distribution of CD31 mean fluorescence intensity from the wound edge to the center of the WB (F), the area under the curve for CD31 intensity in the edge and central regions of WBs (G), and the percentage of CD31+ area (H) from vehicle- and GLPG1205-treated mice. The solid line and outer shading in (F) indicates mean ± SEM. (I) Tissue sections from the center of wounds immunostained for KRT17 and PH3. High-magnification images (green boxes) show PH3 in WBs. Arrows indicate PH3+ nuclei. (J) Quantification of PH3+ cells per area of WB (n ≥ 3 male mice per condition). White lines delineate wound edges. Scale bars, 250 μm in composites and 50 μm for high-magnification images. Error bars indicate mean ± SEM. Significance was determined by a two-tailed Student’s t test. *p < 0.05 and ****p < 0.0001. DWAT, dermal white adipose tissue; PC, panniculus carnosus; A.U., arbitrary units of fluorescence; KRT17, keratin 17; PH3, phospho-histone H3.
Figure 5.
Figure 5.. Changes in GPR84 signaling components in diabetic mouse skin wounds
(A) Schematic showing delineated DWAT and tissue components assessed by lipid GC/MS. (B) Quantification of lean (db/+) and diabetic (db/db) adipocyte cross-sectional area between NW, 16 HPW, and 1.5 DPW time points. (C) Images of db/+ and db/db and adipocytes from 16 HPW sections immunostained for PLIN1 and pPLIN1 (n ≥ 3 male mice per condition). Scale bars, 250 μm. (D) Lipid MS/MS quantification of total NEFAs detected in 1 DPW WP of lean control and diabetic mice (n ≥ 5 male mice per condition). (E and F) Quantitative RT-PCR analysis of Gpr84 expression in cells isolated from NW (E) and 1.5 DPW (F) db/+ and db/db skin by fluorescence-activated cell sorting (n ≥ 3 mice, circles denote males and triangles denote females). Error bars indicate mean ± SEM. Significance was determined for (B) using a one-way ANOVA followed by a two-tailed Student’s t test, for (D) using two-way ANOVA with Šidák correction, and for (E) using a two-tailed Student’s t test. *p < 0.05, **p < 0.01, ***p < 0.001, and ****p < 0.0001. DWAT, dermal white adipose tissue; NW, non-wounded; HPW, hours post-wounding; DPW, days post-wounding; PLIN1, Perilipin 1; NEFA, non-esterified fatty acids; PC, panniculus carnosus; FC, fold change; SVF, stromal vascular fraction.
Figure 6.
Figure 6.. DA increases myeloid cell numbers 2 DPW in diabetic mice
(A) Schematic showing the timeline for DA treatment and myeloid cell analysis. (B–D) Quantification of flow cytometry for SYTOX (B) CD45+ cells and neutrophils, (C) macrophages (total, Ly6Chi, and unpolarized), and (D) monocytes (total, Ly6Chi, and unpolarized) 2 DPW in db/+ mice treated with vehicle and db/db mice treated with vehicle or DA (n = 4 mice, circles denote males and triangles denote females). Significance was determined in (B)–(D) by one-way ANOVA corrected for multiple comparisons using the two-stage setup method of Benjamini, Krieger, and Yekutieli. (E–H) Schematic showing the procedure for separation of WB from WP, for flow cytometry analysis of SYTOX (F) CD45+ cells, myeloid cells (CD11b+), and neutrophils, (G) macrophage subsets, and (H) monocytes (n ≥ 9 wounds per condition, circles denote males and triangles denote females). Significance was determined by a two-tailed Student’s t test. Error bars indicate mean ± SEM. *p < 0.05, **p < 0.01, and ***p < 0.001. M4, macrophage; DPW, days post-wounding; DA, decanoic acid.
Figure 7.
Figure 7.. DA treatment improves diabetic wound healing
(A) Composite images of 7 DPW tissue sections from vehicle- and DA-treated db/db mouse wounds immunostained for ITGA6 and PH3. Boxes indicating high-magnification areas shown in (E) and (P), and blue and green boxes indicate regions in epithelial and WB images, respectively. (B–D) Corresponding quantification of (B) the percentage of open versus closed wounds, (C) percentage of re-epithelialization, and (D) wound width. (E) High-magnification images from (A) showing PH3 in the wound epithelium. Arrows indicate PH3+ nuclei. (F) Quantification of PH3+ cells per area of wound epithelium. (G–I) Quantitative comparison of (G) wound epithelium area, (H) length of wound epidermis, and (I) angle of epithelial migration at the center of WBs. The angle of epithelial migration was measured on both sides of each section analyzed. (J–M) Images of 7 DPW sections immunostained for CD31 (J) and quantifications of percentage of CD31+ area (K), CD31 average spatial intensity from wound edge to center (L), and wound area (M). The solid line and outer shading in (L) indicates mean ± SEM. (N and O) Images from immunostained tissue sections for ER-TR7 (N) and quantification of the percentage of ER-TR7+ area (O). (P and Q) High-magnification area showing PH3+ cells in the WB (arrows indicate PH3+ nuclei) (P) and PH3+ cells per area of WB (Q) (n ≥ 5 mice per condition, circles denote males and triangles denote females). Blue dotted lines delineate wound epithelium, and white lines delineate wound edges. Scale bars, 250 μm for low-magnification composite images and 25 μm for high-magnification images. Error bars indicate mean ± SEM. Significance was determined using a two-tailed Student’s t test for all analyses except (B), where a Fisher’s exact test was used. *p < 0.05 and **p < 0.01. DPW, days post-wounding; A.U., arbitrary units of fluorescence; ITGA6, integrin 6a; PH3, phospho-histone H3; DA, decanoic acid; A.U., arbitrary units.

References

    1. Eming SA, Krieg T, and Davidson JM (2007). Inflammation in wound repair: molecular and cellular mechanisms. J. Invest. Dermatol. 127, 514–525. 10.1038/sj.jid.5700701. - DOI - PubMed
    1. Ridiandries A, Tan JTM, and Bursill CA (2018). The Role of Chemokines in Wound Healing. Int. J. Mol. Sci. 19, 3217. 10.3390/ijms19103217. - DOI - PMC - PubMed
    1. de Oliveira S, Rosowski EE, and Huttenlocher A (2016). Neutrophil migration in infection and wound repair: going forward in reverse. Nat. Rev. Immunol. 16, 378–391. 10.1038/nri.2016.49. - DOI - PMC - PubMed
    1. Gurtner GC, Werner S, Barrandon Y, and Longaker MT (2008). Wound repair and regeneration. Nature 453, 314–321. 10.1038/nature07039. - DOI - PubMed
    1. Zomer HD, and Trentin AG (2018). Skin wound healing in humans and mice: Challenges in translational research. J. Dermatol. Sci. 90, 3–12. 10.1016/j.jdermsci.2017.12.009. - DOI - PubMed

Publication types