. 2024 Jun 4;121(23):e2318641121.
doi: 10.1073/pnas.2318641121. Epub 2024 May 30.

In vivo whole-cortex marker of excitation-inhibition ratio indexes cortical maturation and cognitive ability in youth

Affiliations

In vivo whole-cortex marker of excitation-inhibition ratio indexes cortical maturation and cognitive ability in youth

Shaoshi Zhang et al. Proc Natl Acad Sci U S A. .

Abstract

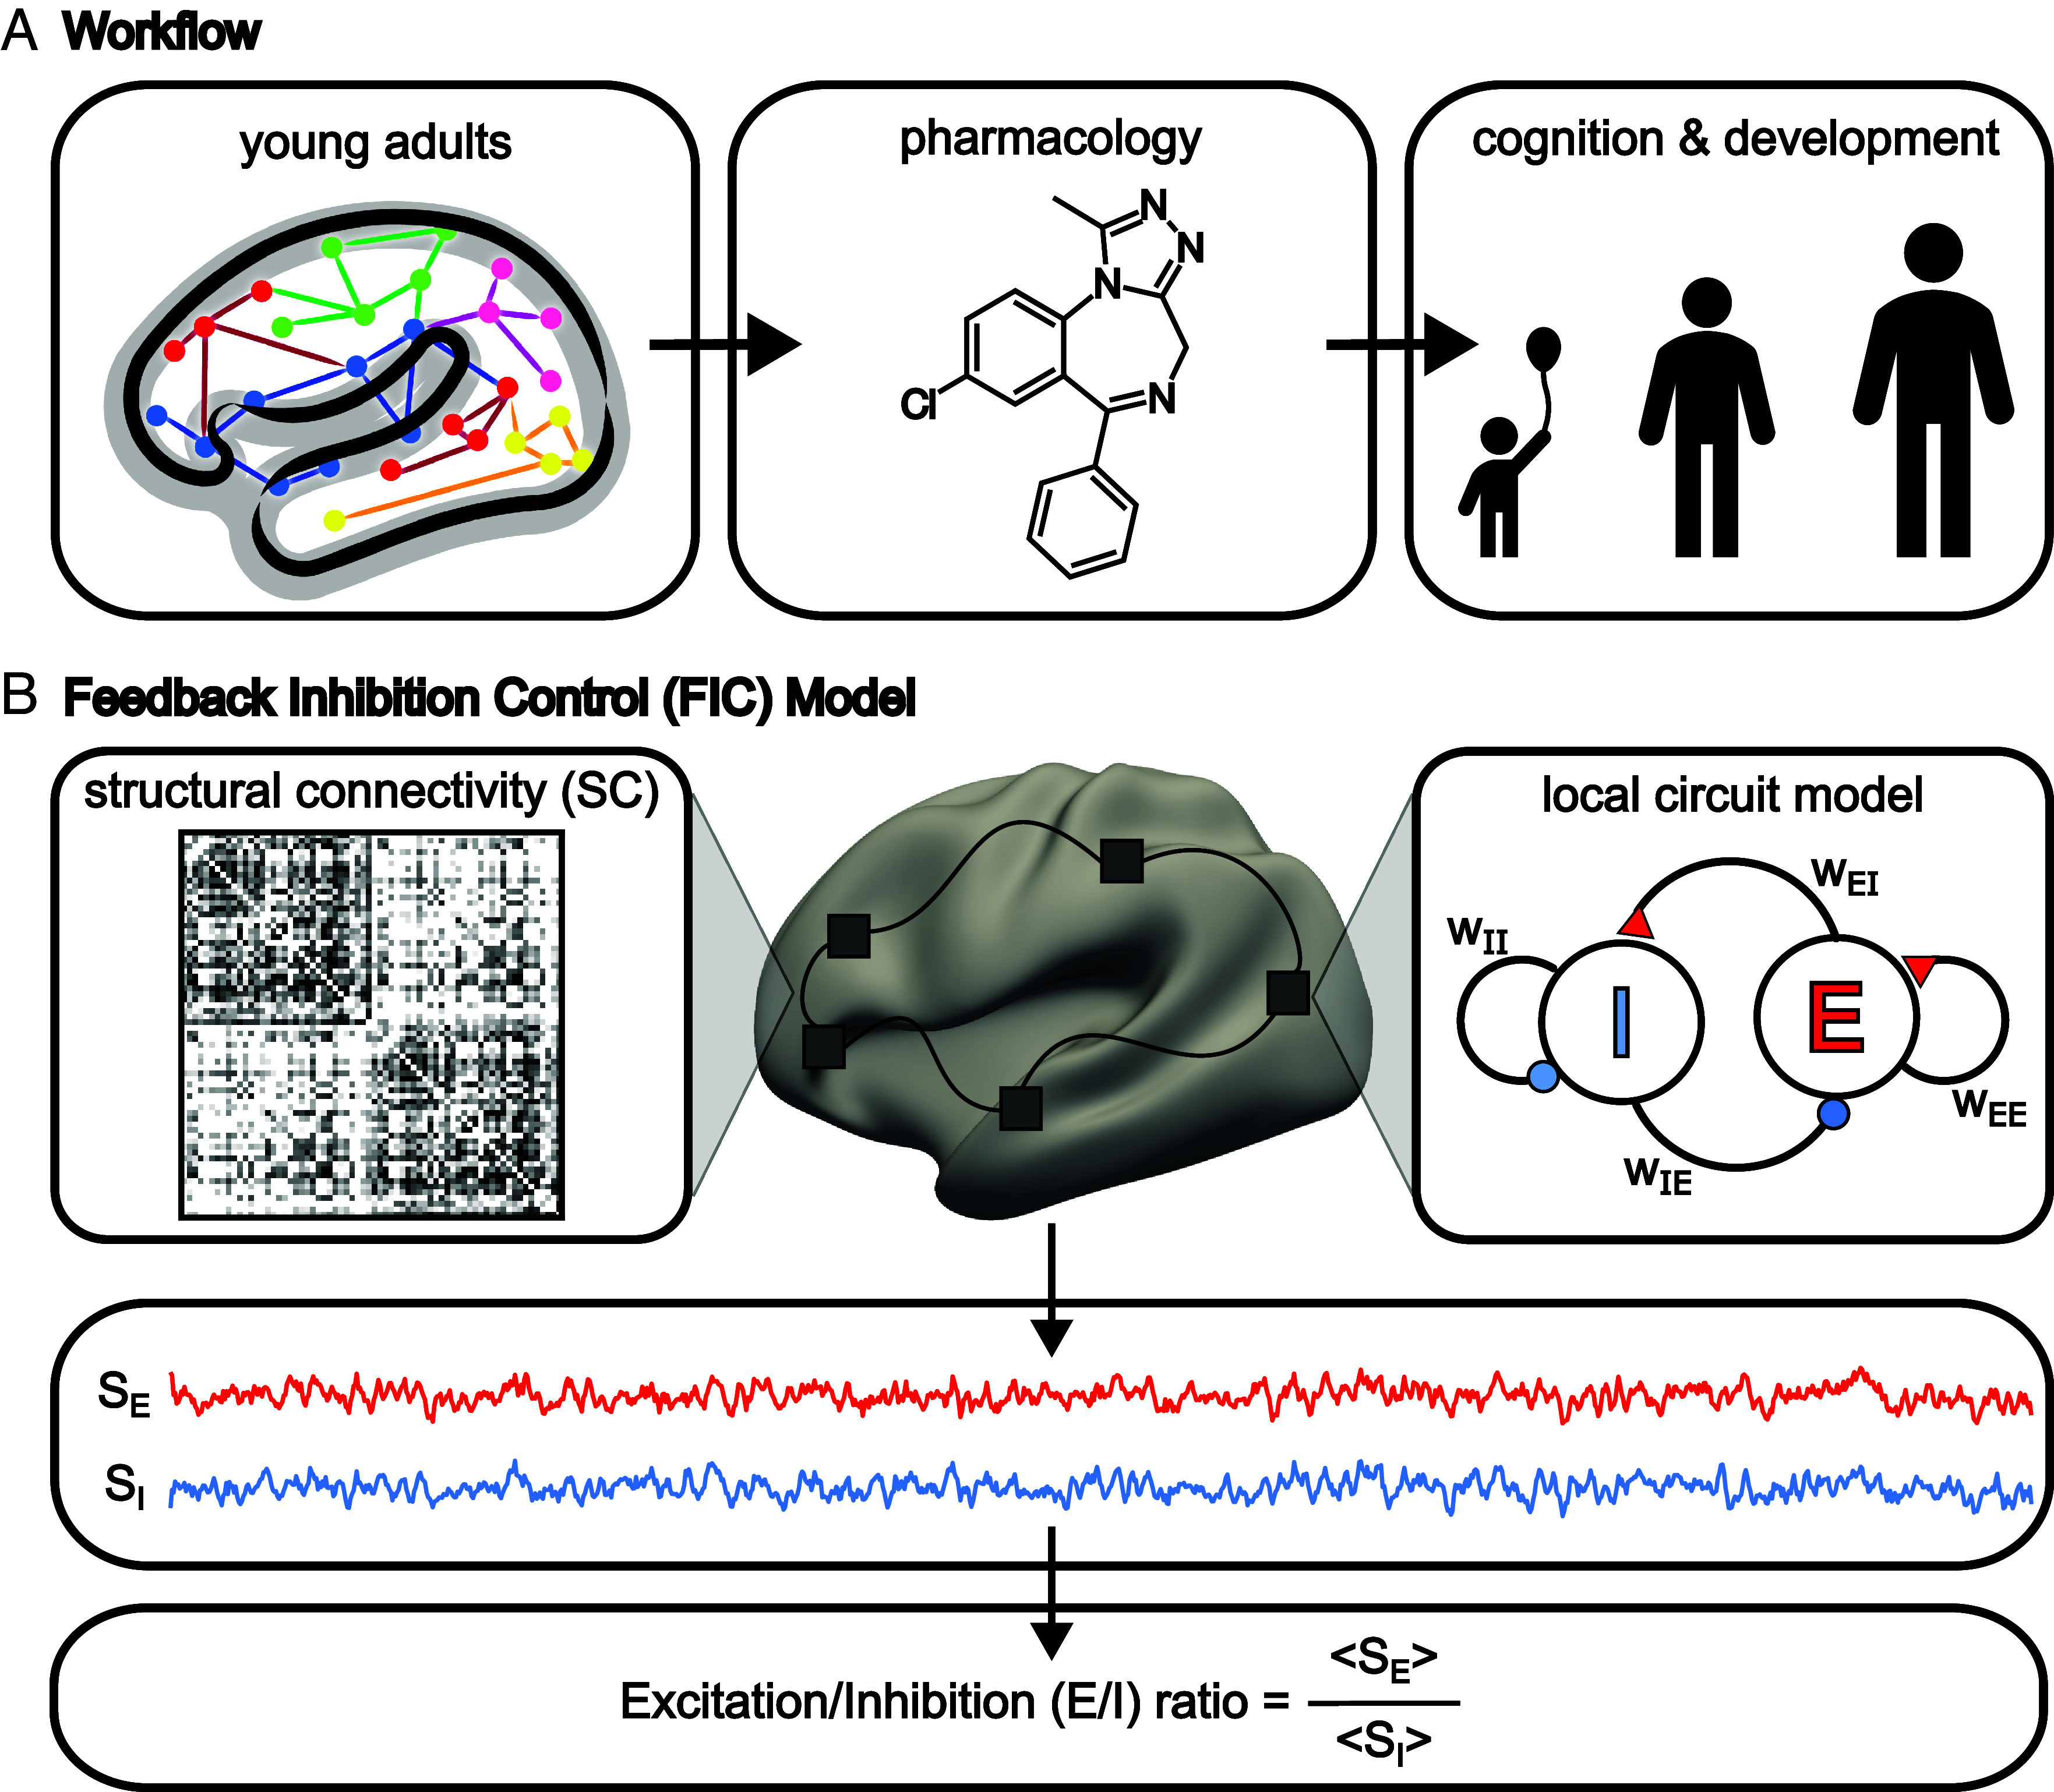
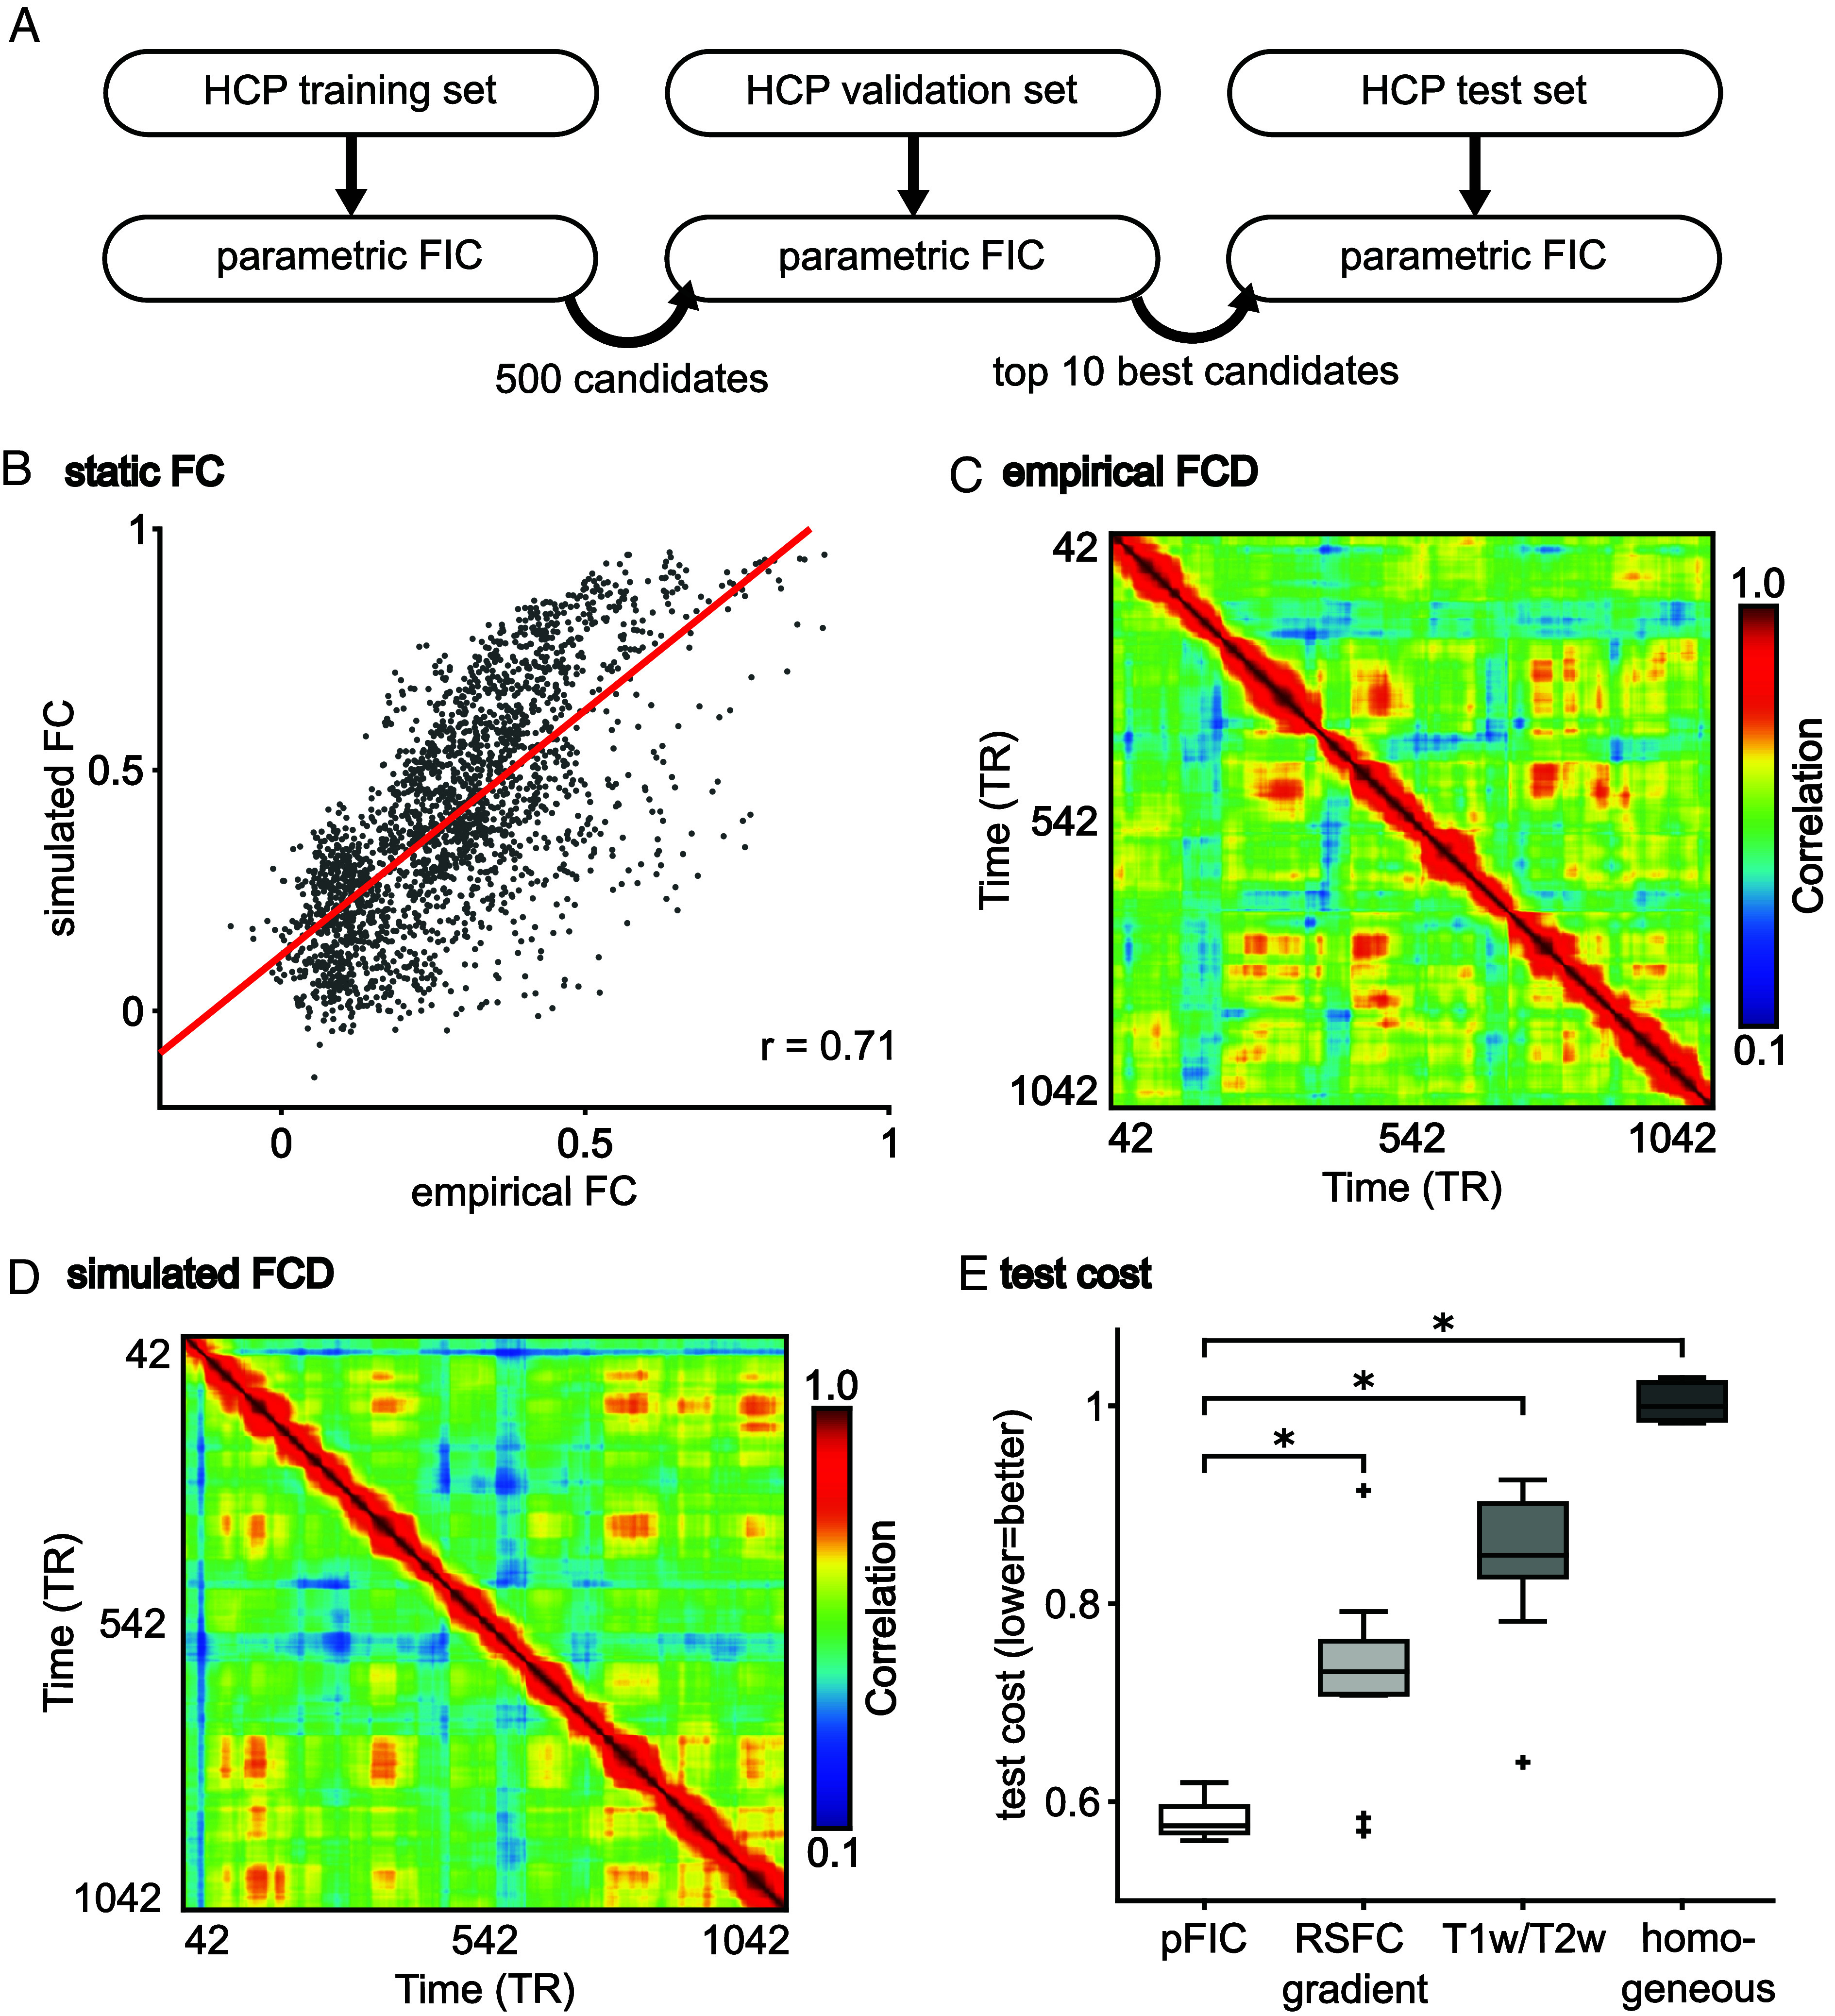
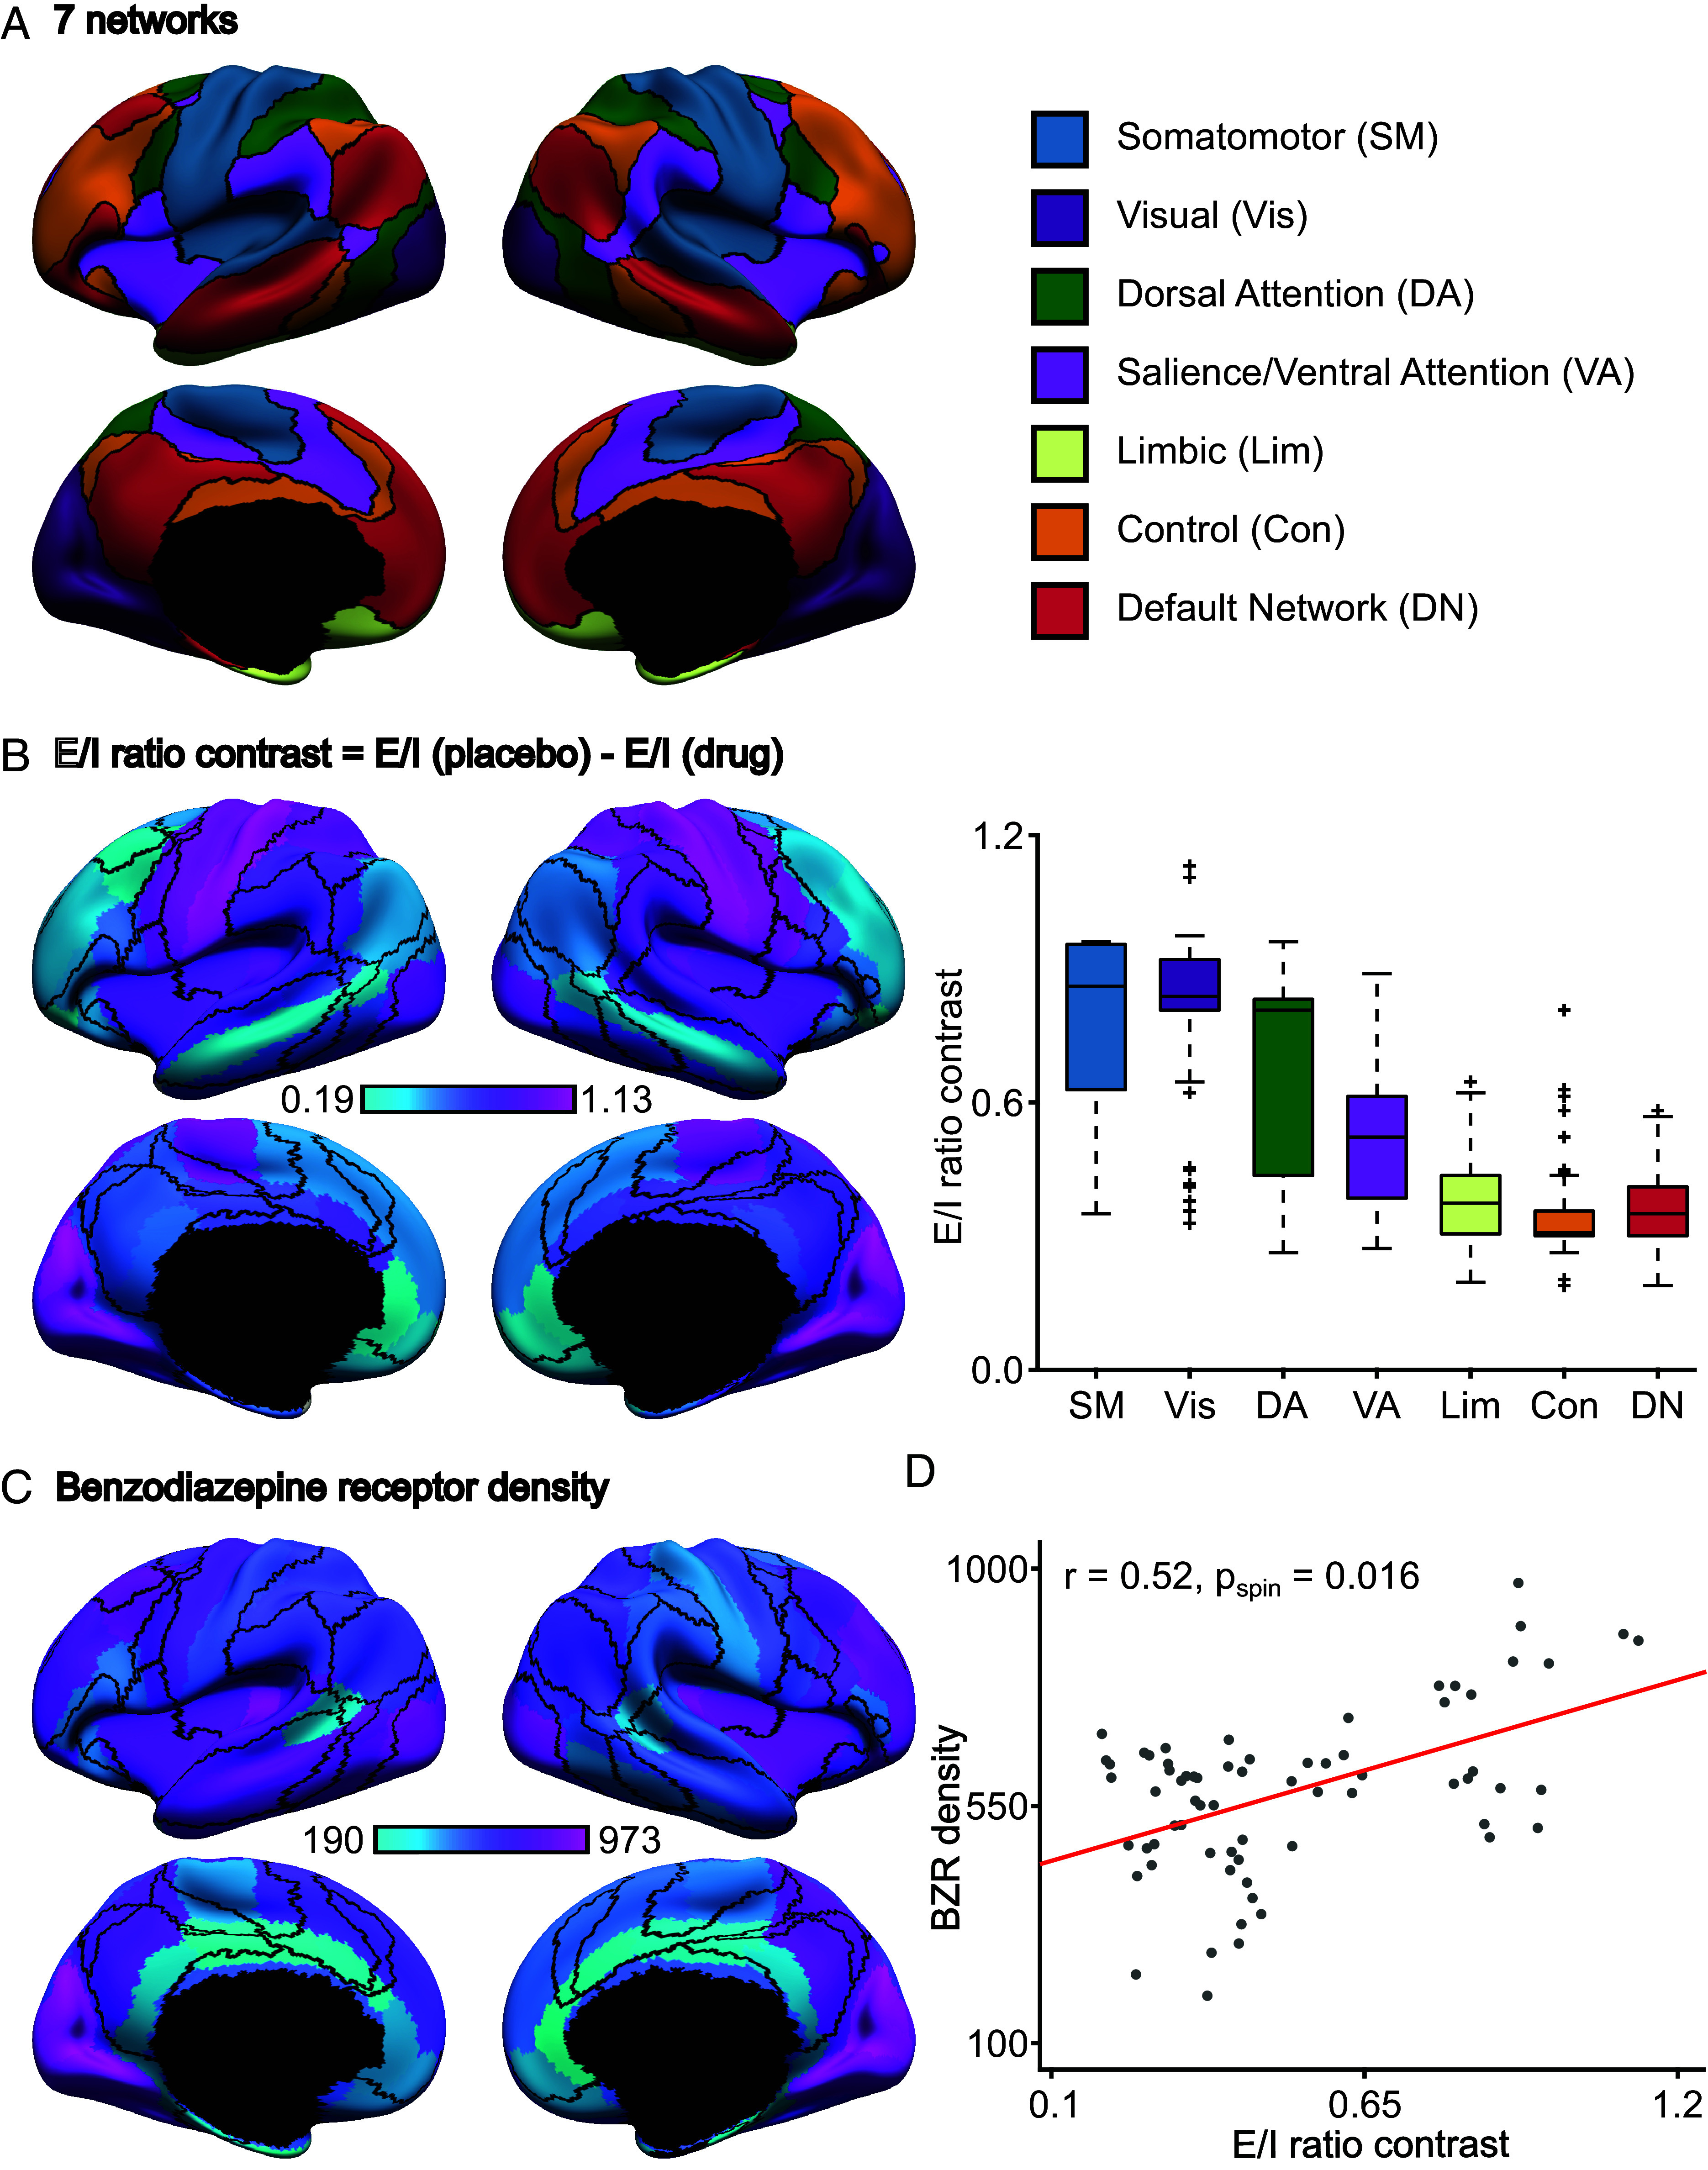
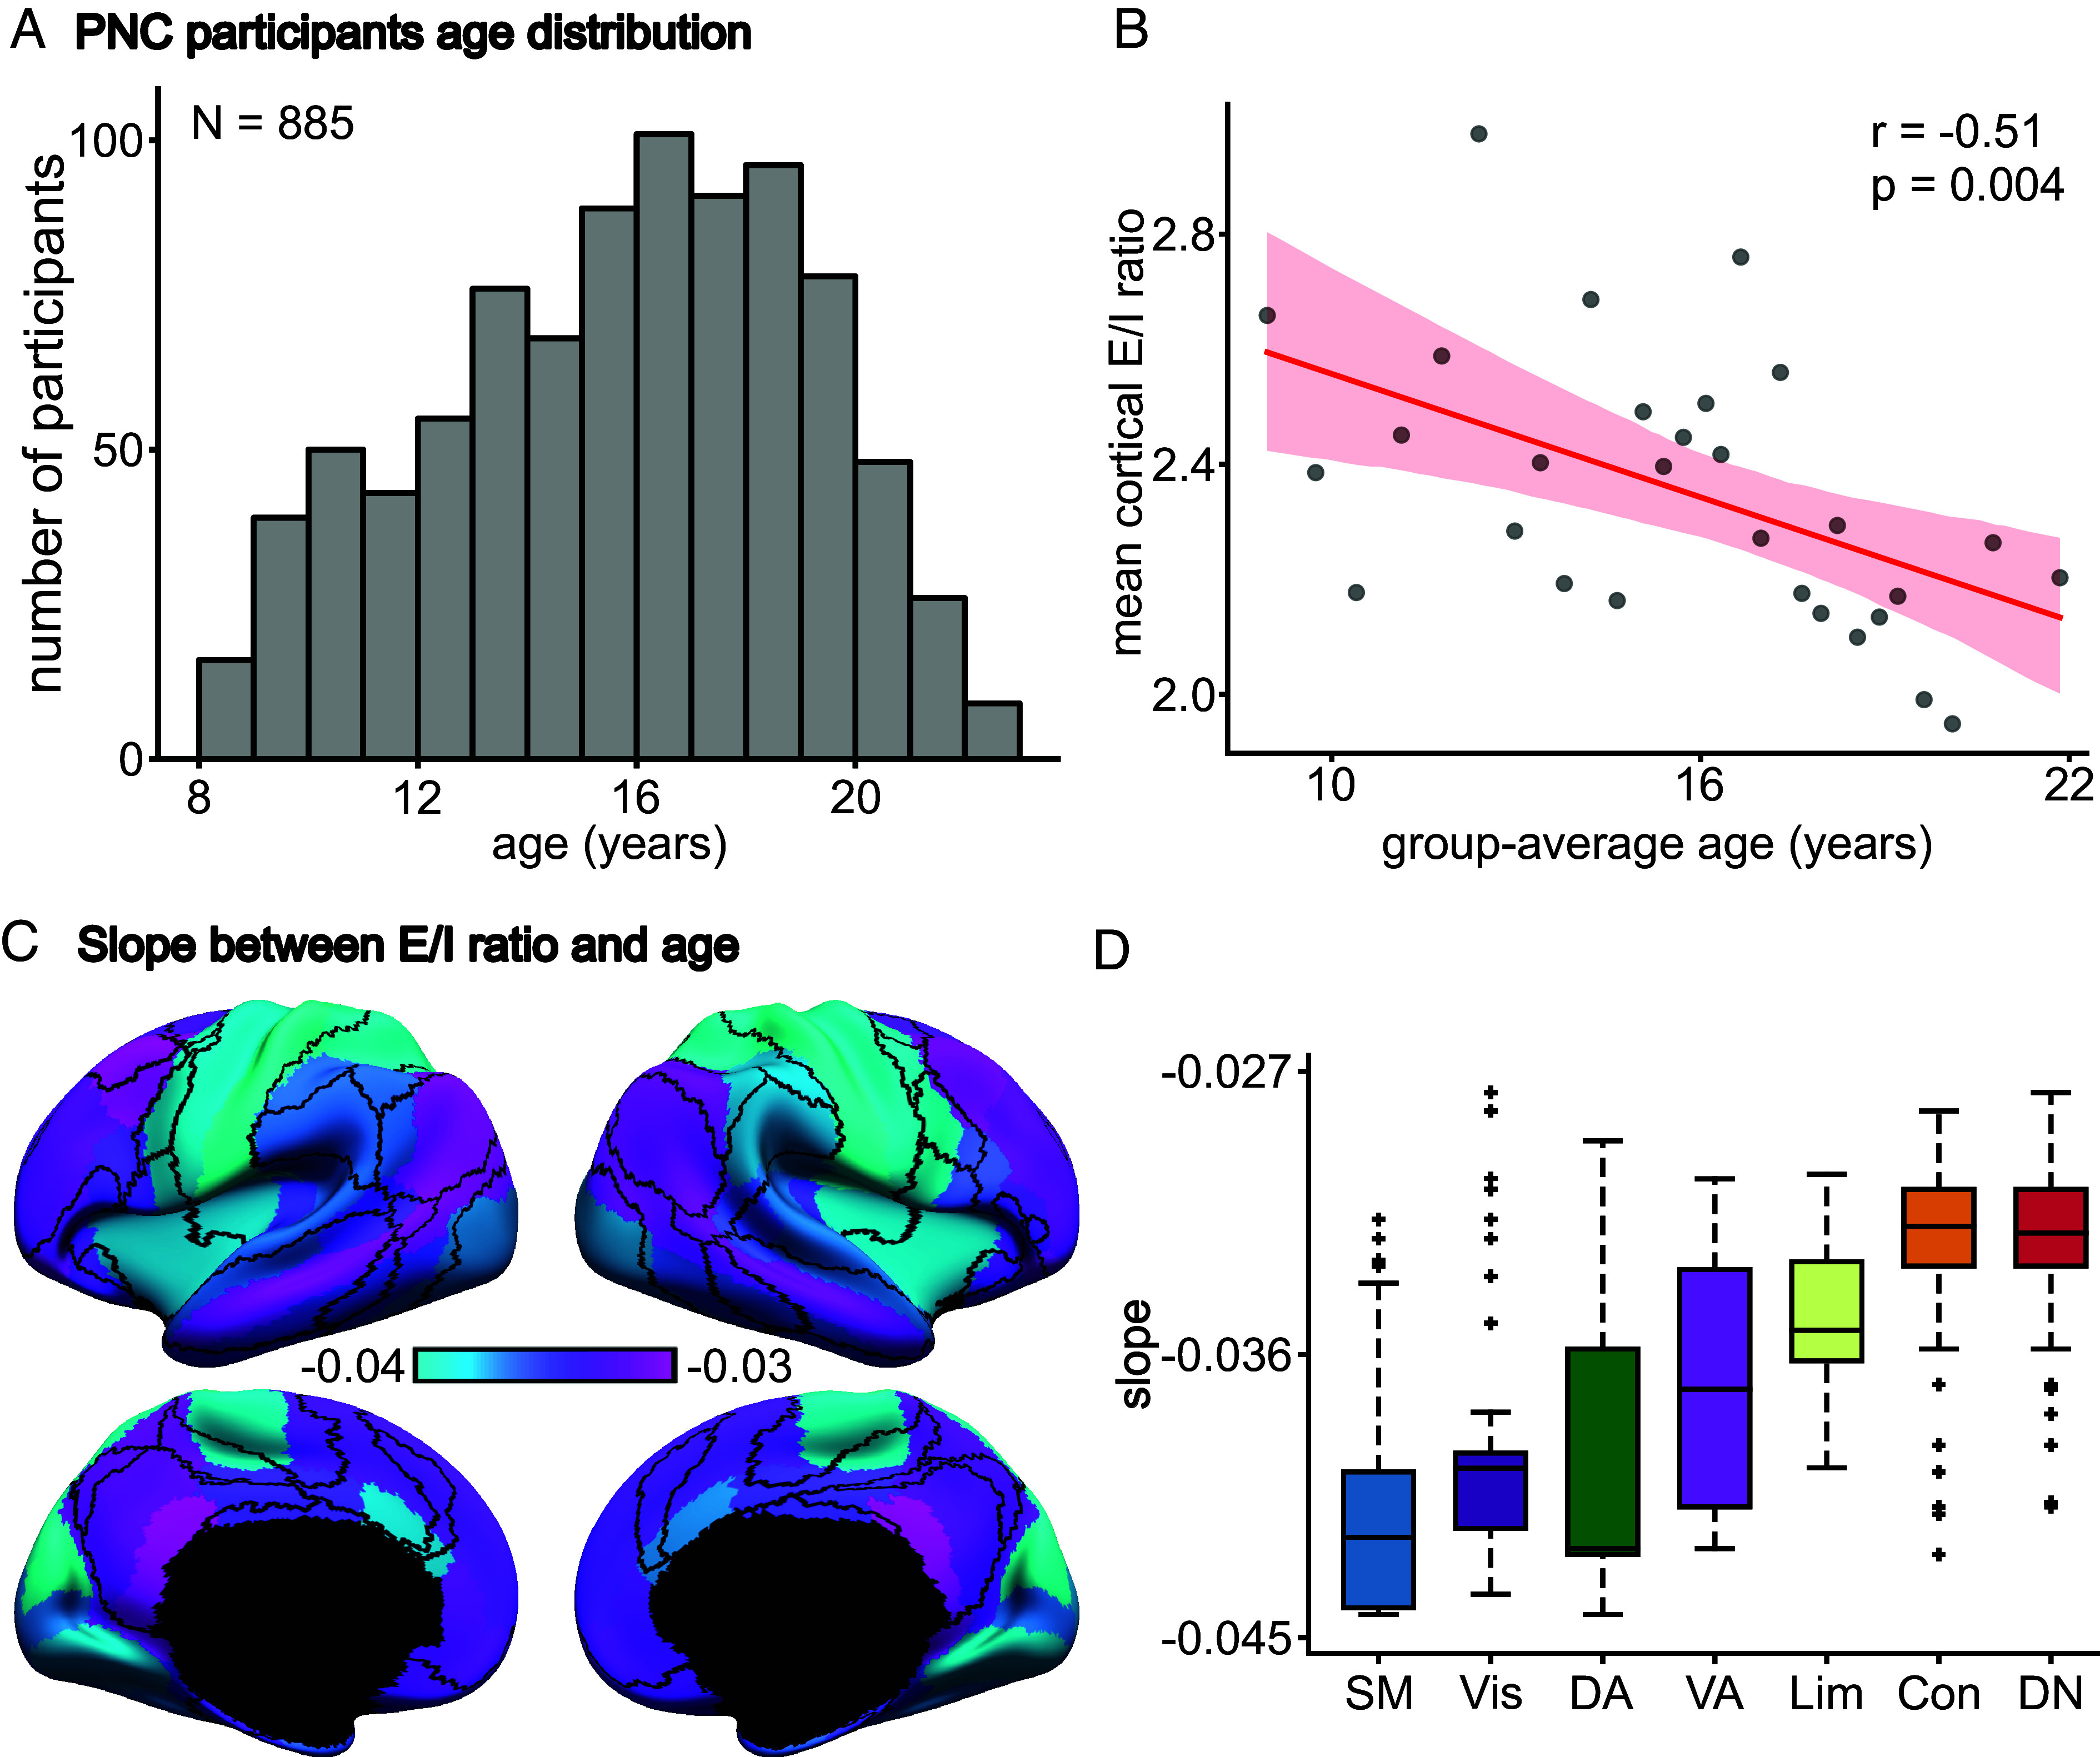
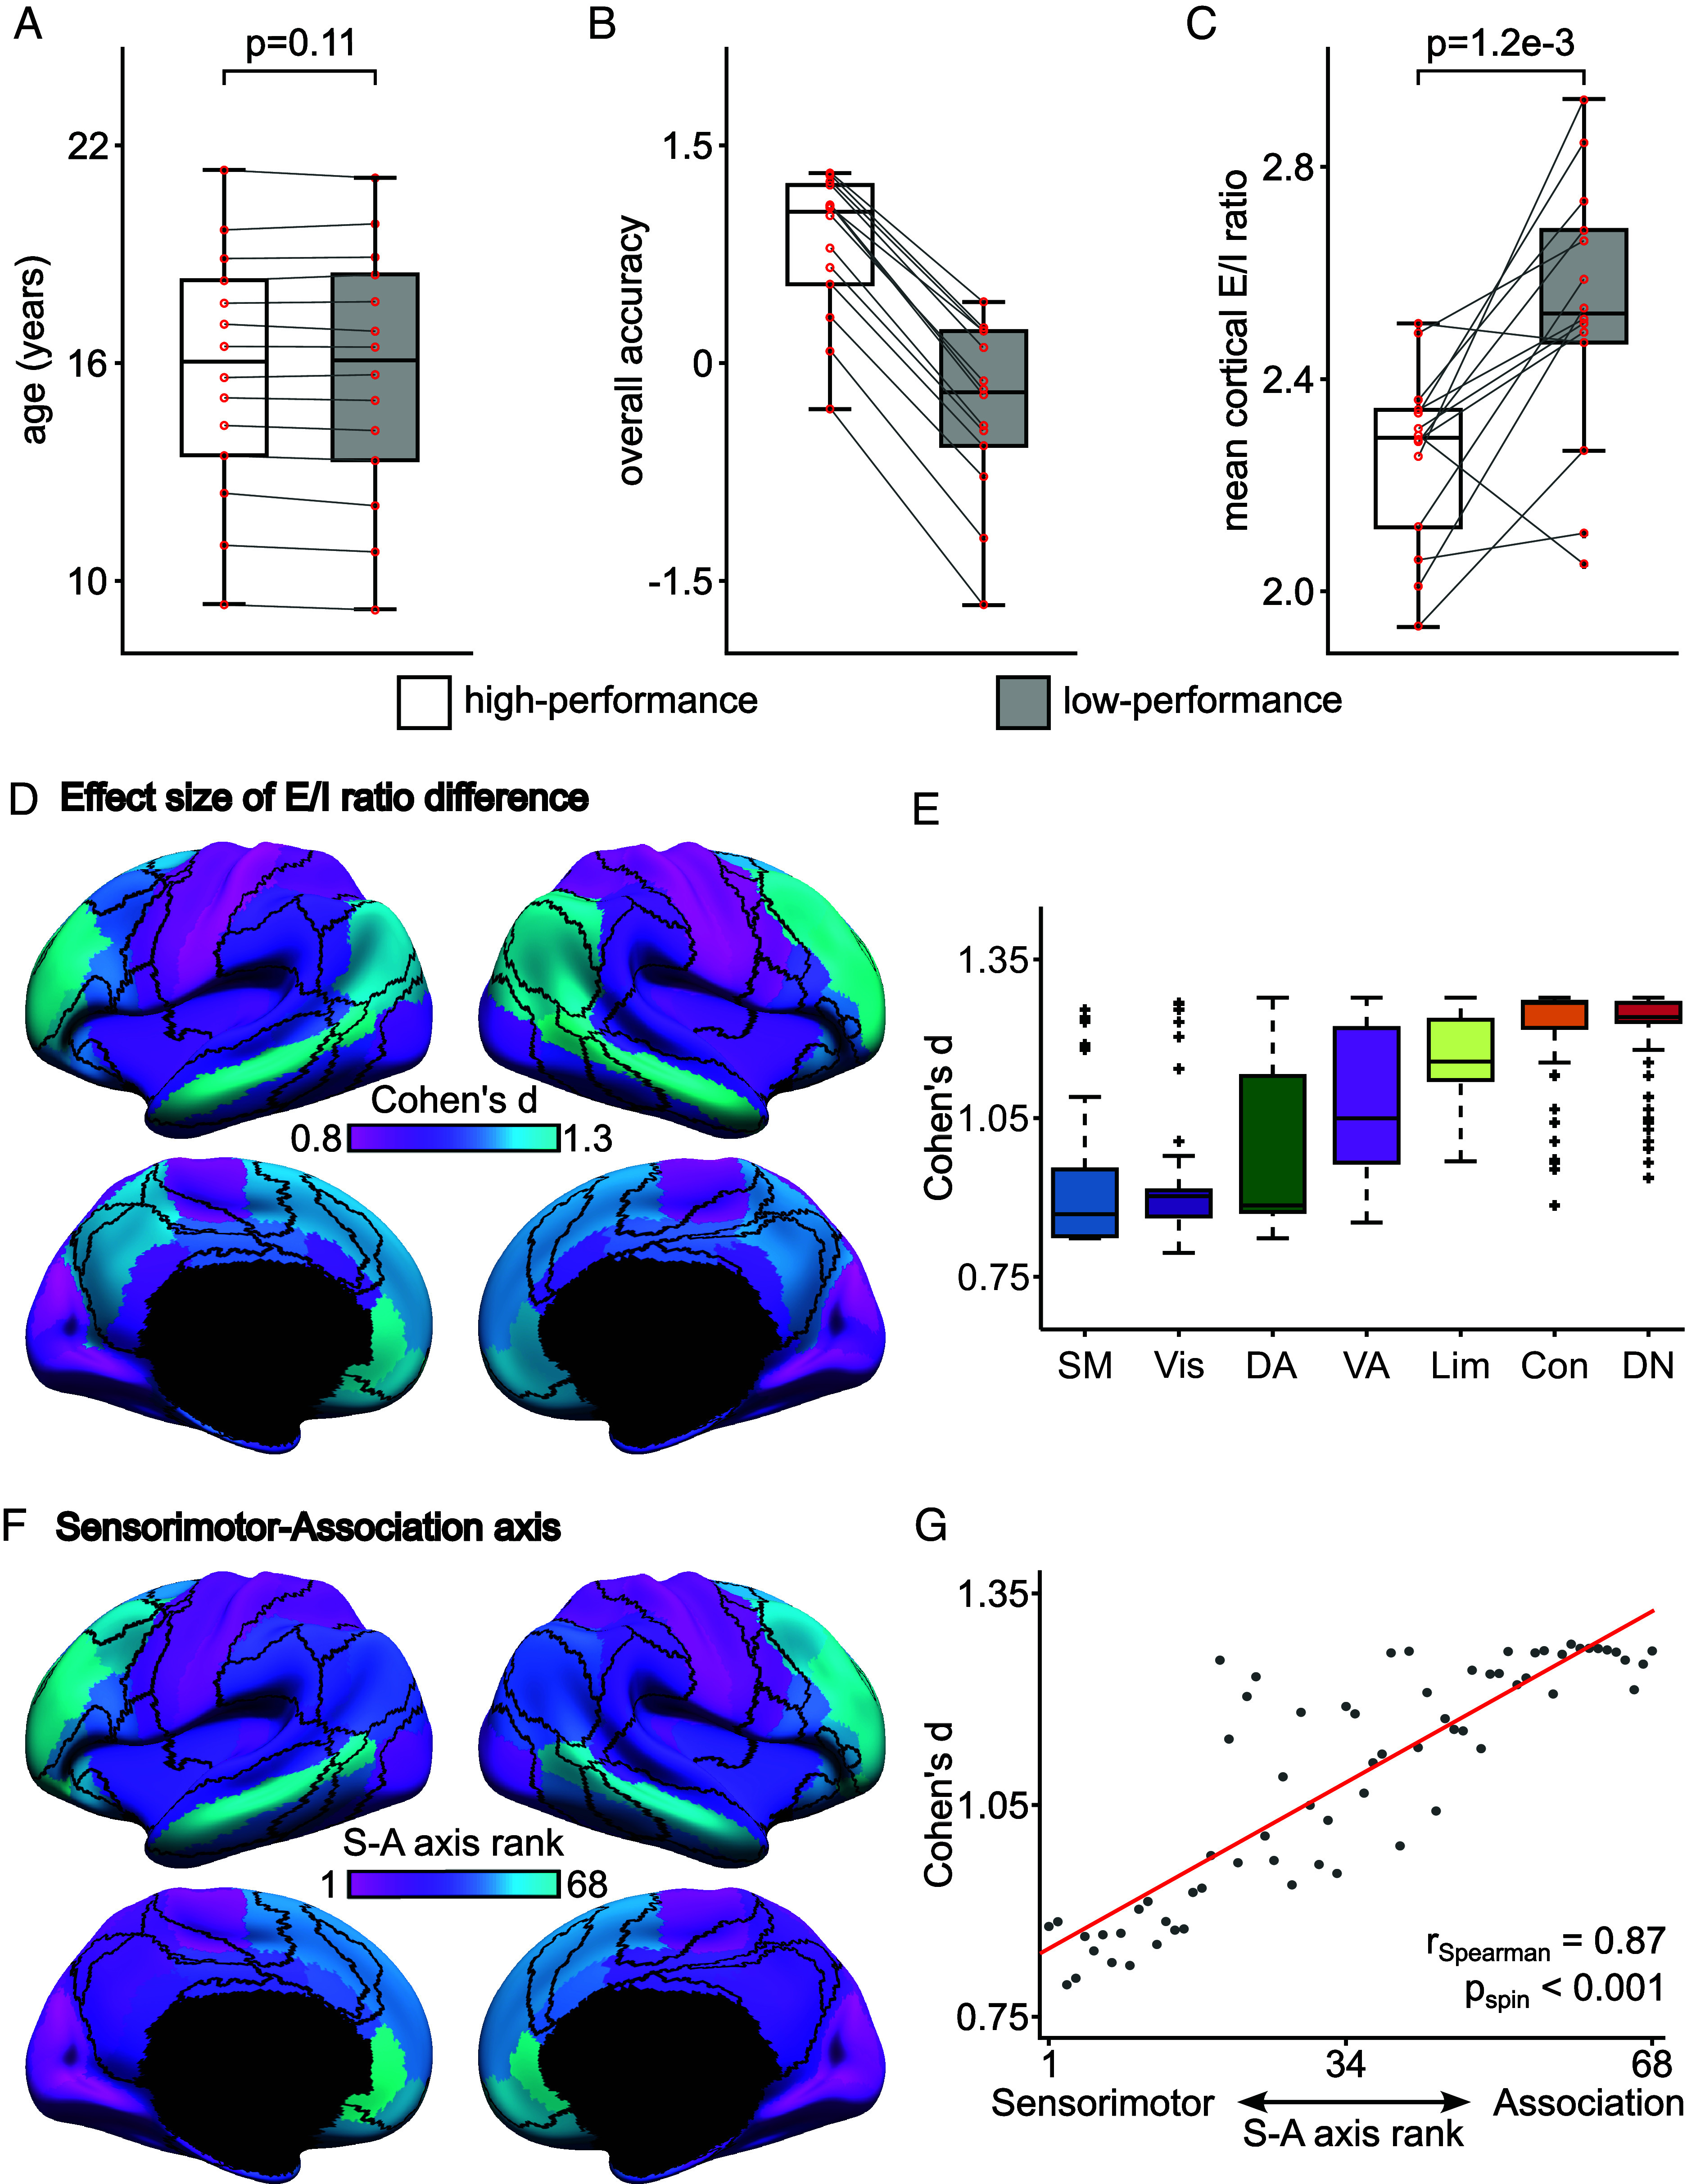
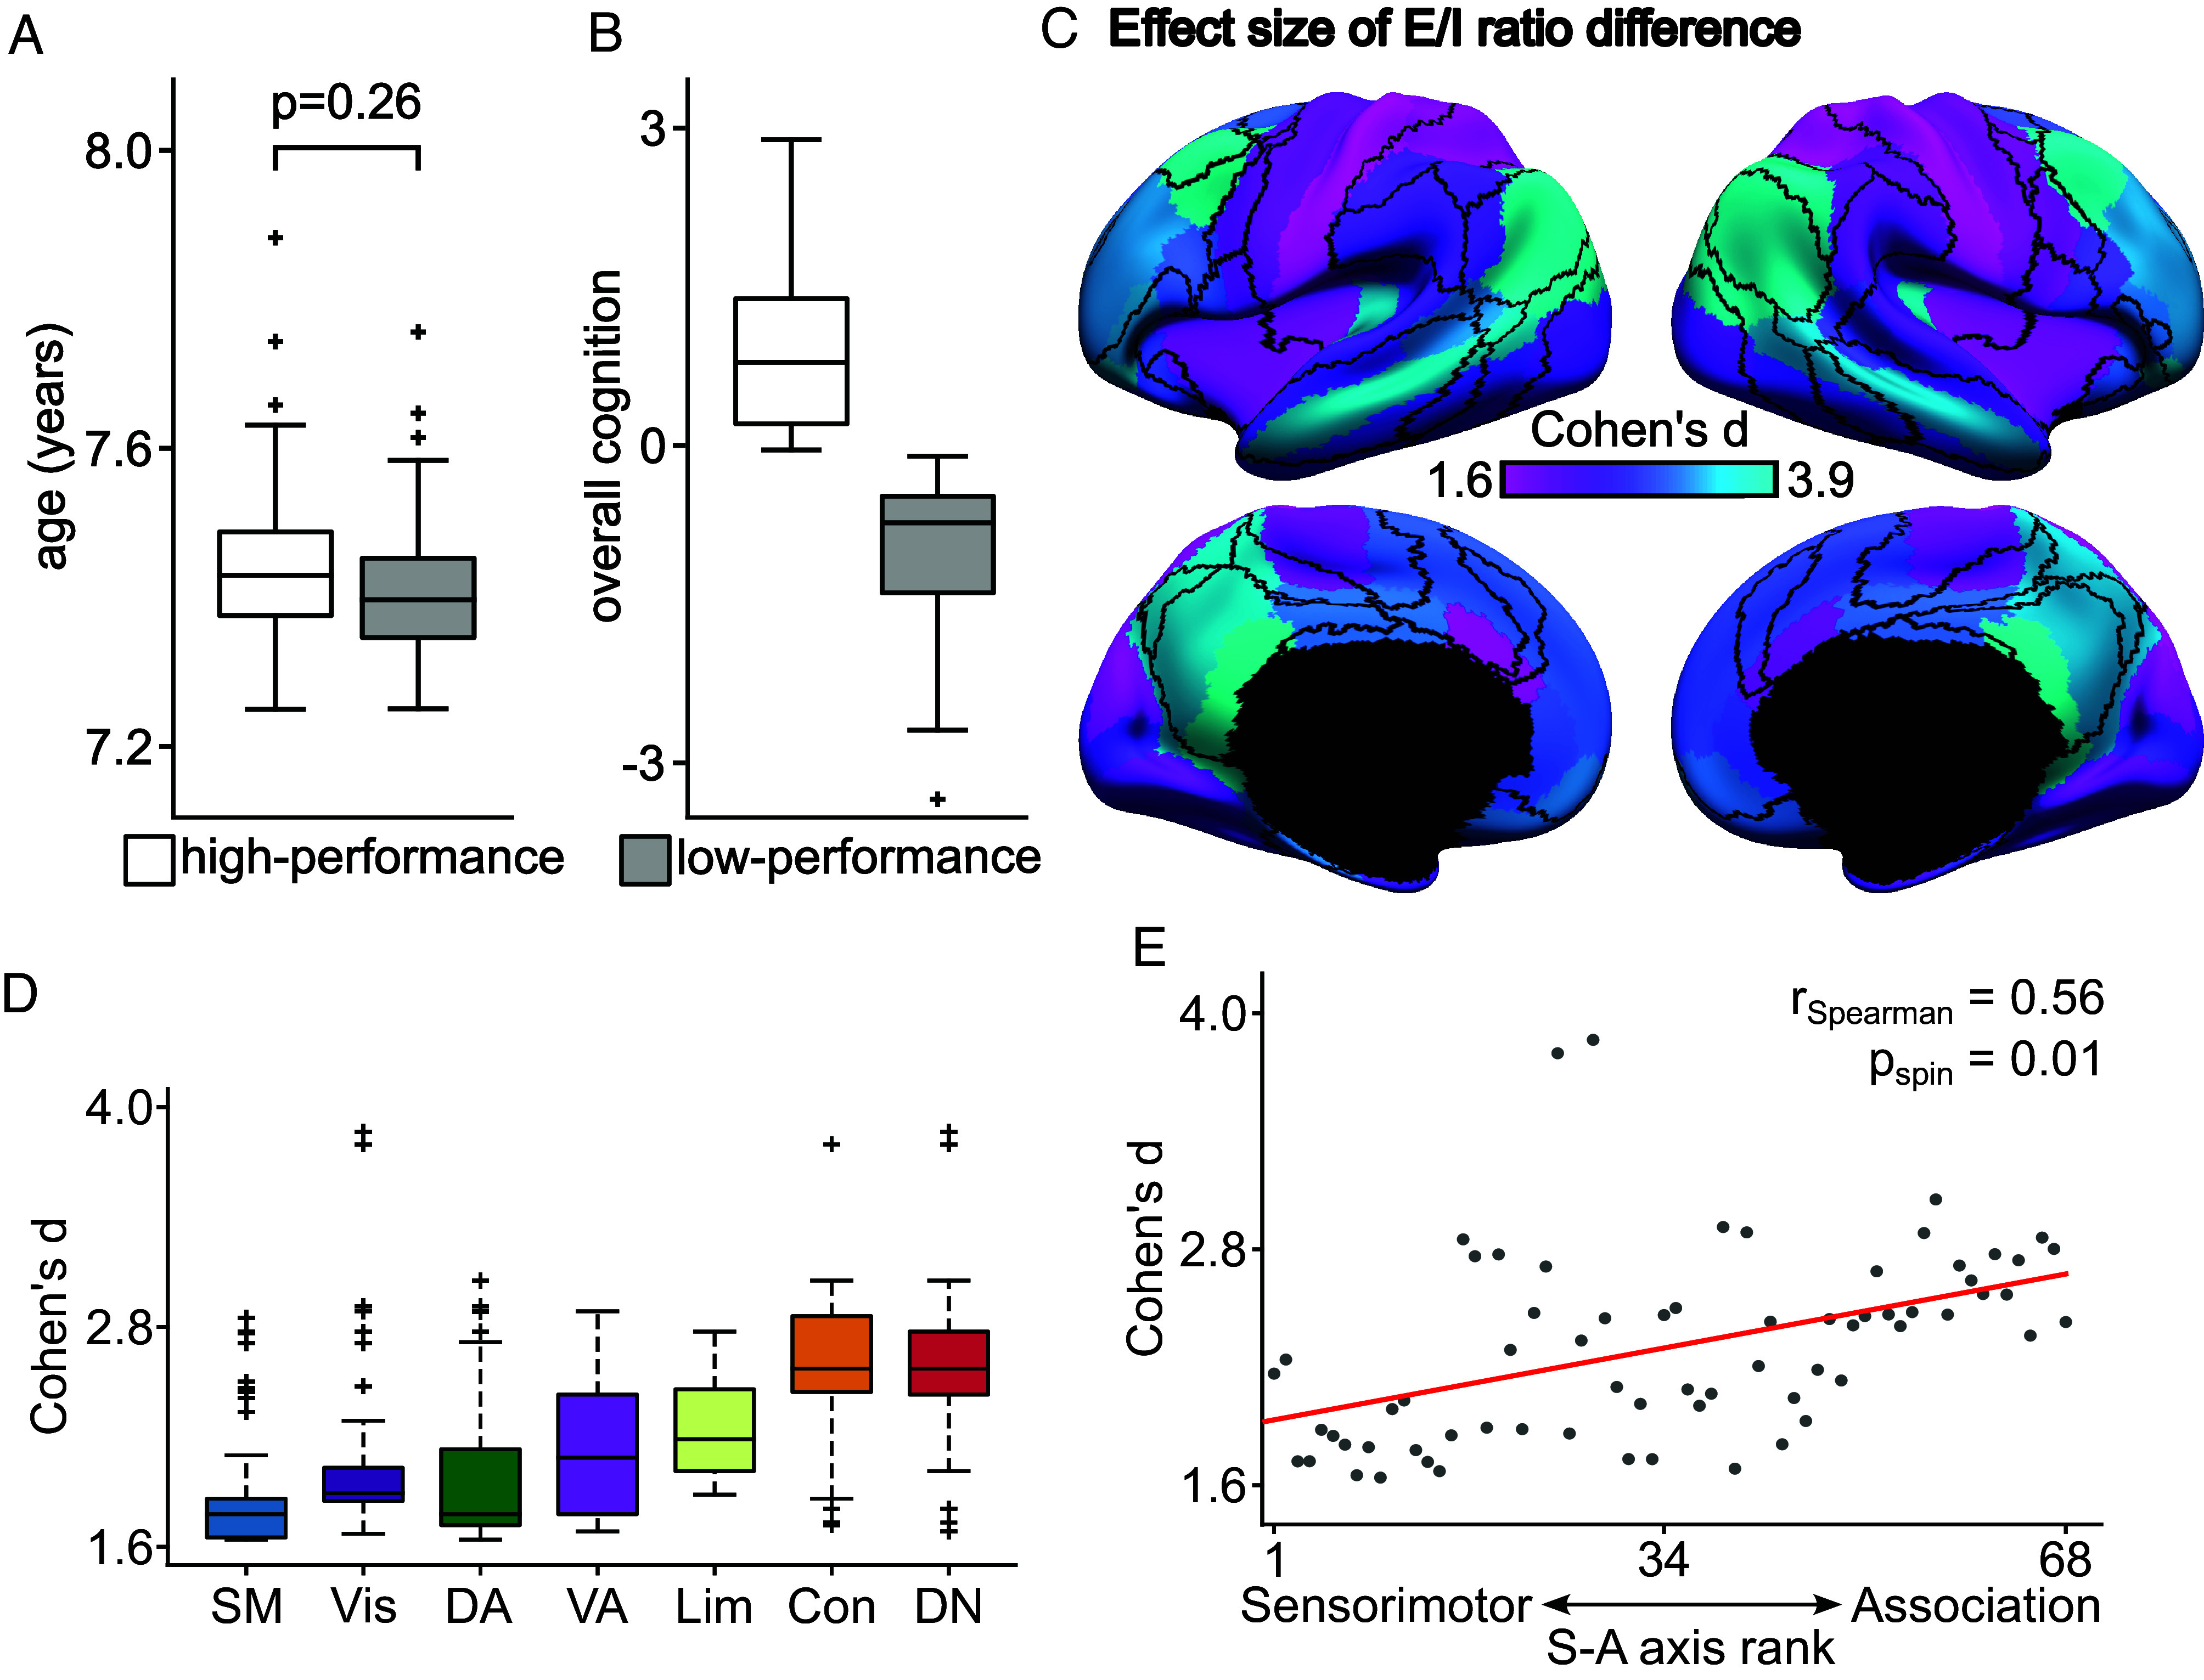
A balanced excitation-inhibition ratio (E/I ratio) is critical for healthy brain function. Normative development of cortex-wide E/I ratio remains unknown. Here, we noninvasively estimate a putative marker of whole-cortex E/I ratio by fitting a large-scale biophysically plausible circuit model to resting-state functional MRI (fMRI) data. We first confirm that our model generates realistic brain dynamics in the Human Connectome Project. Next, we show that the estimated E/I ratio marker is sensitive to the gamma-aminobutyric acid (GABA) agonist benzodiazepine alprazolam during fMRI. Alprazolam-induced E/I changes are spatially consistent with positron emission tomography measurement of benzodiazepine receptor density. We then investigate the relationship between the E/I ratio marker and neurodevelopment. We find that the E/I ratio marker declines heterogeneously across the cerebral cortex during youth, with the greatest reduction occurring in sensorimotor systems relative to association systems. Importantly, among children with the same chronological age, a lower E/I ratio marker (especially in the association cortex) is linked to better cognitive performance. This result is replicated across North American (8.2 to 23.0 y old) and Asian (7.2 to 7.9 y old) cohorts, suggesting that a more mature E/I ratio indexes improved cognition during normative development. Overall, our findings open the door to studying how disrupted E/I trajectories may lead to cognitive dysfunction in psychopathology that emerges during youth.

Keywords: cognition; control network; default mode network; neurodevelopment; resting state functional connectivity.


Conflict of interest statement

Competing interests statement:The authors declare no competing interest.

Figures

Fig. 1.
Fig. 1.
Workflow and schematic of the pFIC model. (A) Young adults from the HCP were used to evaluate the optimization of the spatially heterogeneous pFIC model. Pharmacological fMRI with benzodiazepine alprazolam was then used to evaluate the biological plausibility of the estimated E/I ratio. Next, the pFIC model was used to investigate the development of cortex-wide E/I ratio and its association with cognitive ability in the PNC dataset. Cognitive associations were replicated in a sample of 7-y-olds from the GUSTO cohort. HCP logo is used with permission from the HCP team. (B) The FIC model (33) is a neural mass model obtained by mean field reduction of spiking neuronal network models. The FIC model consists of differential equations at each cortical region governing the neural dynamics of excitatory and inhibitory neuronal populations (“E” and “I” respectively in the Right panel). A red triangle indicates an excitatory connection. A blue circle indicates an inhibitory connection. “wxy” indicates the connection strength from neuronal population x to neuronal population y. For example, “wIE” indicates the connection strength from the inhibitory population to the excitatory population. The regional models are connected by excitatory connections parameterized by a SC matrix. For a given set of model parameters, time courses of excitatory (SE) and inhibitory (SI) synaptic gating variables (representing the fraction of open channels) can be simulated. The E/I ratio was defined as the ratio between the temporal average of SE and SI. Local synaptic parameters were estimated using the same approach as our previous study (41). We refer to the resulting model as the pFIC model.
Fig. 2.
Fig. 2.
The pFIC model generates more realistic fMRI dynamics than the spatially homogeneous FIC model. (A) The CMA-ES algorithm (41, 56) was applied to the HCP training set to generate 500 sets of model parameters. The top 10 parameter sets from the validation set were evaluated in the test set. (B) Agreement (Pearson’s correlation) between empirical and simulated static FC in the HCP test set. (C) Empirical FCD from an HCP test participant. (D) Simulated FCD from the pFIC model using the best model parameters (from the validation set) and SC from the test set. (E) Total test cost of the pFIC model compared with three control conditions: 1) local synaptic parameters parameterized by only principal resting-state FC gradient, 2) local synaptic parameters parametrized by only T1w/T2w ratio map and 3) local synaptic parameters constrained to be spatially uniform. The boxes show the interquartile range (IQR) and the median. Whiskers indicate 1.5 IQR. Black crosses represent outliers. * indicates that the pFIC model achieved statistically better (lower) test cost.
Fig. 3.
Fig. 3.
E/I ratio estimate is sensitive to the effect of benzodiazepine alprazolam. (A) Seven resting-state networks (62). (B) Left: Regional E/I ratio contrast overlaid with the boundaries (black) of seven resting-state networks. Sixty-seven out of 68 regions showed significant E/I ratio difference between placebo and drug sessions after FDR correction (q < 0.05). E/I ratio difference was greater than zero for all regions, consistent with lower E/I ratio during the alprazolam session. Right: E/I ratio differences exhibited a spatial gradient with higher differences in sensory-motor regions compared with regions in the control and default networks. The boxes show the interquartile range (IQR) and the median. Whiskers indicate 1.5 IQR. Black crosses represent outliers. (C) Spatial distribution of BZR density (pmol/mL) from in vivo positron emission tomography in a separate group of participants (63). (D) Higher regional BZR density was associated with larger E/I ratio changes during the drug session (r = 0.52, two-tail spin test P = 0.016).
Fig. 4.
Fig. 4.
E/I ratio continuously declines throughout child and adolescent development. (A) Age distribution of 885 PNC participants (mean = 15.66, SD = 3.36, min = 8.17, max = 23). (B) Participants in older age groups exhibited lower E/I ratio (r = −0.51, P = 0.004). Participants were divided into 29 nonoverlapping age groups. There are 29 dots in the scatter plot, corresponding to the 29 age groups. The shaded area depicts 95% CI of the linear relationship. (C) Spatial distribution of linear regression slope between regional E/I ratio and age. The values represent the rate of E/I ratio changes during development. All slopes were negative and significant (FDR q < 0.05). (D) The slopes exhibited a spatial gradient with sensory-motor networks showing the fastest E/I ratio reduction and association networks showing slower E/I ratio reduction. The boxes show the interquartile range (IQR) and the median. Whiskers indicate 1.5 IQR. Black crosses represent outliers.
Fig. 5.
Fig. 5.
Lower E/I ratio is associated with better cognitive performance within the same age group in the PNC dataset. (A) Boxplots of age, (B) “overall accuracy,” and (C) mean cortical E/I ratio of high-performance and low-performance (overall accuracy) groups. The mean cortical E/I ratio of the high-performance group was significantly lower than that of the low-performance group (FDR q < 0.05). (D) Spatial distribution of effect size of regional E/I ratio difference between high-performance and low-performance groups. All regions were significant after FDR correction with q < 0.05. (E) Effect size of E/I ratio differences in cognition is larger in control and default networks compared with sensorymotor regions. The boxes show the interquartile range (IQR) and the median. Whiskers indicate 1.5 IQR. Black crosses represent outliers. (F) ROI rankings based on the S-A axis (66). Lower ranks were assigned to ROIs that were more toward the sensorimotor pole; higher ranks were assigned to ROIs that were more toward the association pole. (G) Agreement between effect size of E/I ratio difference and S-A axis rank. Spearman’s correlation r = 0.87, two-tailed spin test p < 0.001.
Fig. 6.
Fig. 6.
Lower E/I ratio is associated with better cognitive performance within the same age group in the GUSTO dataset. (A) Boxplots of age for high-performance and low-performance groups. (B) Overall cognition of high-performance and low-performance groups. (C) Spatial distribution of effect size of E/I ratio difference between low-performance group and high-performance group. (D) Effect size of E/I ratio differences is larger in control and default networks compared with sensory-motor regions. The boxes show the interquartile range (IQR) and the median. Whiskers indicate 1.5 IQR. Black crosses represent outliers. (E) Agreement between effect size of E/I ratio difference and S-A axis rank. Spearman’s correlation r = 0.56, two-tailed spin test P = 0.01.

Update of

Similar articles

Cited by

References

    1. Nelson S., Temporal interactions in the cat visual system. III. Pharmacological studies of cortical suppression suggest a presynaptic mechanism. J. Neurosci. 11, 369–380 (1991). - PMC - PubMed
    1. Atallah B. V., Scanziani M., Instantaneous modulation of gamma oscillation frequency by balancing excitation with inhibition. Neuron 62, 566–577 (2009). - PMC - PubMed
    1. Dorrn A. L., Yuan K., Barker A. J., Schreiner C. E., Froemke R. C., Developmental sensory experience balances cortical excitation and inhibition. Nature 465, 932–936 (2010). - PMC - PubMed
    1. Sun Y. J., et al. , Fine-tuning of pre-balanced excitation and inhibition during auditory cortical development. Nature 465, 927–931 (2010). - PMC - PubMed
    1. Turrigiano G. G., Nelson S. B., Homeostatic plasticity in the developing nervous system. Nat. Rev. Neurosci. 5, 97–107 (2004). - PubMed