. 2024 May 1;24(5):13.
doi: 10.1167/jov.24.5.13.

Confidence ratings do not distinguish imagination from reality

Affiliations

Confidence ratings do not distinguish imagination from reality

Nadine Dijkstra et al. J Vis. .

Abstract

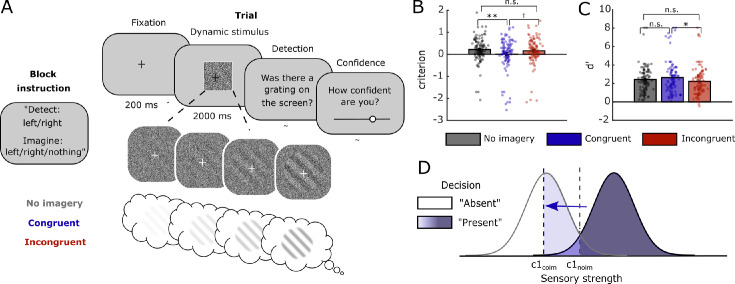
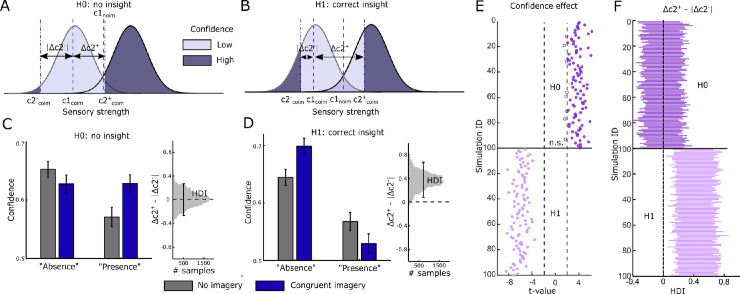
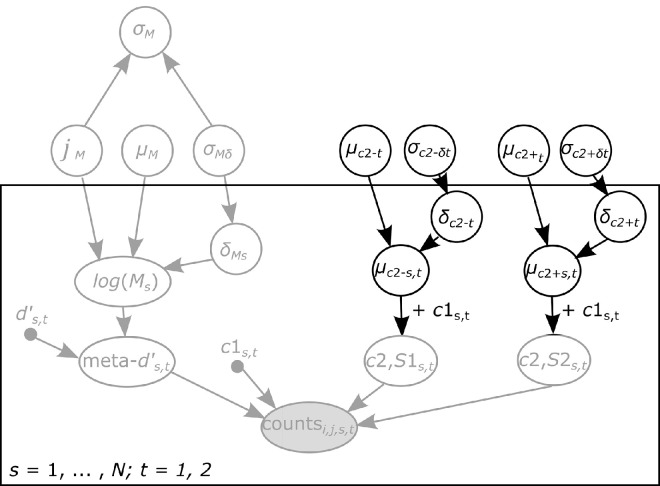
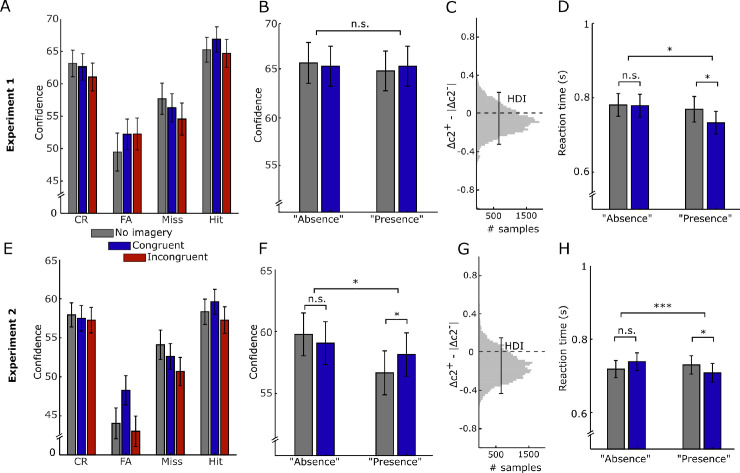
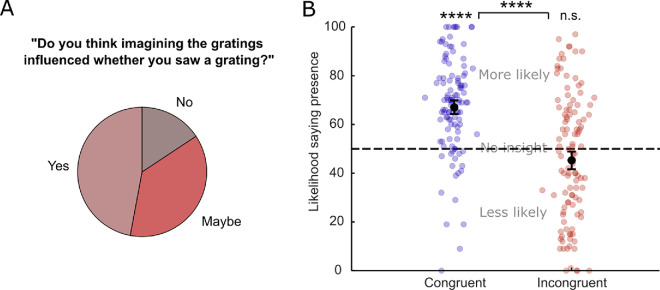
Perceptual reality monitoring refers to the ability to distinguish internally triggered imagination from externally triggered reality. Such monitoring can take place at perceptual or cognitive levels-for example, in lucid dreaming, perceptual experience feels real but is accompanied by a cognitive insight that it is not real. We recently developed a paradigm to reveal perceptual reality monitoring errors during wakefulness in the general population, showing that imagined signals can be erroneously attributed to perception during a perceptual detection task. In the current study, we set out to investigate whether people have insight into perceptual reality monitoring errors by additionally measuring perceptual confidence. We used hierarchical Bayesian modeling of confidence criteria to characterize metacognitive insight into the effects of imagery on detection. Over two experiments, we found that confidence criteria moved in tandem with the decision criterion shift, indicating a failure of reality monitoring not only at a perceptual but also at a metacognitive level. These results further show that such failures have a perceptual rather than a decisional origin. Interestingly, offline queries at the end of the experiment revealed global, task-level insight, which was uncorrelated with local, trial-level insight as measured with confidence ratings. Taken together, our results demonstrate that confidence ratings do not distinguish imagination from reality during perceptual detection. Future research should further explore the different cognitive dimensions of insight into reality judgments and how they are related.


Figures

Figure 1.
Figure 1.
Experimental design, decision-level responses, and model. (A) Participants were instructed to detect oriented gratings in noise while simultaneously imagining the same grating (congruent), a grating perpendicular to the to-be-detected stimulus (incongruent), or nothing (no imagery). After each trial, participants indicated whether a stimulus had been presented on the screen and after that indicated the confidence in their answer from “complete guess” to “absolutely certain” by moving a slider with their mouse. (B) Decision criterion was significantly lower during congruent imagery compared to no-imagery and marginally lower during congruent imagery compared to incongruent imagery. There was no significant difference in criterion between incongruent imagery and no imagery. (C) In contrast, there was no effect of d′ during congruent imagery, but there was a significant decrease in d′ during incongruent imagery. (D) Signal detection theory (SDT) model of (congruent) imagery increasing perceptual presence responses by decreasing the decision-level criterion. Within SDT, a decrease in criterion is equivalent to an increase in the mean sensory strength of both the noise and signal distributions. c1noim = first-order criterion during no imagery; c1coim = first-order criterion during congruent imagery. *p < 0.05; **p < 0.005; †p < 0.06; n.s., p > 0.1.
Figure 2.
Figure 2.
Modeling insight into perceptual reality monitoring. (A) Illustration of shift in confidence criteria compared to first-order criterion. If participants have no insight into their first-order criterion shift, we would expect confidence criteria to move with the decision-level criterion shift. coim = congruent imagery; c1 = first-order criterion; c2 = negative second-order (metacognitive) criterion; c2+ = positive second-order criterion; Δc2+/− = c2 relative to c1 (i.e., c2–c1). (B) In contrast, if participants have insight into the fact that imagery increases perceptual presence, their confidence criteria would remain closer to the no-imagery criterion. (C) Simulated confidence ratings under a no-insight model. Left: compared to no imagery, imagery leads to lower confidence in absence responses and higher confidence in presence responses. Right: asymmetry between positive and negative confidence criteria, relative to the position of the first-order criterion (Δc2+ – |Δc2–|). The black line indicates the HDI representing the 95% most credible values of the posterior. The HDI is centered around 0, indicating symmetrical positive and negative Δc2 values and therefore a symmetrical shift in confidence criteria relative to the Type 1 criterion effect. (D) Simulated confidence ratings under a full-insight model. Left: imagery leads to higher confidence in absence responses and lower confidence in presence responses. Right: there is a positive asymmetry between positive and negative Δc2 values, indicating that confidence criteria stay closer to what would be expected under no imagery, in line with insight into the effect of imagery on perception. (E) The confidence effect, operationalized as the interaction between condition and response on confidence ratings, for repeated independent simulations under no insight (H0; top, dark purple) and full insight (H1; bottom, light purple), with other parameter values drawn from distributions consistent with the empirical data. Positive t-values reflect a decrease in confidence for absence and an increase for presence for imagery versus no imagery, whereas negative t-values reflect the opposite. Filled circles have a p value <0.05 (uncorrected). (F) HDIs of the asymmetry between positive and negative confidence criteria for repeated simulations under both the no-insight model (H0; top, dark purple) and the full-insight model (H1; bottom, light purple).
Figure 3.
Figure 3.
Current extension of the HMeta-d′ model. Probabilistic graphical model for estimating metacognitive insight into criterion shifts. A full description of the original HMeta-d′ model, here indicated in light gray, can be found in Fleming (2017). In short, the model aims to estimate trial counts (counts) per confidence rating bin conditional on both the stimulus category (S1, i.e., presence and S2, i.e., absence) and the response (S1, i.e., “present” and S2, i.e., “absent”). Given a particular setting of the parameters, the model specifies a multinomial probability distribution P(conf = y |stim = i,  resp = j) over observed confidence response counts. We extended the model to include group-level priors (mean and variance) over the difference between decision c1 and confidence c2 criteria, separately for negative (absence) c2– (µc2-t and σc2-t) and positive (presence) c2+ (µc2+t and σc2+t) responses. Group-level variance is translated into subject-specific precision δc2 − t and δc2 + t. Point estimates for type 1 d′ and criterion are represented as black dots. All parameters in unfilled circles are free parameters estimated by the model. The box encloses participant-level parameters subscripted with s, whereas parameters outside the box represent group-level parameters. Condition specific (no-imagery vs. imagery) parameters are subscripted with t. We employ the scheme suggested by Matzke et al. (2014), such that the mean and variance of log(Ms) are scaled by a redundant multiplicative parameter ξM. The posterior on σM can then be recovered by adjusting for the influence of this additional random component.
Figure 4.
Figure 4.
Metacognitive insight during source mixing. (A) Confidence ratings per condition and trial type for Experiment 1 (CR = correct rejection; FA = false alarm). Only data for participants with all trial types in all conditions are shown (N = 59). (B) Confidence ratings per response category for no-imagery and congruent imagery conditions, as in Figures 2C, 2D, included data from all participants. (C) Asymmetry between positive and negative confidence criteria, relative to the position of the first-order criterion. Positive values indicate more insight (cf. Figures 2C, 2D). (D) Reaction times per response for no-imagery and congruent imagery conditions. (EH) Same as AD for Experiment 2. *p < 0.05; ***p < 0.0005.
Figure 5.
Figure 5.
Postexperiment queries indicate insight. (A) Proportion of participants indicating that they thought imagery influenced their perceptual response after Experiment 1. N = 51. (B) Responses to the question whether imagery made participants more or less likely to indicate perceptual presence, separate for congruent (blue) and incongruent (red) conditions, after Experiment 2. Dots represent individual participants. ****p < 0.0001; n.s. = non-significant.

Similar articles

Cited by

References

    1. Albers, A. M., Kok, P., Toni, I., Dijkerman, H. C., & De Lange, F. P. (2013). Shared representations for working memory and mental imagery in early visual cortex. Current Biology: CB, 23(15), 1427–1431, 10.1016/j.cub.2013.05.065. - DOI - PubMed
    1. Baird, B., Mota-Rolim, S. A., & Dresler, M. (2019). The cognitive neuroscience of lucid dreaming. Neuroscience and Biobehavioral Reviews, 100, 305–323, 10.1016/j.neubiorev.2019.03.008. - DOI - PMC - PubMed
    1. Bhome, R., McWilliams, A., Huntley, J. D., Fleming, S. M., & Howard, R. J. (2019). Metacognition in functional cognitive disorder—a potential mechanism and treatment target. Cognitive Neuropsychiatry, 24(5), 311–321, 10.1080/13546805.2019.1651708. - DOI - PubMed
    1. Bhome, R., McWilliams, A., Price, G., Poole, N. A., Howard, R. J., Fleming, S. M., ... Huntley, J. D. (2022). Metacognition in functional cognitive disorder. Brain Communications, 4(2), 10.1093/braincomms/fcac041. - DOI - PMC - PubMed
    1. Boundy-Singer, Z. M., Ziemba, C. M., & Goris, R. L. T. (2022). Confidence reflects a noisy decision reliability estimate. Nature Human Behaviour, 7, 142–154, 10.1038/s41562-022-01464-x. - DOI - PubMed