. 2024 May 30;19(5):e0302977.
doi: 10.1371/journal.pone.0302977. eCollection 2024.

Metabolic profiling during COVID-19 infection in humans: Identification of potential biomarkers for occurrence, severity and outcomes using machine learning

Affiliations

Metabolic profiling during COVID-19 infection in humans: Identification of potential biomarkers for occurrence, severity and outcomes using machine learning

Gamalat A Elgedawy et al. PLoS One. .

Abstract

Background: After its emergence in China, the coronavirus SARS-CoV-2 has swept the world, leading to global health crises with millions of deaths. COVID-19 clinical manifestations differ in severity, ranging from mild symptoms to severe disease. Although perturbation of metabolism has been reported as a part of the host response to COVID-19 infection, scarce data exist that describe stage-specific changes in host metabolites during the infection and how this could stratify patients based on severity.

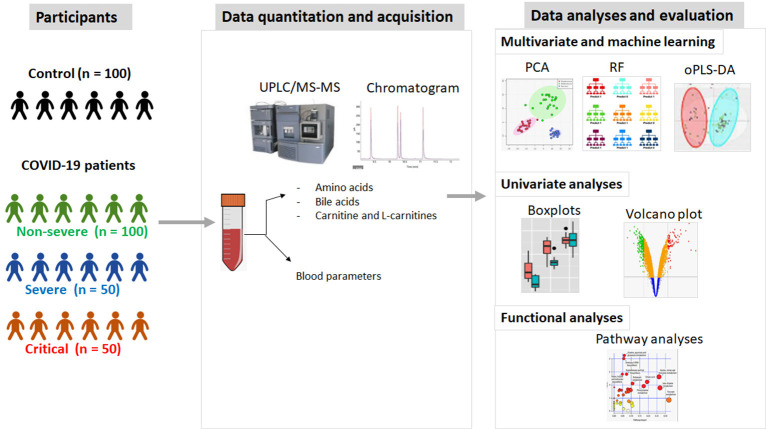
Methods: Given this knowledge gap, we performed targeted metabolomics profiling and then used machine learning models and biostatistics to characterize the alteration patterns of 50 metabolites and 17 blood parameters measured in a cohort of 295 human subjects. They were categorized into healthy controls, non-severe, severe and critical groups with their outcomes. Subject's demographic and clinical data were also used in the analyses to provide more robust predictive models.

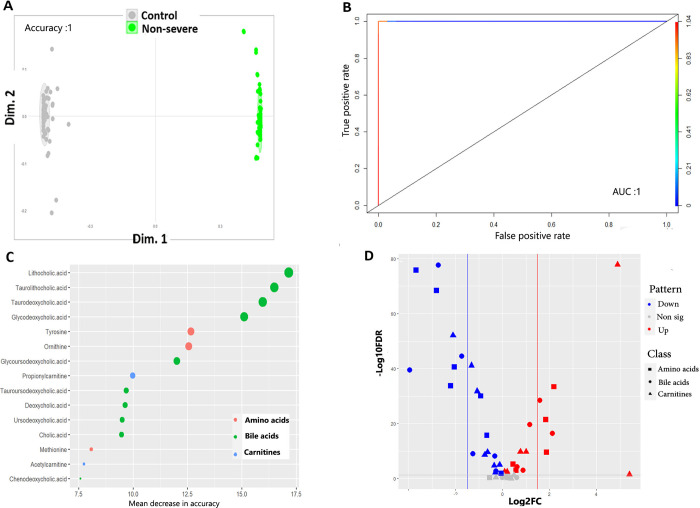
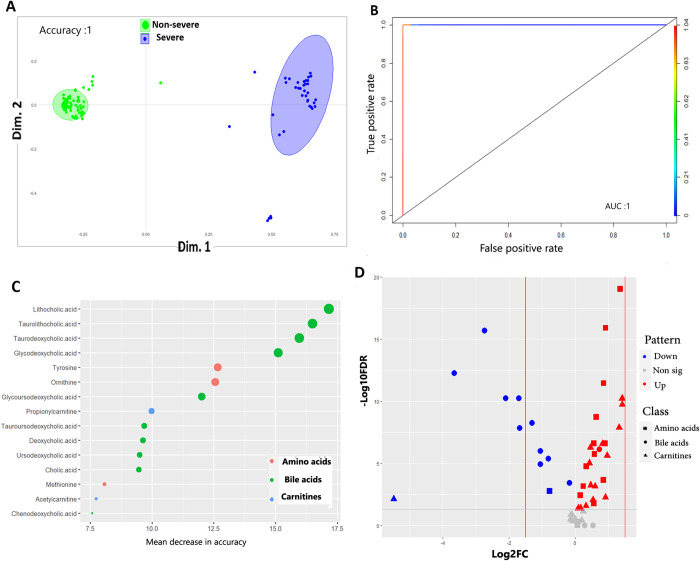
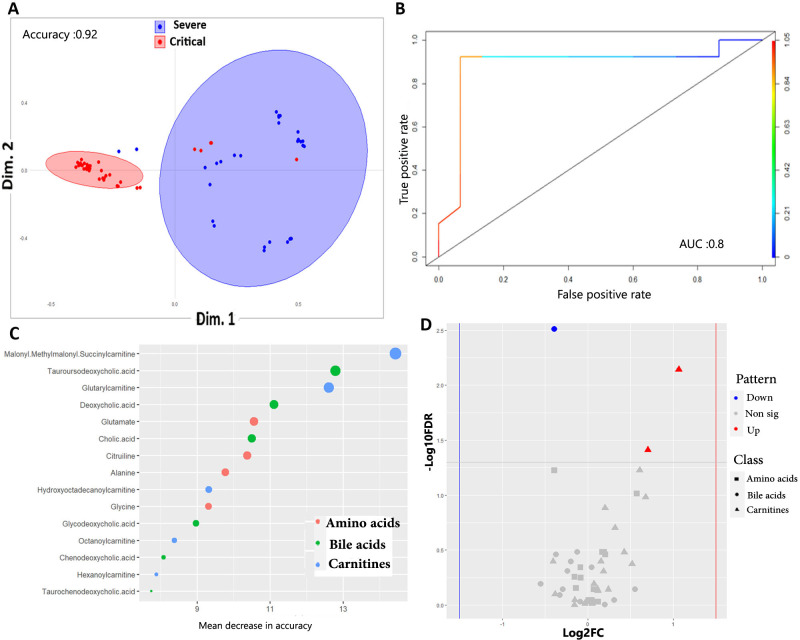
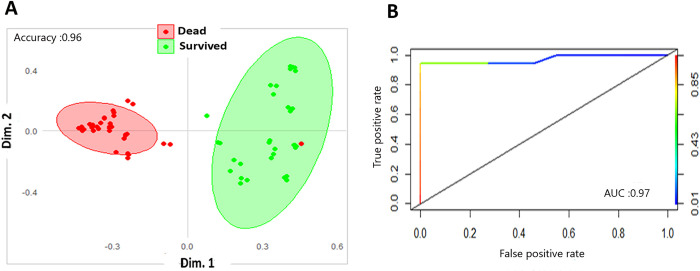
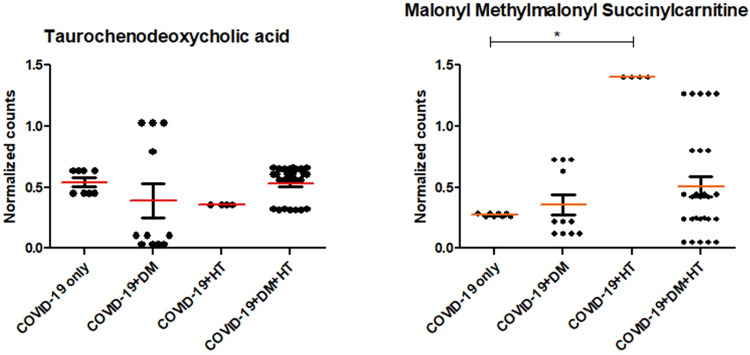
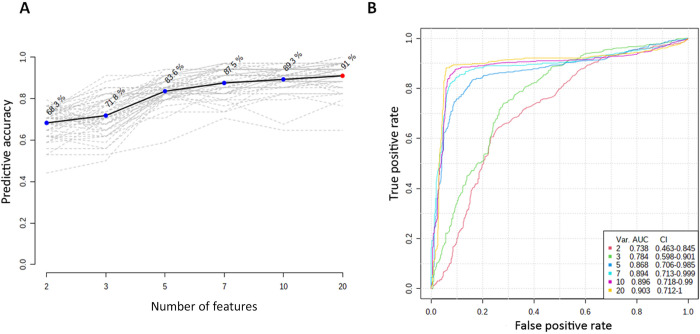
Results: The non-severe and severe COVID-19 patients experienced the strongest changes in metabolite repertoire, whereas less intense changes occur during the critical phase. Panels of 15, 14, 2 and 2 key metabolites were identified as predictors for non-severe, severe, critical and dead patients, respectively. Specifically, arginine and malonyl methylmalonyl succinylcarnitine were significant biomarkers for the onset of COVID-19 infection and tauroursodeoxycholic acid were potential biomarkers for disease progression. Measuring blood parameters enhanced the predictive power of metabolic signatures during critical illness.

Conclusions: Metabolomic signatures are distinctive for each stage of COVID-19 infection. This has great translation potential as it opens new therapeutic and diagnostic prospective based on key metabolites.


Conflict of interest statement

The authors have declared that no competing interests exist.

Figures

Fig 1
Fig 1. Schematic diagram showing the overall design of the study.
The general steps were subject selection and stratification, data quantification, acquisition, data analyses, and model evaluation.
Fig 2
Fig 2. Machine learning models and univariate analyses discriminating HC from non-severe COVID-19 patients.
A. Proximity plot of the RF model discriminating controls from non-sever COVID-19 patients. The ellipse shows confidence intervals B. ROC analyses showing the prediction ability of the model. AUC: Area under the curve. C. Top 15 metabolites that are important predictors for non-severe COVID-19 patients as revealed by RF model. The metabolites are color-grouped by their class and are ranked descending by their mean decrease in accuracy (the higher the mean decrease in accuracy the more important the metabolite). D. Volcano plot showing the results of the univariate analyses. The figure depicts the relationship between log2FC value of each metabolite (x-axis) against its -log10FDR (y-axis). Red and blue dots refer to metabolites that are significantly up and down regulated, respectively. Non-significant DE metabolites are shown as grey dots (-log10 adj. p value <1.3). The metabolite class are shape coded. The dashed horizontal line refers to the value of 1.3, the -log10 for a 0.05 FDR. The vertical dashed lines refer to the cutoff that equates a log2fold change value of |1.5|.
Fig 3
Fig 3. Machine learning models and univariate analyses discriminating non-severe and severe COVID-19 patients.
A. Proximity plot of the RF model discriminating non-sever from severe COVID-19 patients. The ellipse shows confidence intervals B. ROC analyses showing the prediction ability of the model. AUC: Area under the curve. C. Top 15 metabolites that are important predictors for severe COVID-19 patients as revealed by RF model. The metabolites are color-grouped by their class and are ranked descending by their mean decrease in accuracy (the higher the mean decrease in accuracy the more important the metabolite). D. Volcano plot showing the results of the univariate analyses. The figure depicts the relationship between log2FC value of each metabolite (x-axis) against its -log10FDR (y-axis). Red and blue dots refer to metabolites that are significantly up and down regulated, respectively. Non-significant DE metabolites are shown as grey dots (-log10 adj. p value <1.3). The metabolite class is shape coded. The dashed horizontal line refers to the value of 1.3, the -log10 for a 0.05 FDR. The vertical dashed lines refer to the cutoff that equates a log2fold change value of |1.5|.
Fig 4
Fig 4. Machine learning models and univariate analyses discriminating severe and critical COVID-19 patients.
A. Proximity plot of the RF model discriminating sever from critical COVID-19 patients. The ellipse shows confidence intervals B. ROC analyses showing the prediction ability of the model. AUC: Area under the curve. C. Top 15 metabolites that are important predictors for critical COVID-19 patients as revealed by RF model. The metabolites are color-grouped by their class and are ranked descending by their mean decrease in accuracy (the higher the mean decrease in accuracy the more important the metabolite). D. Volcano plot showing the results of the univariate analyses. The figure depicts the relationship between log2FC value of each metabolite (x-axis) against its -log10FDR (y-axis). Red and blue dots refer to metabolites that are significant up and down regulated, respectively. Non-significant DE metabolites are shown as grey dots (-log10 adj. p value <1.3). The metabolite class are shape-coded. The dashed horizontal line refers to the value of 1.3, the -log10 for a 0.05 FDR. The vertical dashed lines refer to the cutoff that equates a log2fold change value of |1.5|.
Fig 5
Fig 5. Random forest classification model predicting the classification of different COVID-19 outcomes.
A. Proximity plot of the RF model discriminating survived from dead COVID-19 patients. The ellipse shows confidence intervals and each dot refers to one patient. B. ROC analyses showing the prediction ability of the RF model. AUC: Area under the curve.
Fig 6
Fig 6. Differences in levels of key metabolites in patients with only critical COVID-19 infection and those with the infection with critical COVID-19 superimposed with other comorbidities.
DM: Diabetes, HT: Hypertension.
Fig 7
Fig 7. Support vector machine models built using important metabolites in panel 3 (those that best discriminate severe from critical covid-19 cases) together with normalized counts of 17 blood indices.
A. Various predictive accuracies as determined by support vector machine models using feature combination (from 2–20). B. ROC curves showing the predictive ability of different support vector machine models of feature combination. Var. refers to different combination. AUC: Area under the curve. CI: Confidence intervals.

Similar articles

Cited by

References

    1. Medicine, J.H.U. Coronavirus Resource Center: COVID-19 Map. 2022 [cited 2022; Available from: https://coronavirus.jhu.edu/map.html
    1. (WHO), W.H.O. WHO Director-General’s Opening Remarks at the Media Briefing on COVID-19–3 March 2020. 2020 [cited 2020 3.03.2020]; Available from: www.who.int/dg/speeches/detail/who-director-general-s-openingremarks-at-....
    1. (WHO), W.H.O., WHO Coronavirus (COVID-19) Dashboard. https://covid19.who.int/, 2023.
    1. Zhang X., et al.., Viral and host factors related to the clinical outcome of COVID-19. Nature, 2020. 583(7816): p. 437–440. doi: 10.1038/s41586-020-2355-0 - DOI - PubMed
    1. Sanyaolu A., et al.., Comorbidity and its Impact on Patients with COVID-19. SN Compr Clin Med, 2020. 2(8): p. 1069–1076. doi: 10.1007/s42399-020-00363-4 - DOI - PMC - PubMed