. 2024 May 30;22(5):e3002622.
doi: 10.1371/journal.pbio.3002622. eCollection 2024 May.

Negation mitigates rather than inverts the neural representations of adjectives

Affiliations

Negation mitigates rather than inverts the neural representations of adjectives

Arianna Zuanazzi et al. PLoS Biol. .

Abstract

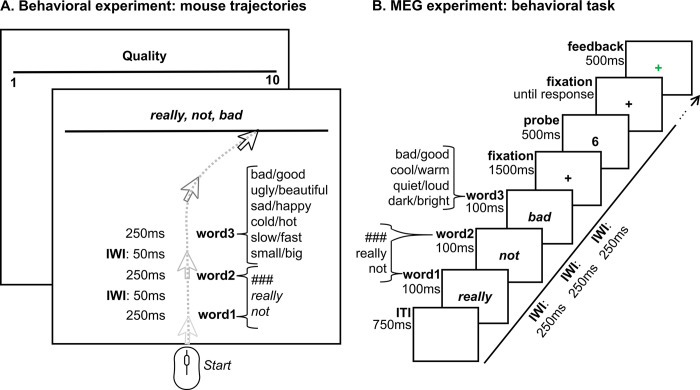
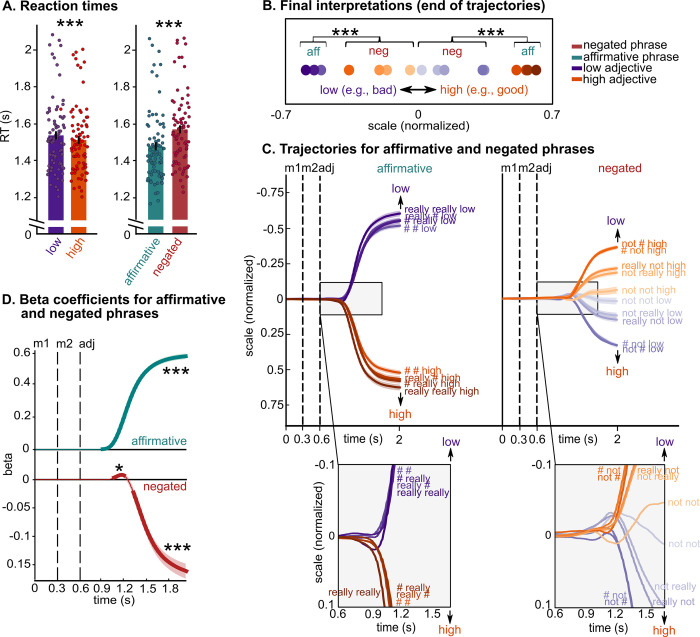
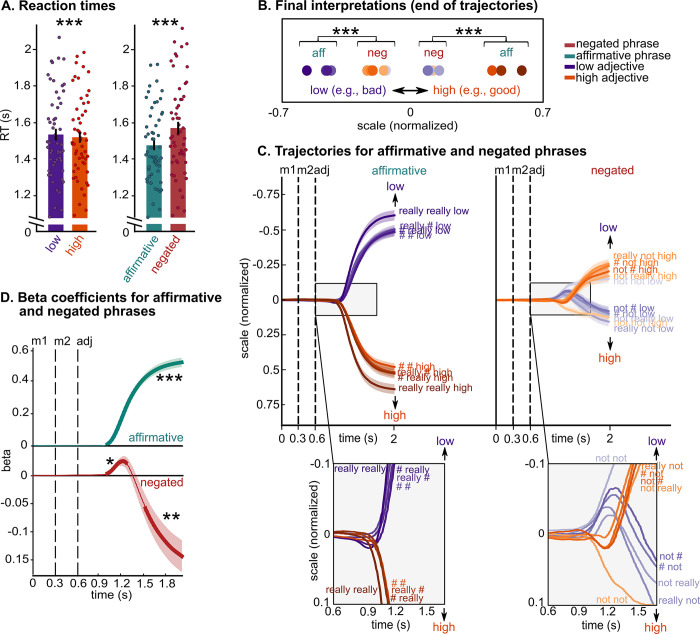
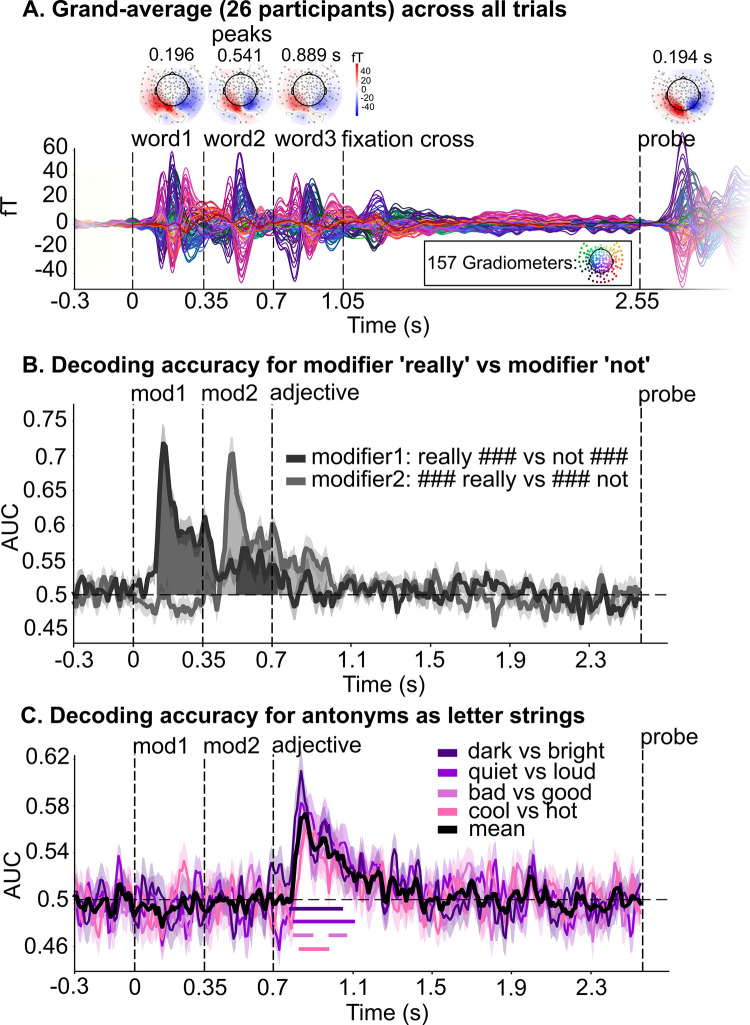
Combinatoric linguistic operations underpin human language processes, but how meaning is composed and refined in the mind of the reader is not well understood. We address this puzzle by exploiting the ubiquitous function of negation. We track the online effects of negation ("not") and intensifiers ("really") on the representation of scalar adjectives (e.g., "good") in parametrically designed behavioral and neurophysiological (MEG) experiments. The behavioral data show that participants first interpret negated adjectives as affirmative and later modify their interpretation towards, but never exactly as, the opposite meaning. Decoding analyses of neural activity further reveal significant above chance decoding accuracy for negated adjectives within 600 ms from adjective onset, suggesting that negation does not invert the representation of adjectives (i.e., "not bad" represented as "good"); furthermore, decoding accuracy for negated adjectives is found to be significantly lower than that for affirmative adjectives. Overall, these results suggest that negation mitigates rather than inverts the neural representations of adjectives. This putative suppression mechanism of negation is supported by increased synchronization of beta-band neural activity in sensorimotor areas. The analysis of negation provides a steppingstone to understand how the human brain represents changes of meaning over time.


Conflict of interest statement

The authors have declared that no competing interests exist.

Figures

Fig 1
Fig 1. Experimental procedures.
(A) Behavioral procedure. Participants read affirmative or negated adjective phrases (e.g., “really really good,” “### not bad”) word by word and rated the overall meaning of each phrase on a scale. Each trial consisted of combinations of “###,” “really,” and “not” in word positions 1 and 2, followed by an adjective representing the low or high pole across 6 possible scalar dimensions. Before each trial, participants were informed about the scale direction, e.g., “bad” to “good,” i.e., 1 to 10. Scale direction was pseudorandomized across blocks. Feedback was provided at the end of each trial (to which 1 and 0 was assigned to compute the average feedback score). For each trial, we collected continuous mouse trajectories throughout the entire trial as well as reaction times. (B) MEG procedure. Participants read affirmative or negated adjective phrases and were instructed to derive the overall meaning of each adjective phrase on a scale from 0 to 8, e.g., from “really really bad” to “really really good.” After each phrase, a probe (e.g., 6) was presented, and participants were required to indicate whether the probe number represented the overall meaning of the phrase on the scale (yes/no answer, using a keypad). Feedback was provided at the end of each trial (green or red cross, to which 1 and 0 was assigned to compute the average feedback score). While performing the task, participants lay supine in a magnetically shielded room while continuous MEG data were recorded through a 157-channel whole-head axial gradiometer system. (A and B) “###” = no modifier; IWI = inter-word-interval.
Fig 2
Fig 2. Behavioral results.
(A) Reaction times results for the online behavioral study (N = 78). Bars represent the participants’ mean ± SEM, and dots represent individual participants. Participants were faster for high adjectives (e.g., “good”) than for low adjectives (e.g., “bad”) and for affirmative phrases (e.g., “really really good”) than for negated phrases (e.g., “really not good”). The results support previous behavioral data showing that negation is associated with increased processing difficulty. (B) Final interpretations (i.e., end of trajectories) of each phrase, represented by filled circles (purple = low, orange = high), averaged across adjective dimensions and participants, showing that negation never inverts the interpretation of adjectives to that of their antonyms. (C) Mouse trajectories for low (purple) and high (orange) antonyms, for each modifier (shades of orange and purple) and for affirmative (left panel) and negated (right panel) phrases. Zoomed-in panels at the bottom demonstrate that mouse trajectories of affirmative phrases branch towards the adjective’s side of the scale and remain on that side until the final interpretation; in contrast, the trajectories of negated phrases first deviate towards the side of the adjective and subsequently towards the side of the antonym. This result is confirmed by linear models fitted to the data at each time point in D. (D) Beta values (average over 78 participants) over time, separately for affirmative and negated phrases. Thicker lines indicate significant time windows. (C, D) Black vertical dashed lines indicate the presentation onset of each word: modifier 1, modifier 2 and adjective; each line and shading represent participants’ mean ± SEM. (A, B, D) *** p < 0.001; * p < 0.05. Data are available on the Open Science Framework https://doi.org/10.17605/OSF.IO/5YS6B.
Fig 3
Fig 3. Replication of Experiment 1, without feedback on interpretation.
(A) Reaction times results for the online behavioral study (N = 55). Bars represent the participants’ mean ± SEM, and dots represent individual participants. Participants were faster for high adjectives (e.g., “good”) than for low adjectives (e.g., “bad”) and for affirmative phrases (e.g., “really really good”) than for negated phrases (e.g., “really not good”). These results replicate Experiment 1. (B) Final interpretations (i.e., end of trajectories) of each phrase, represented by filled circles (purple = low, orange = high), averaged across adjective dimensions and participants, showing that negation never inverts the interpretation of adjectives to that of their antonyms. (C) Mouse trajectories for low (purple) and high (orange) antonyms, for each modifier (shades of orange and purple) and for affirmative (left panel) and negated (right panel) phrases. Zoomed-in panels at the bottom demonstrate that mouse trajectories of affirmative phrases branch towards the adjective’s side of the scale and remain on that side until the final interpretation; in contrast, the trajectories of negated phrases first deviate towards the side of the adjective and subsequently towards the side of the antonym (except for “not not”). This result is confirmed by linear models fitted to the data at each time point in D. These results also replicate Experiment 1. (D) Beta values (average over 55 participants) over time, separately for affirmative and negated phrases. Thicker lines indicate significant time windows. Trials with “not not” were not included in this analysis as the trajectories pattern was different compared to the other conditions with negation. (C, D) Black vertical dashed lines indicate the presentation onset of each word: modifier 1, modifier 2 and adjective; each line and shading represent participants’ mean ± SEM. (A, B, D) *** p < 0.001; ** p < 0.01; * p < 0.05. Data are available on the Open Science Framework https://doi.org/10.17605/OSF.IO/5YS6B.
Fig 4
Fig 4. Evoked activity and temporal decoding of modifiers and adjectives as letter strings.
(A) The butterfly (bottom) and topo plots (top) illustrate the event-related fields elicited by the presentation of each word as well as the probe, with a primarily visual distribution of neural activity right after visual onset (i.e., letter string processing). We performed multivariate decoding analyses on these preprocessed MEG data, after performing linear dimensionality reduction (see Materials and methods). Detector distribution of MEG system in inset box. fT: femtoTesla magnetic field strength. (B) We estimated the ability of the decoder to discriminate “really” vs. “not” separately in the first and second modifier’s position, from all MEG sensors. We contrasted phrases with modifiers “really ###” and “not ###,” and phrases with modifiers “### not” and “### really.” (C) We evaluated whether the brain encodes representational differences between each pair of antonyms (e.g., “bad” vs. “good”), in each of the 4 dimensions (quality, temperature, loudness, and brightness). The mean across adjective pairs is represented as a solid black line; significant windows are indicated by horizontal solid lines below. (B and C) AUC = area under the receiver operating characteristic curve, chance = 0.5 (black horizontal dashed line); for all panels: black vertical dashed lines indicate the presentation onset of each word: modifier 1, modifier 2, and adjective; each line and shading represent participants’ mean ± SEM. Data are available on the Open Science Framework https://doi.org/10.17605/OSF.IO/5YS6B.
Fig 5
Fig 5. Temporal and spatial decoding of antonyms across all scales and temporal decoding of negation.
(A) Decoding accuracy (purple line) of lexical-semantic differences between antonyms across all scales (i.e., pooling over “bad,” “cool,” “quiet,” and “dark”; and “good,” “warm,” “loud,” and “bright” before fitting the estimators) over time, regardless of modifier; significant time windows are indicated by purple shading. (B) Decoding accuracy (shades of purple) for antonyms across all scales over brain sources (after pooling over the 4 dimensions), between 50 and 650 ms from adjective onset. Significant spatial clusters are indicated by a black contour. (C) Decoding accuracy of negation over time, as a function of the number of modifiers (1 modifier: dark red line and shading; 2 modifiers: light red line and shading). 1 modifier: “really ###,” “### really,” “not ###,” “### not”; 2 modifiers: “really really,” “really not,” “not really,” “not not.” Significant time windows are indicated by dark red (1 modifier) and light red (2 modifiers) shading. For all panels: AUC: area under the receiver operating characteristic curve, chance = 0.5 (black horizontal dashed line); black vertical dashed lines indicate the presentation onset of each word: modifier1, modifier2, and adjective; each line and shading represent participants’ mean ± SEM; aff = affirmative, neg = negated; LH = left hemisphere; RH = right hemisphere. Data are available on the Open Science Framework https://doi.org/10.17605/OSF.IO/5YS6B.
Fig 6
Fig 6. Predictions, decoding approaches, and results of the effect of negation on the representation of adjectives.
(A) We tested 4 possible effects of negation on the representation of adjectives: (1) No effect; (2) Mitigation; (3) Inversion; (4) Change (left column). Note that we depicted predictions of (3) Inversion on the extremes of the scale, but a combination of inversion and mitigation would have the same expected outcomes. We performed 2 sets of decoding analyses (right column): (i) We trained estimators on low (purple) vs. high (orange) antonyms in affirmative phrases and predicted model accuracy and probability estimates of low vs. high antonyms in negated phrases (light and dark red bars). (ii) We trained estimators on low vs. high antonyms in affirmative and negated phrases together and predicted model accuracy and probability estimates in affirmative (light and dark green bars) and negated phrases (light and dark red bars) separately. (B) Decoding accuracy (red line) over time of antonyms for negated phrases, as a result of decoding approach (i). Significant time windows are indicated by red shading and horizontal solid lines. (C) Decoding accuracy of antonyms over time for affirmative (green line) and negated (red line) phrases, as a result of decoding approach (ii). Significant time windows for affirmative and negated phrases are indicated by green and red shading and horizontal solid lines. The significant time window of the difference between affirmative and negated phrases is indicated by a black horizontal solid line. (D) Probability estimates for low (light red) and high (dark red) negated antonyms averaged across the significant time windows depicted in B. Bars represent the participants’ mean ± SEM and dots represent individual participants. (E) Probability estimates for low (light green) and high (dark green) affirmative adjectives and for low (light red) and high (dark red) negated adjectives, averaged across the significant time window depicted as a black horizontal line in C. Chance level of probability estimates was computed by averaging probability estimates of the respective baseline (note that the baseline differs from 0.5 due to the different number of trials for each class in the training set of decoding approach (i)). Bars represent the participants’ mean ± SEM and dots represent individual participants. (B and C) AUC: area under the receiver operating characteristic curve, chance = 0.5 (black horizontal dashed line); each line and shading represent participants’ mean ± SEM. (BE) The black vertical dashed line indicates the presentation onset of the adjective; green = affirmative phrases, red = negated phrases. Data are available on the Open Science Framework https://doi.org/10.17605/OSF.IO/5YS6B.
Fig 7
Fig 7. Differences in beta power over time between negated and affirmative phrases.
(A) Differences in low (12–20 Hz, red) and high (21–30 Hz, yellow) beta power over time between negated (i.e., “### not,” “not ###,” “really not,” “not really,” “not not”) and affirmative phrases (i.e., “### really,” “really ###,” “really really”). Negated phrases show higher beta power compared to affirmative phrases throughout the presentation of the modifiers and for a sustained time window from adjective onset up to approximately 700 ms; significant time windows are indicated by red (low-beta) and yellow (high-beta) shading; black vertical dashed lines indicate the presentation onset of each word: modifier1, modifier2, and adjective; each line and shading represent participants’ mean ± SEM. (B) Differences (however not reaching statistical significance, α = 0.05) in high-beta power between negated and affirmative phrases (restricted between 97 and 271 ms from adjective onset, yellow cluster). (C) Significant differences in low-beta power between negated and affirmative phrases (restricted between 326 and 690 ms from adjective onset) in the left precentral, postcentral, and paracentral gyrus (red cluster). Note that no significant spatial clusters were found in the right hemisphere. Data are available on the Open Science Framework https://doi.org/10.17605/OSF.IO/5YS6B.

Comment in

  • "Not" in the brain and behavior.
    Coopmans CW, Mai A, Martin AE. Coopmans CW, et al. PLoS Biol. 2024 May 31;22(5):e3002656. doi: 10.1371/journal.pbio.3002656. eCollection 2024 May. PLoS Biol. 2024. PMID: 38820496 Free PMC article.

Similar articles

Cited by

  • "Not" in the brain and behavior.
    Coopmans CW, Mai A, Martin AE. Coopmans CW, et al. PLoS Biol. 2024 May 31;22(5):e3002656. doi: 10.1371/journal.pbio.3002656. eCollection 2024 May. PLoS Biol. 2024. PMID: 38820496 Free PMC article.

References

    1. Ding N, Melloni L, Zhang H, Tian X, Poeppel D. Cortical tracking of hierarchical linguistic structures in connected speech. Nat Neurosci. 2015;19:158–164. doi: 10.1038/nn.4186 - DOI - PMC - PubMed
    1. Fedorenko E, Scott TL, Brunner P, Coon WG, Pritchett B, Schalk G, et al.. Neural correlate of the construction of sentence meaning. Proc Natl Acad Sci U S A. 2016;113:E6256–E6262. doi: 10.1073/pnas.1612132113 - DOI - PMC - PubMed
    1. Martin AE, Baggio G. Modelling meaning composition from formalism to mechanism. Philos Trans R Soc Lond B Biol Sci. 2019:1–7. doi: 10.1098/rstb.2019.0298 - DOI - PMC - PubMed
    1. Matchin W, Hickok G. The Cortical Organization of Syntax. Cereb Cortex. 2020;30:1481–1498. doi: 10.1093/cercor/bhz180 - DOI - PMC - PubMed
    1. Oseki Y, Marantz A. Modeling morphological processing in human magnetoencephalography. Proceedings of the Society for Computation in Linguistics. New York, NY: Association for Computational Linguistics; 2020. pp. 431–441.