. 2024 May 30;20(5):e1012034.
doi: 10.1371/journal.ppat.1012034. eCollection 2024 May.

A novel ilarvirus protein CP-RT is expressed via stop codon readthrough and suppresses RDR6-dependent RNA silencing

Affiliations

A novel ilarvirus protein CP-RT is expressed via stop codon readthrough and suppresses RDR6-dependent RNA silencing

Nina Lukhovitskaya et al. PLoS Pathog. .

Abstract

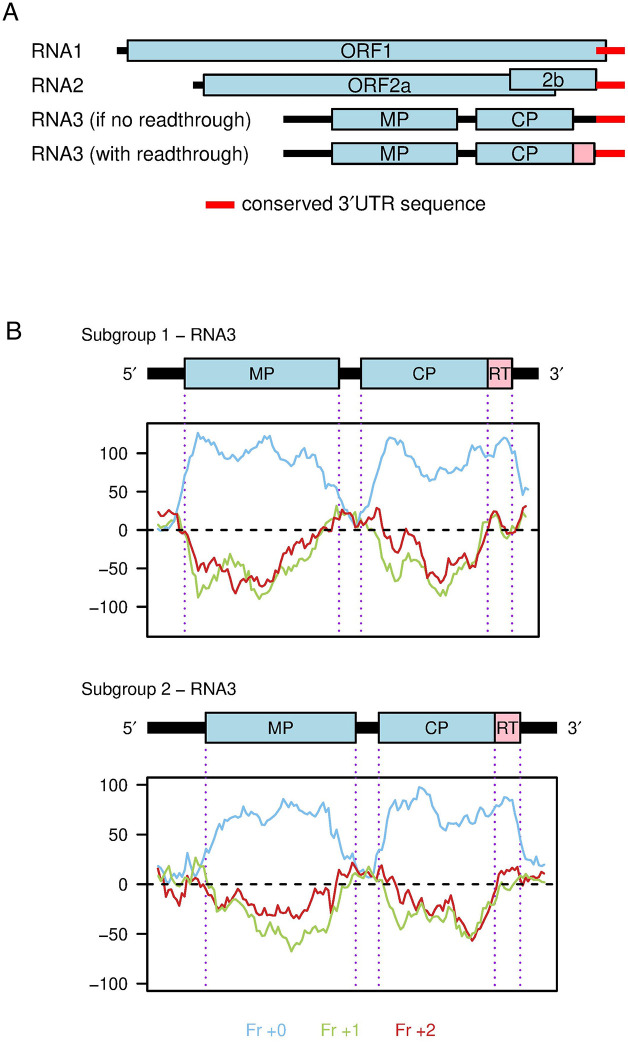
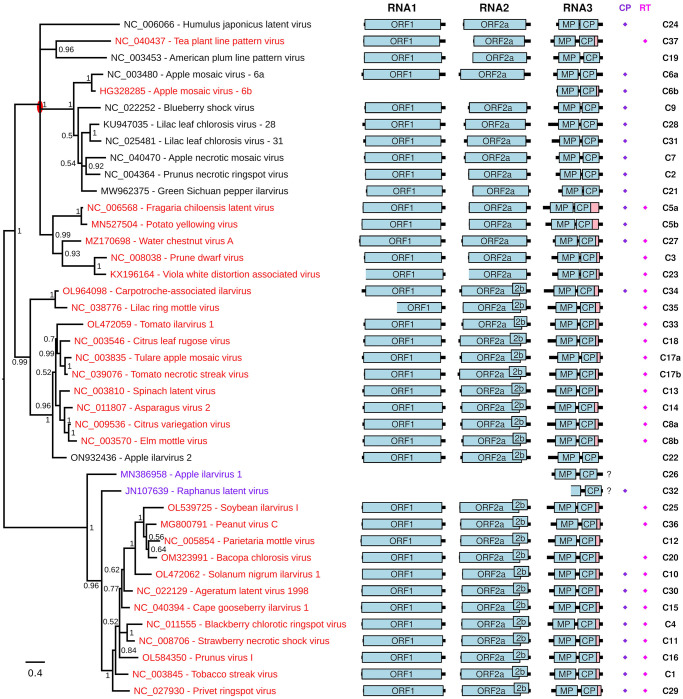
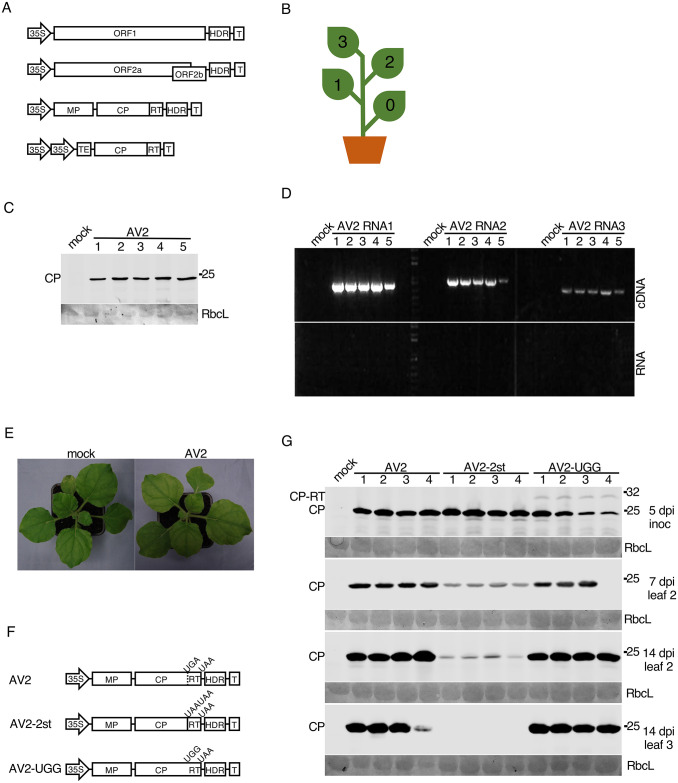
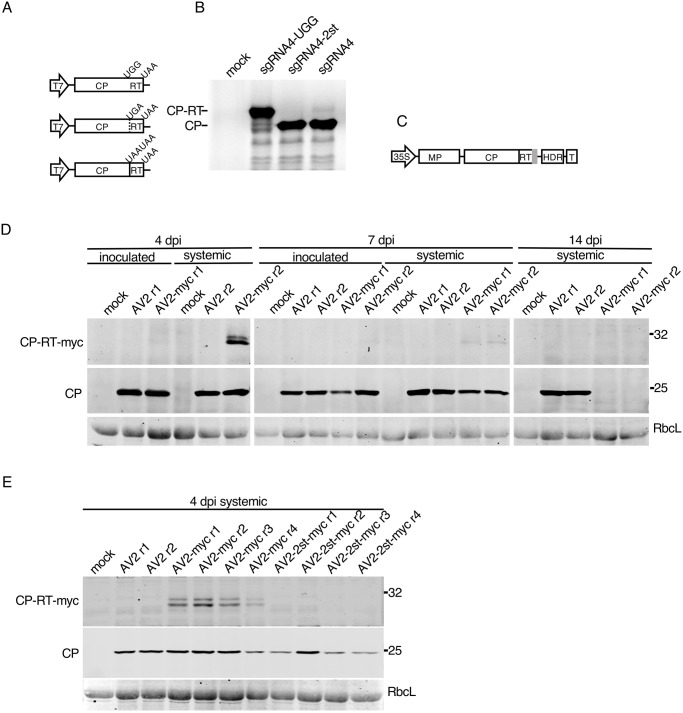
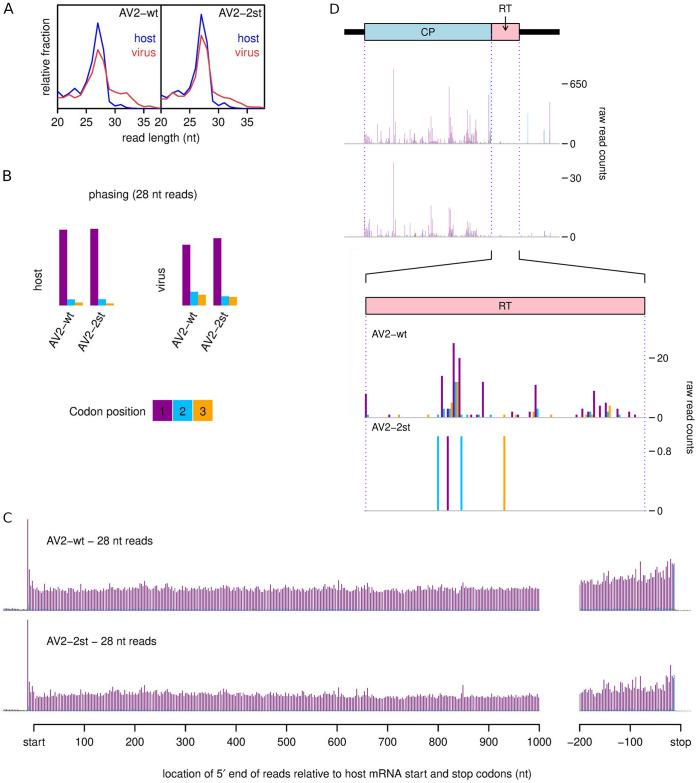
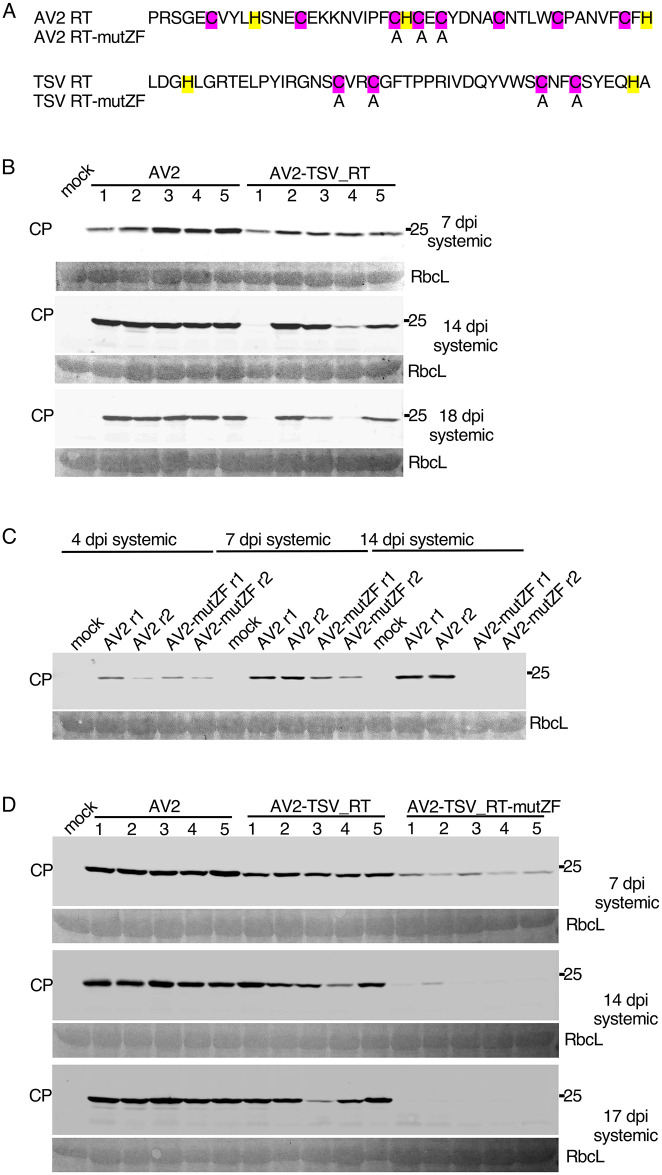
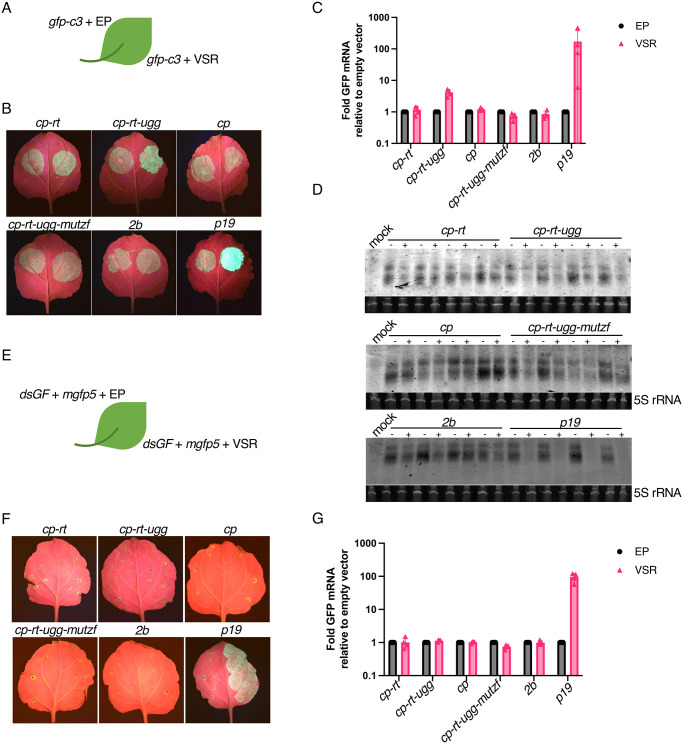
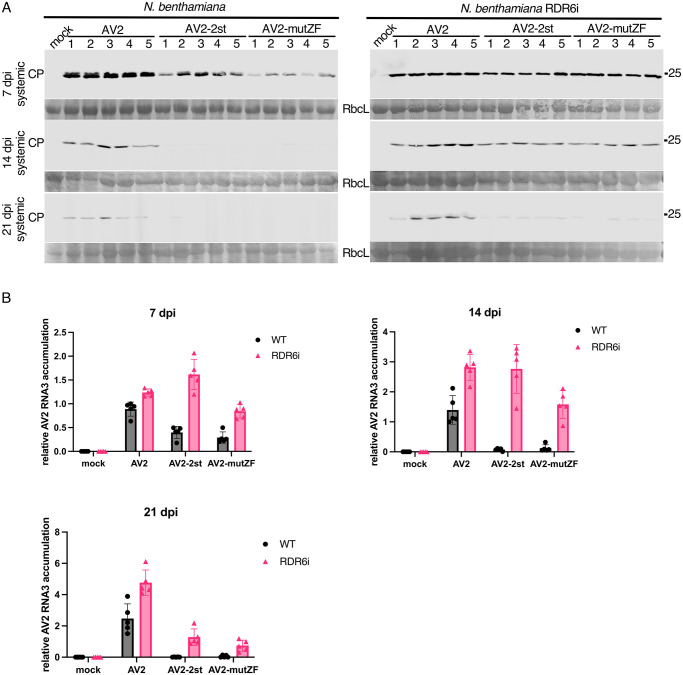
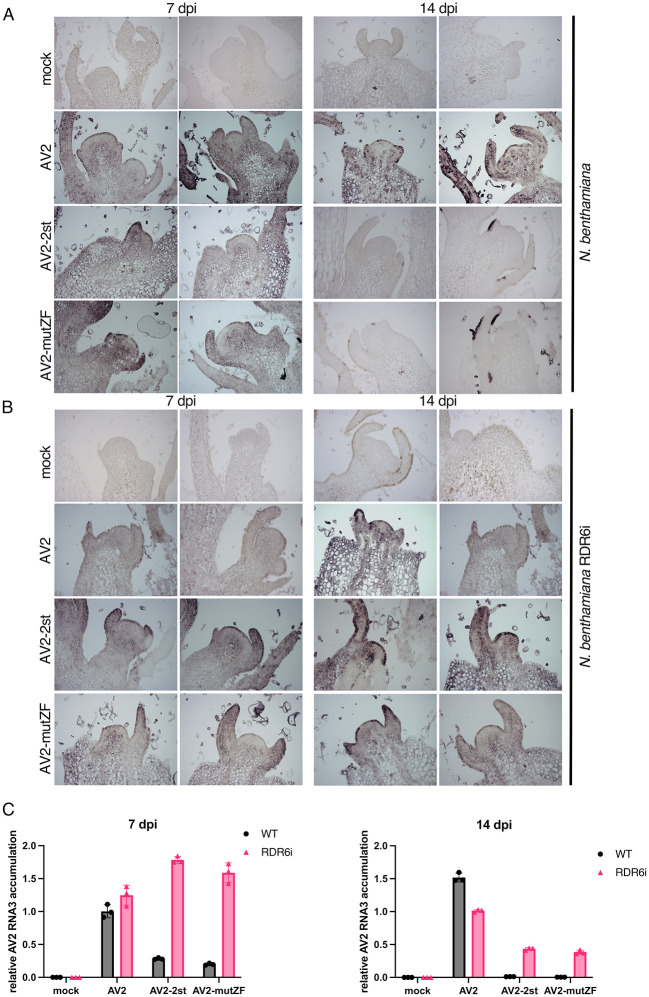
Ilarviruses are a relatively understudied but important group of plant RNA viruses that includes a number of crop pathogens. Their genomes comprise three RNA segments encoding two replicase subunits, movement protein, coat protein (CP), and (in some ilarvirus subgroups) a protein that suppresses RNA silencing. Here we report that, in many ilarviruses, RNA3 encodes an additional protein (termed CP-RT) as a result of ribosomal readthrough of the CP stop codon into a short downstream readthrough (RT) ORF. Using asparagus virus 2 as a model, we find that CP-RT is expressed in planta where it functions as a weak suppressor of RNA silencing. CP-RT expression is essential for persistent systemic infection in leaves and shoot apical meristem. CP-RT function is dependent on a putative zinc-finger motif within RT. Replacing the asparagus virus 2 RT with the RT of an ilarvirus from a different subgroup restored the ability to establish persistent infection. These findings open up a new avenue for research on ilarvirus silencing suppression, persistent meristem invasion and vertical transmission.


Conflict of interest statement

The authors have declared that no competing interests exist.

Figures

Fig 1
Fig 1. A putative RT domain in ilarvirus RNA3.
(A) Map of the AV2 genome. Coding ORFs 1, 2a, 2b, MP (movement protein) and CP (coat protein) are annotated in light blue. The 193 nt 3′UTR sequence that is shared between all three segments is annotated in red. Note that in RNA1, this sequence overlaps with ORF1. In the old annotation, there is a substantial noncoding sequence (black) between the end of the CP ORF and the start of the shared 3’UTR sequence. The putative readthrough (RT) ORF (pink) fills this apparent gap. (B) Three-frame coding potential analysis of RNA3 as measured using MLOGD. Positive scores indicate that the sequence is likely to be coding in the given reading frame (blue–frame of the MP, CP and RT ORFs; green–+1 frame; red–+2 frame).
Fig 2
Fig 2. Ilarvirus phylogenetic tree and genome maps.
At left is shown a phylogenetic tree of ilarvirus CP amino acid sequences–derived from one RNA3 reference sequence for each of 41 sequence clusters and subclusters (see SC Data). Reference sequences that have a putative RT domain (as defined by the apparent presence of a lengthy insert in RNA3 when the 3′-of-CP region is compared with the 3′UTRs of RNAs 2 and 3; see SC Data) are in red. Sequences for which this is unknown due to the absence of appropriate RNA1/RNA2 sequence data are in purple. Sequences that are proposed not to have a RT domain are in black. The tree is midpoint rooted and nodes are labelled with posterior probability values. The red oval indicates a possible re-rooting of the tree that groups together most of the sequences with a putative RT domain. Note that apple mosaic virus and lilac leaf chlorosis virus each occur twice on the tree since each species has representatives in >1 clusters (indicated by the cluster suffixes 6a/6b and 28/31, respectively; see SC Data for details). Genome maps are shown at right with ORFs 1, 2a, 2b, MP and CP indicated in pale blue and the putative RT domain, where present, in pink. "?"s indicate that the presence of a putative RT domain is unknown. Note that sequences EU919668, JN107639, KX196166 and KX196165 (at least) are not coding-complete; incomplete ORFs are indicated by the omission of the 5′ border of the corresponding ORF box. In addition, various sequences are missing various amounts of the 5′ and/or 3′UTR. At far right are the cluster numbers (C1, C2, etc). Diamonds indicate the presence of a putative zinc finger near the N-terminus of CP (purple) or within the RT domain (pink) as defined, simplistically, by the presence of a cluster of at least four Cys/His residues with at least two of them being Cys.
Fig 3
Fig 3. Testing the infectivity of the AV2 full-length cDNA clone in N. benthamiana and mutagenesis of the RT domain.
(A) Schematic representation of the AV2 cDNA infectious clone. The full-length cDNAs of the AV2 genomic RNAs 1, 2 and 3 were inserted independently into pDIVA between the CaMV 35S promoter (35S) and a hepatitis delta ribozyme sequence (HDR) followed by a transcription terminator (T). The cp-rt coding sequence (including the CP stop codon) was inserted independently into pLH 7000 between double 35S promoters followed by the tobacco etch virus translational enhancer (TEV) at the 5′ end, and a transcription terminator (T) at the 3′ end. (B) Schematic representation of an infected N. benthamiana plant with indicated leaf positions where 0 indicates the inoculated leaf. (C,D) Detection of AV2 in the 3rd upper non-inoculated leaf at 21 dpi for five infected plants by western blot against CP (panel C), and RT-PCR with primers for detection of RNAs 1, 2 and 3 (panel D). PCR on RNA without a reverse transcription step (panel E, bottom) served as a negative control. (E) Lack of visible symptoms on the upper non-inoculated leaves of a representative AV2-infected N. benthamiana plant (right) compared to a mock-inoculated plant (left). (F) Schematic representation of AV2 RNA3 mutants. (G) Detection of AV2 CP by western blot in plants infected with AV2, AV2-2st or AV2-UGG. Samples were collected from the inoculated leaf at 5 dpi, the 2nd non-inoculated leaf at 7 and 14 dpi, and the 3rd non-inoculated leaf at 14 dpi. Positions of CP and CP-RT are indicated on the left. In panels C and G, sizes of molecular weight markers are indicated on the right, and Ponceau red staining (lower panels) was used as a loading control.
Fig 4
Fig 4. Detection of CP-RT in vitro and in vivo.
(A) Schematic representation of sgRNA4 and its UGG and 2st mutant clones under a T7 promoter. (B) SDS-PAGE of proteins translated in wheatgerm extracts from in vitro transcripts of sgRNA4 and its two mutants. Mock–no RNA added. After drying the gel, proteins radioactively labelled with [35S]Met were detected using a phosphorimager. (C) Schematic representation of the AV2 RNA3 with a tag (grey rectangle) appended to the 3′ end of the CP-RT gene. (D) Detection of CP and CP-RT-myc by western immunoblotting in plants infected with AV2 or AV2-myc. Samples were collected from the inoculated leaf and the 2nd upper non-inoculated leaf at 4 and 7 dpi, and the 3rd upper non-inoculated leaf (see Fig 3B) at 14 dpi. (E) Detection of CP and CP-RT-myc by western blotting in extracts of plants infected with AV2, AV2-myc or AV2-2st-myc. Samples were collected from the 2nd upper non-inoculated leaf at 4 dpi (see Fig 3B). Positions of CP and CP-RT-myc are indicated on the left. Sizes of molecular weight markers are indicated on the right in panels B, D and E. Ponceau red staining of the large Rubisco subunit (RbcL) was used as a loading control in panels D and E.
Fig 5
Fig 5. Ribosome profiling of systemically infected leaf tissues from N. benthamiana plants agroinfected with AV2 or AV2-2st.
(A) Relative length distributions for Ribo-Seq reads mapping to virus (red) and host (blue) mRNA coding regions. (B) Phasing of 5′ ends of 28 nt reads that map to the viral ORFs (excluding dual coding regions) or host mRNA coding regions. (C) Histograms of approximate P-site positions of 28 nt reads relative to annotated initiation and termination sites summed over all host mRNAs. For panels C and D, see SJ Fig for the 27 nt read data. (D) Distribution of 28 nt reads on the 3′ half of RNA3 for AV2 and AV2-2st. Histograms show the positions of the 5′ ends of reads, with a +12 nt offset to map approximate P-site positions. Colours purple, blue and orange indicate the three different phases relative to the reading frame of the CP ORF. Therefore, consistent with panel B, most 28 nt reads map to the purple phase in the CP ORF, and true ribosome protected fragments (RPFs) are expected to map to the purple phase in the RT ORF. Note that nucleotide-to-nucleotide variation in RPF counts may be influenced by technical biases besides ribosome codon dwell-times. Reads in the 3′UTR and a fraction of reads throughout the genome undoubtably derive from non-RPF contamination, and contamination is likely to be relatively more pronounced in the lowly expressed AV2-st (cf. SC Table). See SK Fig and SL Fig for full-genome plots and for 27 nt read data.
Fig 6
Fig 6. Complementation of the AV2 RT domain by the TSV RT domain and mutagenesis of the putative zinc finger.
(A) Mutations introduced into the AV2 and TSV RT domains. Cysteines and histidines–potentially involved in zinc finger formation–are highlighted in purple and yellow, respectively. Replaced amino acid residues are indicated. (B) Detection of CP by western blotting in protein extracted from plants infected with AV2 or AV2-TSV_RT. Samples were collected at 4 and 7 dpi from the 2nd upper non-inoculated leaf, and at 14 and 18 dpi from the 3rd upper non-inoculated leaf. (C) Detection of CP by western blotting in extracts of plants infected with AV2 or AV2-mutZF. Samples were collected at 4 and 7 dpi from the 2nd upper non-inoculated leaf, and at 14 dpi from the 3rd upper non-inoculated leaf. (D) Detection of CP by western blotting in protein extracted from plants infected with AV2, AV2-TSV_RT or AV2-TSV_RT-mutZF. Samples were collected at 7 dpi from the 2nd upper non-inoculated leaf, and at 14 and 17 dpi from the 3rd upper non-inoculated leaf. In panels B, C and D, sizes of molecular weight markers are indicated on the right, and Ponceau red staining of the large Rubisco subunit (RbcL) was used as a loading control.
Fig 7
Fig 7. Silencing suppression activity of cp-rt, cp, cp-rt-ugg and cp-rt-ugg-mutzf in an agroinfiltration assay.
(A) gfp-c3 was introduced by agroinfiltration into N. benthamiana leaves along with a plasmid encoding a candidate VSR (right half of leaf) or the empty plasmid (EP) (left half of leaf). (B) Agroinfiltrated N. benthamiana leaves were imaged under UV light at 4 dpi. The agroinfiltrated constructs are indicated above the images. (C) RT-qPCR analysis of gfp mRNA accumulation. Nb ACT-b (GI:380505031) was used as a reference gene. Values represent the mean +/− SD (n = 4). (D) Northern blot analyses depicting the accumulation of gfp-specific siRNAs. A hydrolysed Cy5 labelled in vitro transcribed RNA fragment complementary to gfp was used as a probe. 5S ribosomal RNA was used as a loading control. (E–G) As for panels A–C except mgfp5 and dsGF were used instead of gfp-c3.
Fig 8
Fig 8. The different course of infection of AV2, AV2-2st and AV2-mutZF in wild type and RDR6i N. benthamiana plants.
(A) Detection of CP by western blot in wild type N. benthamiana (left panels) and RDR6i N. benthamiana (right panels) infected with AV2, AV2-2st or AV2-mutZF. Samples were collected at 7 dpi from the 2nd upper non-inoculated leaf, and at 14 and 21 dpi from the 3rd upper non-inoculated leaf. Sizes of molecular weight markers are indicated on the right. Ponceau red staining of the large Rubisco subunit (RbcL) was used as a loading control. (B) RT-qPCR analysis of RNA3 accumulation at the same time points. Nb ACT-b (GI:380505031) was used as a reference gene. Values are expressed in arbitrary units and represent the mean +/− SD (n = 5).
Fig 9
Fig 9. Detection of RNA3 in longitudinal sections of the top-most shoot apices.
(A) Wild type N. benthamiana plants were infected with AV2, AV2-2st or AV2-mutZF, and samples were collected at 7 and 14 dpi. AV2 RNA was detected by in situ hybridisation using the digoxigenin (Roche Diagnostics GmbH) labelled in vitro transcribed RNA fragment complementary to the AV2 CP ORF. Darker blue-purple areas indicate hybridisation signal indicative of viral RNA. (B) As for panel A but using RDR6i transgenic N. benthamiana plants. In A and B two representative sections are shown for each treatment at each time-point. (C) RT-qPCR analysis of RNA3 accumulation in apical tissues of infected plants. Samples were collected at the same time points as for in situ hybridisation. Shoot apices of five infected plants were pooled together for RNA extraction. Nb ACT-b (GI:380505031) was used as a reference gene. Values are expressed in arbitrary units and represent the mean +/− SEM of three technical replicates.
Fig 10
Fig 10. Characteristics of virus and host small RNAs.
(A) The number of virus mapping reads of each length, divided by the total number of virus mapping reads (summed across replicates for each time point) for the AV2 (pink, bars 1 and 2 in each block) and AV2-2st (blue, bars 3 and 4 in each block) infected samples. (B) For 21 nt, 22 nt, 24 nt and all read lengths, the normalised number of reads mapping to the positive (above axis) and negative (below axis) strands of the AV2 genome for AV2 and AV2-2st infected samples, at each time point. Bar heights show the mean for each condition and timepoint; black dots show the individual replicates. (C) The number of 21 nt reads mapping to each viral RNA, divided by the number of virus mapping reads in the replicate, separated by replicate and time point, for AV2 and AV2-2st infected samples. RNA1 is shown in black at the bottom of each bar, RNA2 in cyan in the centre, and RNA3 in orange at the top. Other read lengths are shown in SO Fig. (D) For 21 nt, 22 nt, 24 nt and all read lengths, the proportion of reads which mapped to the host (bottom section of each bar, light colours), virus (middle section, dark colours) and was unmapped for each sample (top section, grey), separated by treatment and time point, and summed across replicates (see SP(i) Fig for individual replicates). (E) The number of host mapping (left, light colours), virus mapping (middle, dark colours) and unmapped (grey) 21 nt, 22 nt and 24 nt reads, divided by the total number of reads mapping to the same destination (i.e. host, virus or unmapped), for AV2 and AV2-2st infected samples at each time point. Horizontal lines represent individual replicates. (F) RT-qPCR analysis of AV2 RNA3 accumulation in the samples used for high throughput siRNA sequencing. Nb ACT-b (GI:380505031) was used as a reference gene. Values are expressed in arbitrary units; coloured bars and black error bars represent the mean +/− SEM of three technical replicates (black dots). (G) The number of virus mapped 21 nt reads, with each possible 5′-terminal nucleotide for AV2 and AV2-2st infected samples at 14 dpi, divided by the total number of virus mapped 21 nt reads for the same sample and timepoint. See SQ Fig for 22 nt, 24 nt and all reads.
Fig 11
Fig 11. Distribution of vsiRNA reads on the AV2 genome.
The normalised number of 21 nt reads (shown as one solid line per replicate; left y axis) and the proportion of all 21 nt reads mapping to this RNA (shaded and summed across replicates; right y axis) spanning each position in the viral genome across RNA1 (left), RNA2 (middle) and RNA3 (right). Both annotations are smoothed with a 100 nt sliding window. AV2 infected samples are shown in red (upper panels) and AV2-2st infected samples in blue (lower panels). Positive-sense reads are shown above the axis and negative-sense reads below the axis. Similar plots for other read lengths (22 nt, 24 nt, all reads) are shown in SR Fig. Note–as discussed previously–reads that map to the conserved 3′ regions may be assigned at random to one of the three segments, potentially leading to an apparent over-abundance in RNAs 1 and 2 due to mismapping of reads that actually derive from the more abundant RNA3.

Similar articles

Cited by

References

    1. Firth AE, Brierley I. Non-canonical translation in RNA viruses. J Gen Virol. 2012;93: 1385–1409. doi: 10.1099/vir.0.042499-0 - DOI - PMC - PubMed
    1. Miras M, Miller WA, Truniger V, Aranda MA. Non-canonical translation in plant RNA viruses. Front Plant Sci. 2017;8: 494. doi: 10.3389/fpls.2017.00494 - DOI - PMC - PubMed
    1. Brault V, van den Heuvel JF, Verbeek M, Ziegler-Graff V, Reutenauer A, Herrbach E et al.. Aphid transmission of beet western yellows luteovirus requires the minor capsid read-through protein P74. EMBO J. 1995;14: 650–659 doi: 10.1002/j.1460-2075.1995.tb07043.x - DOI - PMC - PubMed
    1. Mutterer JD, Stussi-Garaud C, Michler P, Richards KE, Jonard G, Ziegler-Graff V. Role of the beet western yellows virus readthrough protein in virus movement in Nicotiana clevelandii. J Gen Virol. 1999;80: 2771–2778. doi: 10.1099/0022-1317-80-10-2771 . - DOI - PubMed
    1. Brault V, Mutterer J, Scheidecker D, Simonis MT, Herrbach E, Richards K et al.. Effects of point mutations in the readthrough domain of the beet western yellows virus minor capsid protein on virus accumulation in planta and on transmission by aphids. J Virol. 2000;74: 1140–1148. doi: 10.1128/jvi.74.3.1140-1148.2000 - DOI - PMC - PubMed