. 2024 May 30;9(13):e174329.
doi: 10.1172/jci.insight.174329.

Drug screening in human physiologic medium identifies uric acid as an inhibitor of rigosertib efficacy

Affiliations

Drug screening in human physiologic medium identifies uric acid as an inhibitor of rigosertib efficacy

Vipin Rawat et al. JCI Insight. .

Abstract

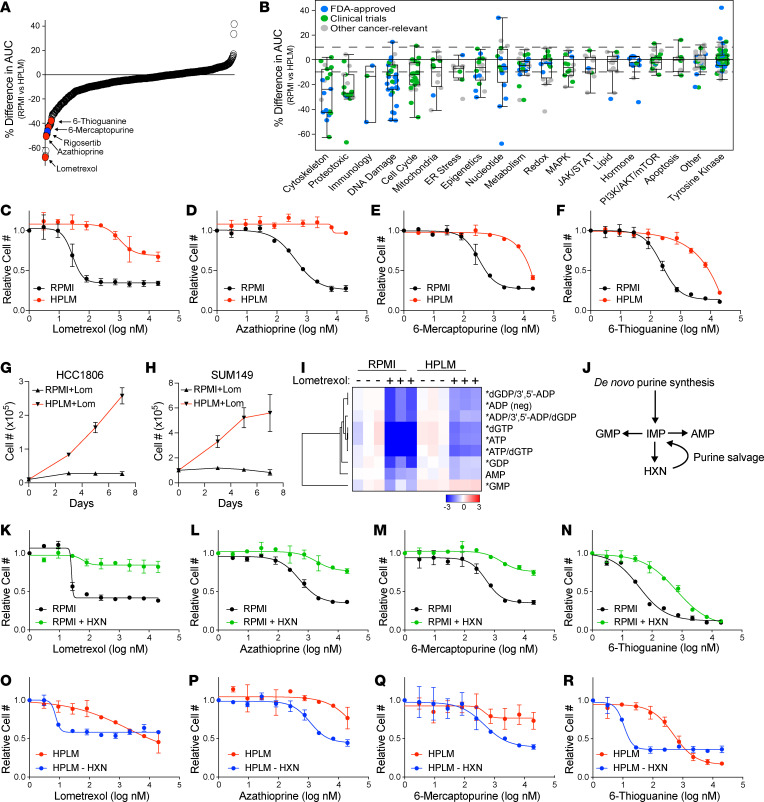
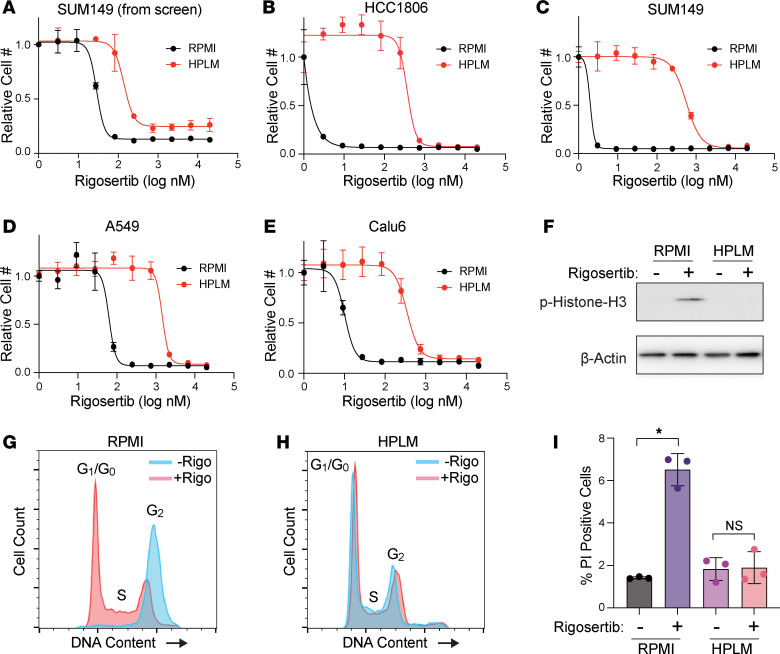
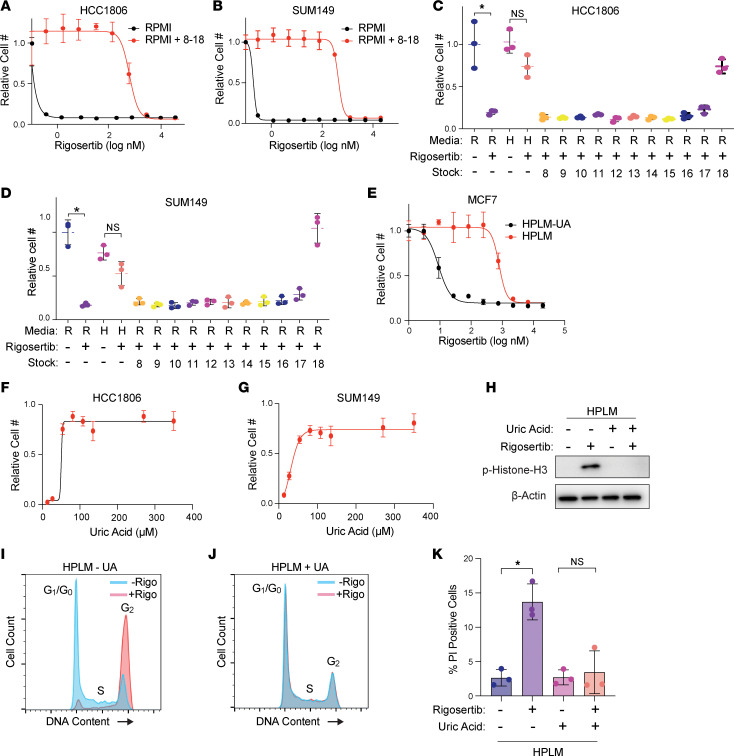
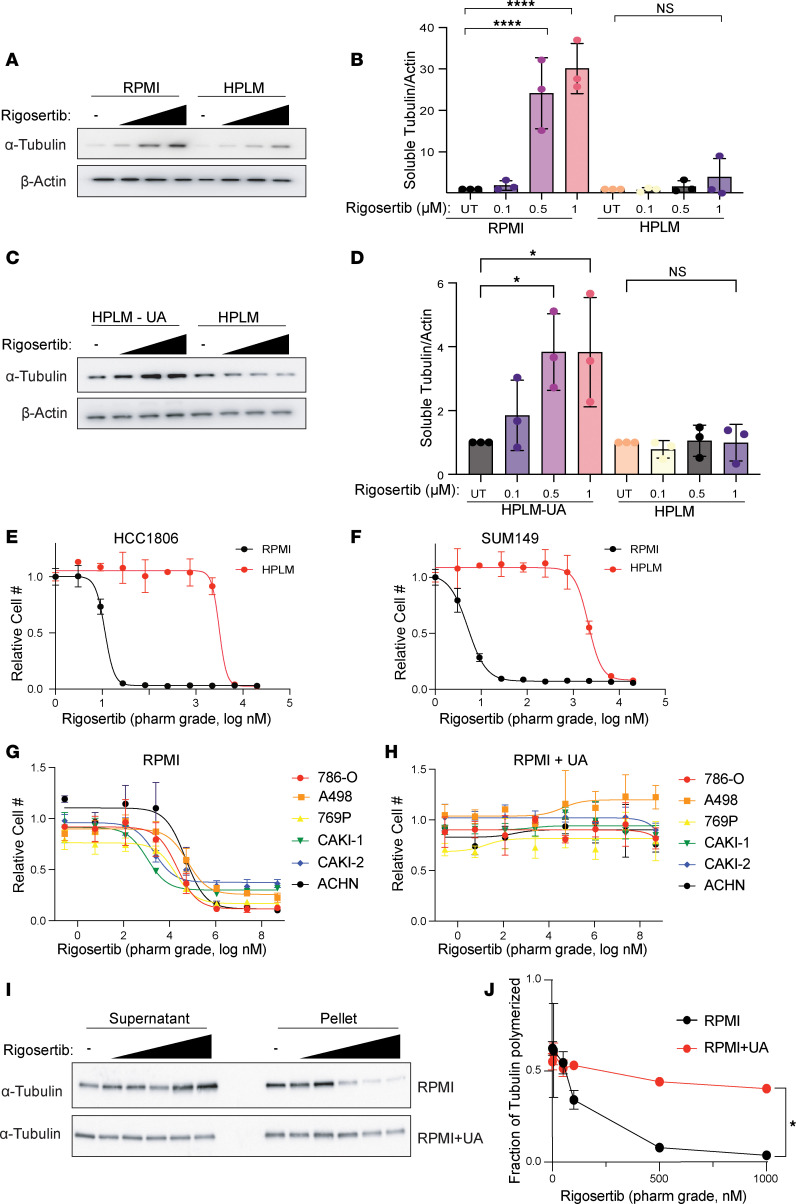
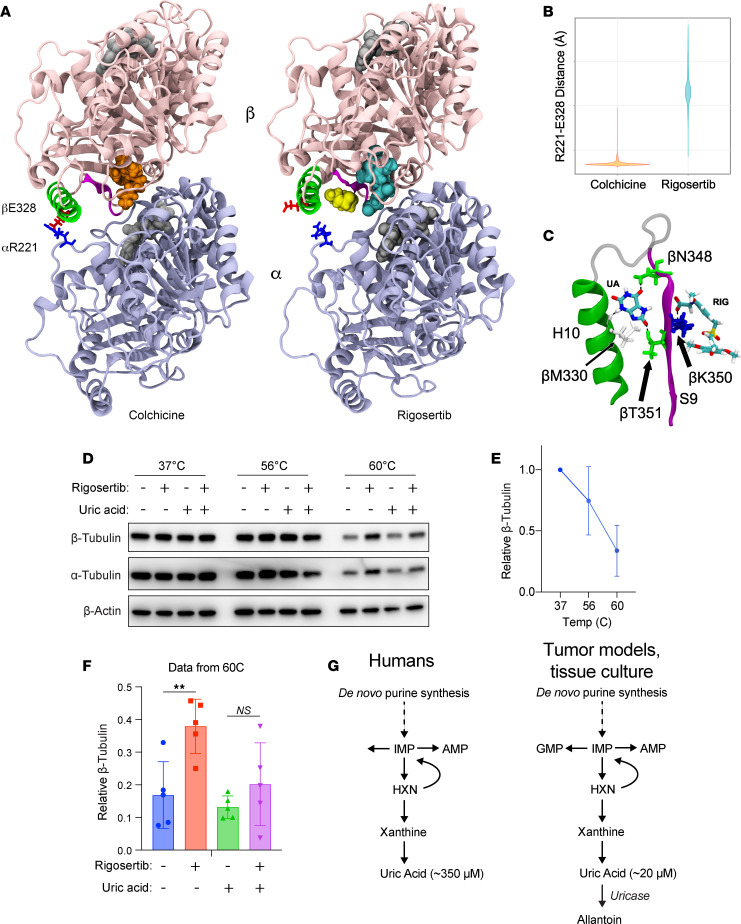
The nonphysiological nutrient levels found in traditional culture media have been shown to affect numerous aspects of cancer cell physiology, including how cells respond to certain therapeutic agents. Here, we comprehensively evaluated how physiological nutrient levels affect therapeutic response by performing drug screening in human plasma-like medium. We observed dramatic nutrient-dependent changes in sensitivity to a variety of FDA-approved and clinically trialed compounds, including rigosertib, an experimental cancer therapeutic that recently failed in phase III clinical trials. Mechanistically, we found that the ability of rigosertib to destabilize microtubules is strongly inhibited by the purine metabolism end product uric acid, which is uniquely abundant in humans relative to traditional in vitro and in vivo cancer models. These results demonstrate the broad and dramatic effects nutrient levels can have on drug response and how incorporation of human-specific physiological nutrient medium might help identify compounds whose efficacy could be influenced in humans.

Keywords: Cancer; Cell biology; Cytoskeleton; Drug screens; Oncology.


Conflict of interest statement

Conflict of interest: The authors have declared that no conflict of interest exists.

Figures

Figure 1
Figure 1. Culture in HPLM changes sensitivity to a variety of therapeutic agents.
(A) Percentage difference in the area under curve (% difference in AUC) data for SUM149 cells cultured in either RPMI or HPLM after treatment with anticancer and metabolic inhibitor libraries. Only compounds with a maximum effect of more than 50% in either medium are shown. (B) The same data as in A categorized based on target pathway. Box plots show the interquartile range, median (line), and minimum and maximum (whiskers). (CF) Dose-response curves of the purine biosynthesis inhibitors lometrexol (C), azathioprine (D), 6-mercaptopurine (E), and 6-thioguanine (F) on SUM149 cells growing in RPMI versus HPLM. (G and H) Growth curves of HCC1806 (G) and SUM149 (H) cells treated with lometrexol in RPMI versus HPLM. (I) LC-MS analysis to quantify purine nucleotide abundance in HCC1806 cells treated with lometrexol in RPMI versus HPLM. * indicates P < 0.05 for HPLM + lometrexol relative to RPMI + lometrexol (unpaired 2-tailed t test). (J) Schematic representation of purine synthesis and salvage pathways. (KN) Dose-response curves of the purine biosynthesis inhibitors lometrexol (K), azathioprine (L), 6-mercaptopurine (M), and 6-thioguanine (N) on SUM149 cells grown in RPMI with and without hypoxanthine (HXN). (OR) Dose-response curves of the purine biosynthesis inhibitors lometrexol (O), azathioprine (P), 6-mercaptopurine (Q), and 6-thioguanine (R) on SUM149 cells grown in HPLM with and without HXN. For all panels data represent the means ± SD of triplicate samples.
Figure 2
Figure 2. Culture in HPLM reduces sensitivity to rigosertib.
(A) Dose-response curve of SUM149 cells treated with rigosertib from the high-throughput screen described in Figure 1. Data are the mean ± SD of triplicate samples. (BE) Dose-response curves for rigosertib treatment of HCC1806 (B), SUM149 (C), A549 (D), and Calu6 (E) cells growing in RPMI versus HPLM. Data are the mean ± SD of triplicate samples. (F) Representative Western blot of phosphorylated histone H3 in HCC1806 cells treated with 150 nM rigosertib in RPMI versus HPLM. (G and H) Cell cycle analysis of HCC1806 cells treated with 150 nM commercial-grade rigosertib in RPMI (G) and HPLM (H). (I) Cell death analysis of HCC1806 cells treated with 200 nM commercial-grade rigosertib in RPMI versus HPLM. PI, propidium iodide. Cell death and cell cycle data are the means ± SD of triplicate samples. * indicates P < 0.05 by unpaired 2-tailed t test.
Figure 3
Figure 3. Uric acid prevents the activity of rigosertib.
(A and B) Dose-response curves of HCC1806 (A) and SUM149 (B) cells treated with rigosertib in RPMI versus RPMI + HPLM stocks 8–18. (C and D) Cell growth assays of HCC1806 (C) and SUM149 (D) cells treated with 80 nM rigosertib in the presence of individual HPLM stocks 8–18. R, RPMI; H, HPLM. (E) Dose-response curve of MCF7 cells treated with rigosertib in HPLM versus HPLM – UA. UA, uric acid. (F and G) Dose-response curves of uric acid on HCC1806 (F) and SUM149 (G) cells treated with 80 nM rigosertib. (H) Representative Western blot of phosphorylated histone H3 in HCC1806 cells treated with 150 nM rigosertib in HPLM versus HPLM – UA. (I and J) Cell cycle analysis of HCC1806 cells treated with 150 nM commercial-grade rigosertib in HPLM (I) and HPLM – UA (J). (K) Cell death analysis of HCC1806 cells treated with 200 nM commercial-grade rigosertib in HPLM and HPLM – UA. For all panels, data are represented as mean ± SD of triplicate samples. * indicates P < 0.05 by unpaired 2-tailed t test.
Figure 4
Figure 4. Uric acid inhibits the microtubule-destabilizing activity of rigosertib.
(A) Western blot of soluble α-tubulin from SUM149 cells treated with increasing doses of rigosertib (0.1 μM, 0.5 μM, and 1 μM) for 4 hours in RPMI and HPLM. (B) Quantification of Western blots from A. Data are represented as mean ± SD from 3 independent experiments. ****P < 0.0001, *P < 0.05 by 1-way ANOVA followed by Tukey’s multiple-comparison test. (C) Western blot of soluble α-tubulin from SUM149 treated with increasing doses of rigosertib (0.1 μM, 0.5 μM, and 1 μM) for 4 hours in HPLM and HPLM – UA. (D) Quantification of Western blots from C. Data are represented as mean ± SD from 3 independent experiments. *P < 0.05 by 1-way ANOVA followed by Tukey’s multiple-comparison test. (E and F) Dose-response curves of HCC1806 (E) and SUM149 (F) cells treated with pharmaceutical-grade rigosertib in RPMI versus HPLM. (G and H) Dose-response curves of a panel of renal cancer cell lines treated with pharmaceutical-grade rigosertib in RPMI (G) versus RPMI + UA (H). (I) Western blot of soluble and pellet α-tubulin from 786-O cells treated with increasing doses (5 nM, 50 nM, 100 nM, 500 nM, 1,000 nM) of pharmaceutical-grade rigosertib for 4 hours in RPMI and RPMI + UA. (J) Quantification of Western blots from I. Data are represented as means ± SD of 3 independent experiments. *P < 0.05 by 2-way ANOVA.
Figure 5
Figure 5. Uric acid inhibits rigosertib activity by reducing the affinity of rigosertib for β-tubulin.
(A) Structural comparisons of colchicine-bound and rigosertib-bound tubulin. Colchicine and rigosertib are colored orange and cyan, respectively. The salt bridge between βE328 and αR221 found in the colchicine structure is absent in the rigosertib structure, allowing H10 (shown in green) to move away from the dimer body and create a pocket for uric acid (shown in yellow) to bind. (B) Distance between βE328 and αR221 in the colchicine and rigosertib simulations. When this ionic bond is not formed, H10 becomes untethered, which creates the binding pocket for uric acid. (C) Molecular details of uric acid binding in the pocket between H10 (green) and S9 (magenta). Residues that form hydrogen bonds with uric acid are labeled. (D) CETSA analysis of K562 cells treated for 4 hours with 40 μM pharmaceutical-grade rigosertib in RPMI at the indicated temperature. (E) Quantification of β-tubulin melting at increasing temperature in the absence of uric acid and rigosertib. N = 5 independent experiments. (F) Quantification of β-tubulin at 60°C in the presence and absence of rigosertib and uric acid. Data are represented as means ± SD of 5 independent experiments. **P < 0.01 from unpaired 2-tailed t test. (G) Unlike mice and other model organisms and systems, humans do not express uricase, resulting in uniquely high uric acid levels.

Update of

References

    1. Altea-Manzano P, et al. Nutrient metabolism and cancer in the in vivo context: a metabolic game of give and take. EMBO Rep. 2020;21(10):e50635. doi: 10.15252/embr.202050635. - DOI - PMC - PubMed
    1. Sullivan MR, et al. Quantification of microenvironmental metabolites in murine cancers reveals determinants of tumor nutrient availability. Elife. 2019;8:e44235. doi: 10.7554/eLife.44235. - DOI - PMC - PubMed
    1. Rinaldi G, et al. Metabolic interactions in cancer: cellular metabolism at the interface between the microenvironment, the cancer cell phenotype and the epigenetic landscape. Wiley Interdiscip Rev Syst Biol Med. 2018;10(1):1397. doi: 10.1002/wsbm.1414. - DOI - PubMed
    1. Dulbecco R, Freeman G. Plaque production by the polyoma virus. Virology. 1959;8(3):396–397. doi: 10.1016/0042-6822(59)90043-1. - DOI - PubMed
    1. Eagle H. The specific amino acid requirements of a human carcinoma cell (Stain HeLa) in tissue culture. J Exp Med. 1955;102(1):37–48. doi: 10.1084/jem.102.1.37. - DOI - PMC - PubMed

LinkOut - more resources