

What is the spatiotemporal pattern of benzene concentration spread over susceptible area surrounding the Hartman Park community, Houston, Texas?
- PMID: 38815389
- PMCID: PMC11975435
- DOI: 10.1016/j.jhazmat.2024.134666
What is the spatiotemporal pattern of benzene concentration spread over susceptible area surrounding the Hartman Park community, Houston, Texas?
Abstract
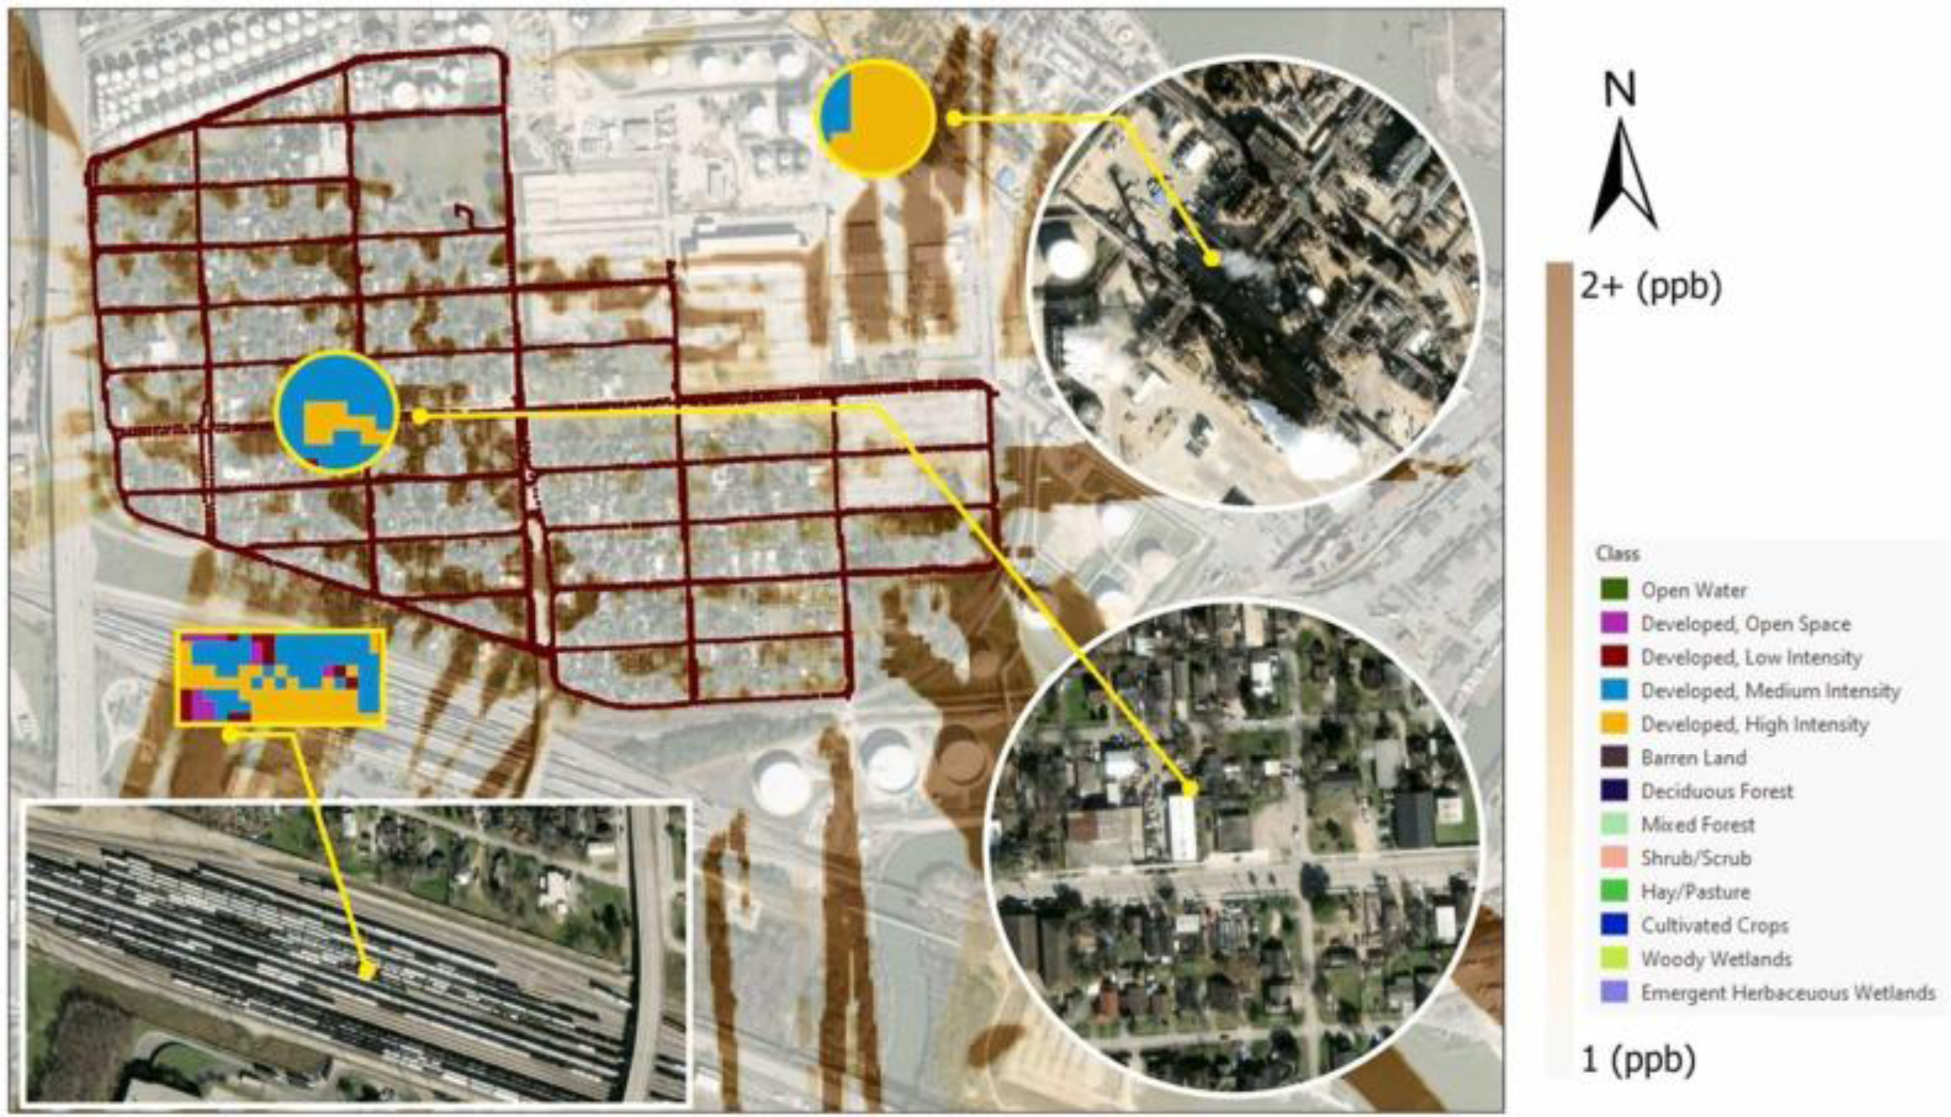
The Hartman Park community in Houston, Texas-USA, is in a highly polluted area which poses significant risks to its predominantly Hispanic and lower-income residents. Surrounded by dense clustering of industrial facilities compounds health and safety hazards, exacerbating environmental and social inequalities. Such conditions emphasize the urgent need for environmental measures that focus on investigating ambient air quality. This study estimated benzene, one of the most reported pollutants in Hartman Park, using machine learning-based approaches. Benzene data was collected in residential areas in the neighborhood and analyzed using a combination of five machine-learning algorithms (i.e., XGBR, GBR, LGBMR, CBR, RFR) through a newly developed ensemble learning model. Evaluations on model robustness, overfitting tests, 10-fold cross-validation, internal and stratified validation were performed. We found that the ensemble model depicted about 98.7% spatial variability of benzene (Adj. R2 =0.987). Through rigorous validations, stability of model performance was confirmed. Several predictors that contribute to benzene were identified, including temperature, developed intensity areas, leaking petroleum storage tank, and traffic-related factors. Analyzing spatial patterns, we found high benzene spread over areas near industrial zones as well as in residential areas. Overall, our study area was exposed to high benzene levels and requires extra attention from relevant authorities.
Keywords: Benzene concentration; Ensemble learning model; Hazardous pollution zone; Machine-learning algorithms; Vulnerable community.
Copyright © 2024 Elsevier B.V. All rights reserved.
Conflict of interest statement
Declaration of Competing Interest The authors declare no conflict of interest. The funders had no role in the study design; data collection, analyses, interpretation; writing of the manuscript; nor in the decision to publish the results.
Figures


References
-
- Sessions K (2023). Report: Houston ranks sixth on list of U.S. cities for worst air pollution. Available at: www.chron.com/news/houston-texas/article/houston-air-pollution-17830025.php, last access: 01 February 2024.
-
- Lam Y, Sivasubramanian R, Guerrero M, & Parras J (2021). Toxic air pollution in the Houston ship channel: disparities show urgent need for environmental justice. www.nrdc.org/sites/default/files/air-pollution-houston-ship-channel-ib.pdf.
-
- Sexton K, Linder S, Delclos G, Stock T, Abramson S, Bondy M, & Ward J. (2005). A closer look at air pollution in Houston: Identifying priority health risks. The Institute for Health Policy, University of Texas School of Public Health, Health Science Center at Houston.
-
- Texas Environmental Justice Advocacy Services. (2016). Air Toxics and Health in the Houston Community of Manchester. Available at: www.ucsusa.org/sites/default/files/attach/2016/06/ucs-manchester-air-tox..., last access: 01 February 2024.
-
- Hersher and Schaped. (2017). Air Pollution from Industry Plagues Houston in Harvey’s Wake. National Public Radio, United States. Available at: www.npr.org/sections/health-shots/2017/09/14/550472740/air-pollution-fro..., last access: 01 February 2024.
Grants and funding
LinkOut - more resources
Full Text Sources
Miscellaneous
