

Deep learning reveals lung shape differences on baseline chest CT between mild and severe COVID-19: A multi-site retrospective study
- PMID: 38815485
- PMCID: PMC11188049
- DOI: 10.1016/j.compbiomed.2024.108643
Deep learning reveals lung shape differences on baseline chest CT between mild and severe COVID-19: A multi-site retrospective study
Abstract
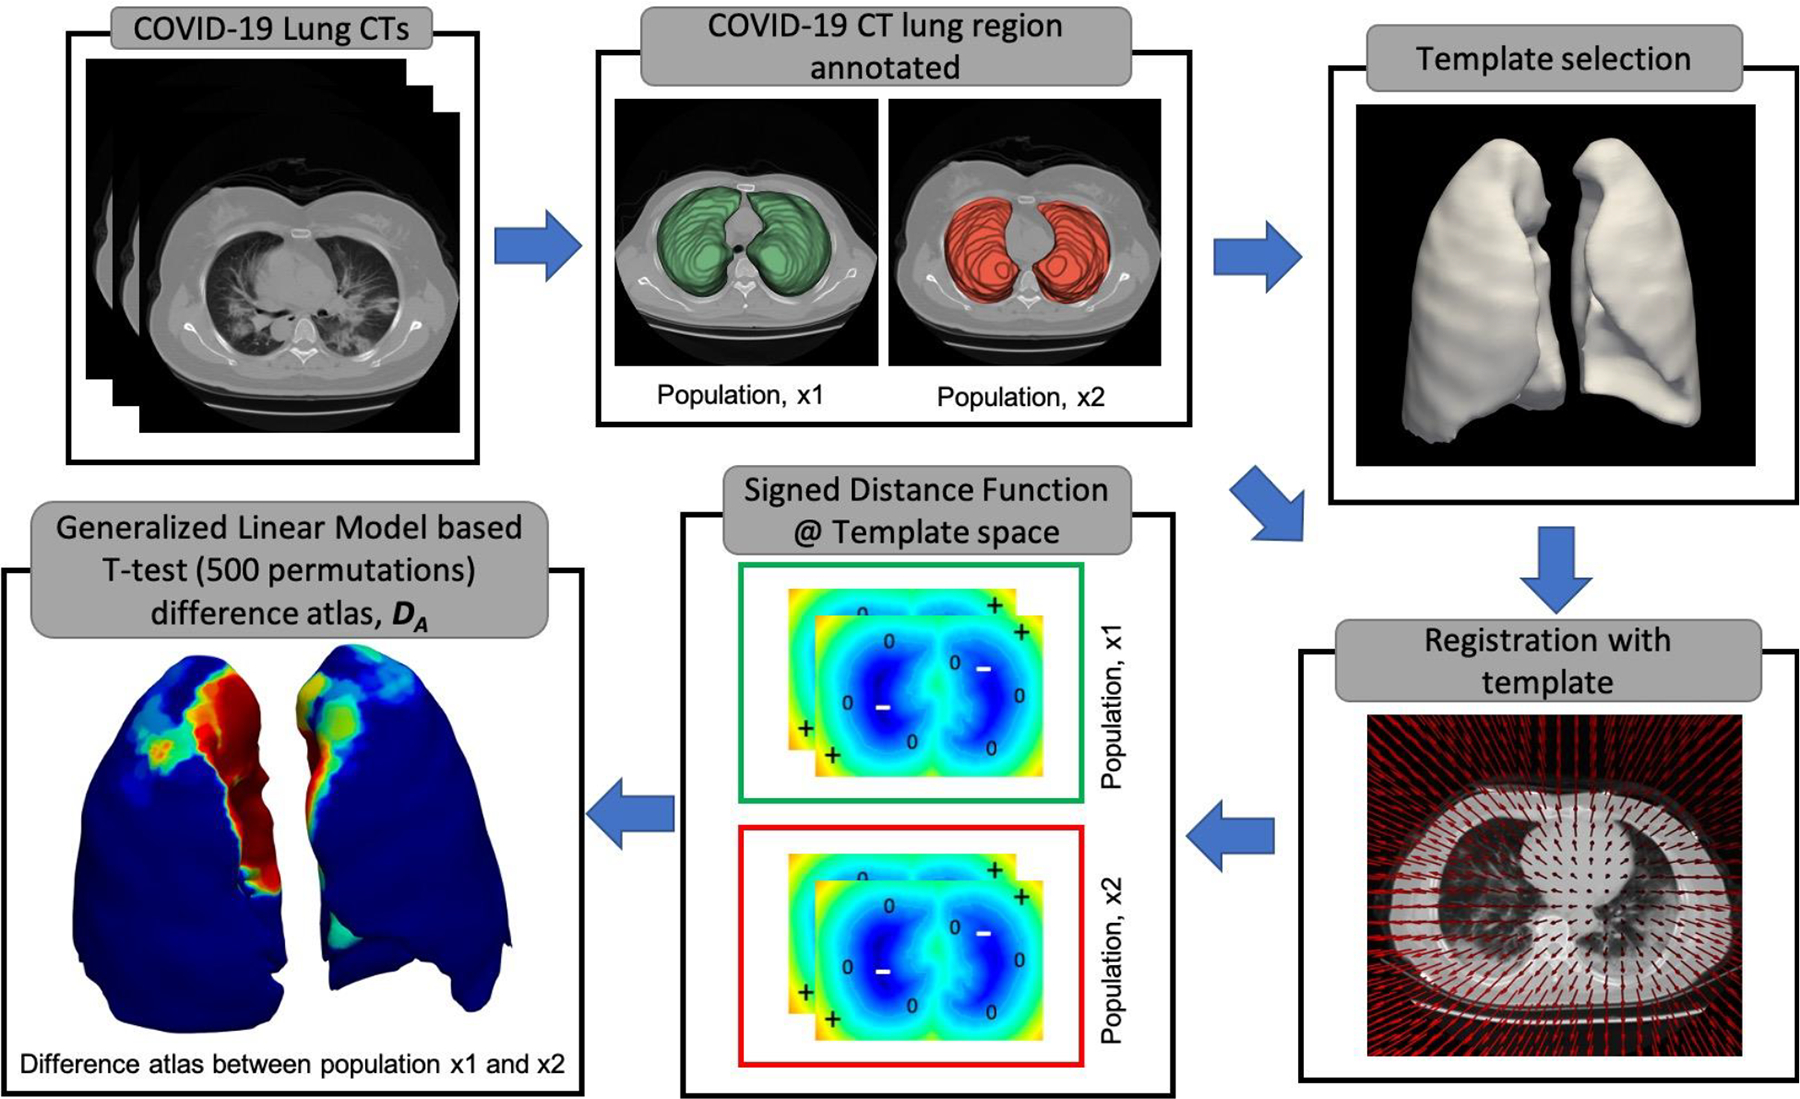
Severe COVID-19 can lead to extensive lung disease causing lung architectural distortion. In this study we employed machine learning and statistical atlas-based approaches to explore possible changes in lung shape among COVID-19 patients and evaluated whether the extent of these changes was associated with COVID-19 severity. On a large multi-institutional dataset (N = 3443), three different populations were defined; a) healthy (no COVID-19), b) mild COVID-19 (no ventilator required), c) severe COVID-19 (ventilator required), and the presence of lung shape differences between them were explored using baseline chest CT. Significant lung shape differences were observed along mediastinal surfaces of the lungs across all severity of COVID-19 disease. Additionally, differences were seen on basal surfaces of the lung when compared between healthy and severe COVID-19 patients. Finally, an AI model (a 3D residual convolutional network) characterizing these shape differences coupled with lung infiltrates (ground-glass opacities and consolidation regions) was found to be associated with COVID-19 severity.
Copyright © 2024 The Authors. Published by Elsevier Ltd.. All rights reserved.
Conflict of interest statement
Declaration of competing interest The authors declare the following financial interests/personal relationships which may be considered as potential competing interests: Anant Madabhushi reports financial support was provided by National Cancer Institute. Anant Madabhushi reports financial support was provided by Aiforia Inc. Anant Madabhushi reports financial support was provided by National Institute of Biomedical Imaging and Bioengineering. Anant Madabhushi reports financial support was provided by National Center for Research Resources. Anant Madabhushi reports financial support was provided by VA Merit Review Award. Anant Madabhushi reports financial support was provided by Breast Cancer Research Program. Anant Madabhushi reports financial support was provided by Prostate Cancer Research Program. Anant Madabhushi reports financial support was provided by Lung Cancer Research Program. Anant Madabhushi reports financial support was provided by Peer Reviewed Cancer Research Program. Anant Madabhushi reports financial support was provided by Kidney Precision Medicine Project. Anant Madabhushi reports financial support was provided by Glue Grant. Anant Madabhushi reports financial support was provided by Bristol Myers-Squibb. Anant Madabhushi reports financial support was provided by Boehringer-Ingelheim. Anant Madabhushi reports financial support was provided by Eli-Lilly. Anant Madabhushi reports financial support was provided by AstraZeneca. Anant Madabhushi reports a relationship with Picture Health that includes: board membership.
Figures


References
-
- A.l. A, S. AH, S.s. VC, 2021. COVID-19 diagnosis and severity detection from CT-images using transfer learning and back propagation neural network. Journal of Infection and Public Health, Special Issue on COVID-19 – Vaccine, Variants and New Waves 14, 1435–1445. 10.1016/j.jiph.2021.07.015 - DOI - PMC - PubMed
-
- Asaeikheybari G, Hiremath A, Shiradkar R, El-harasis M, Shoemaker MB, Barnard J, Gupta A, Chung MK, Madabhushi A, 2021. Abstract 14084: Computationally Identified Shape Differences In The Left Atrium On Pre-ablation Ct Scans Appear To Be Associated With Recurrence Of Atrial Fibrillation. Circulation 144, A14084–A14084. 10.1161/circ.144.suppl_1.14084 - DOI
-
- Bussani R, Schneider E, Zentilin L, Collesi C, Ali H, Braga L, Volpe MC, Colliva A, Zanconati F, Berlot G, Silvestri F, Zacchigna S, Giacca M, 2020. Persistence of viral RNA, pneumocyte syncytia and thrombosis are hallmarks of advanced COVID-19 pathology. eBioMedicine 61. 10.1016/j.ebiom.2020.103104 - DOI - PMC - PubMed
Publication types
MeSH terms
Grants and funding
- I01 CX002776/CX/CSRD VA/United States
- I01 CX002622/CX/CSRD VA/United States
- C06 RR012463/RR/NCRR NIH HHS/United States
- IK6 BX006185/BX/BLRD VA/United States
- U01 CA239055/CA/NCI NIH HHS/United States
- R01 HL158071/HL/NHLBI NIH HHS/United States
- R01 CA268287/CA/NCI NIH HHS/United States
- R01 CA249992/CA/NCI NIH HHS/United States
- R01 HL151277/HL/NHLBI NIH HHS/United States
- R01 CA220581/CA/NCI NIH HHS/United States
- R01 CA216579/CA/NCI NIH HHS/United States
- R01 CA268207/CA/NCI NIH HHS/United States
- R01 CA202752/CA/NCI NIH HHS/United States
- R01 CA208236/CA/NCI NIH HHS/United States
- U01 CA248226/CA/NCI NIH HHS/United States
- I01 BX004121/BX/BLRD VA/United States
- R43 EB028736/EB/NIBIB NIH HHS/United States
- U01 CA269181/CA/NCI NIH HHS/United States
- R01 CA257612/CA/NCI NIH HHS/United States
- U54 CA254566/CA/NCI NIH HHS/United States
LinkOut - more resources
Full Text Sources
Medical
