. 2024 Jun 6;84(11):2087-2103.e8.
doi: 10.1016/j.molcel.2024.05.004. Epub 2024 May 29.

hnRNPM protects against the dsRNA-mediated interferon response by repressing LINE-associated cryptic splicing

Affiliations

hnRNPM protects against the dsRNA-mediated interferon response by repressing LINE-associated cryptic splicing

Rong Zheng et al. Mol Cell. .

Abstract

RNA splicing is pivotal in post-transcriptional gene regulation, yet the exponential expansion of intron length in humans poses a challenge for accurate splicing. Here, we identify hnRNPM as an essential RNA-binding protein that suppresses cryptic splicing through binding to deep introns, maintaining human transcriptome integrity. Long interspersed nuclear elements (LINEs) in introns harbor numerous pseudo splice sites. hnRNPM preferentially binds at intronic LINEs to repress pseudo splice site usage for cryptic splicing. Remarkably, cryptic exons can generate long dsRNAs through base-pairing of inverted ALU transposable elements interspersed among LINEs and consequently trigger an interferon response, a well-known antiviral defense mechanism. Significantly, hnRNPM-deficient tumors show upregulated interferon-associated pathways and elevated immune cell infiltration. These findings unveil hnRNPM as a guardian of transcriptome integrity by repressing cryptic splicing and suggest that targeting hnRNPM in tumors may be used to trigger an inflammatory immune response, thereby boosting cancer surveillance.

Keywords: ALU; LINE; RNA-binding protein; cancer; cryptic splicing; double-stranded RNA; hnRNPM; interferon response.


Conflict of interest statement

Declaration of interests R.A.F. is a co-founder, board of directors member, and stockholder of GanNA Bio and a board of directors member and stockholder of Chronus Health. H.Y.C. is a co-founder of Accent Therapeutics, Boundless Bio, Cartography Biosciences, and Orbital Therapeutics, an advisor of 10× Genomics, Arsenal Biosciences, Chroma Medicine, and Spring Discovery, and a member of the Molecular Cell advisory board. E.L.V.N. is a co-founder, member of the board of directors, on the SAB, an equity holder, and a paid consultant for Eclipse BioInnovations, on the SAB of RNAConnect, and an inventor of intellectual property owned by University of California, San Diego. E.L.V.N.’s interests have been reviewed and approved by the Baylor College of Medicine in accordance with its conflict-of-interest policies.

Figures
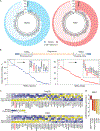
Figure 1:
Figure 1:. hnRNPM preferentially binds to deep introns.
A. RBPs binding distribution in intronic and non-intronic regions. Circular bars indicate percent of RBP binding in intronic and non-intronic regions in HepG2 (n = 72) and K562 (n = 84). Dark shades indicate intronic binding frequency; light shades indicate non-intronic binding frequency. B. RBP binding distribution in deep introns. Upper diagram illustrates deep and proximal introns. Dot plots indicate RBP binding frequency in deep introns. Boxes show top 10 ranked RBPs. C. Heatmaps indicating binding preferences of shared RBPs (n = 47) in HepG2 and K562 cell lines to 5’UTR, exon, 3’UTR, proximal (PROX) intron, and deep intron across pre-mRNA. D. Bars showing hnRNPM binding enrichment across pre-mRNA in HMLE cells. Extended Data for Figures 1A-C: Supplemental Table S1.
Figure 2:
Figure 2:. Loss of hnRNPM results in global cryptic splicing.
A. CryEx workflow used to identify and quantify cryptic splicing from RNA-seq data. Shown in between dashed lines are the criteria to report a cryptic exon event, including number of reads at the exclusion junction (indicated by C) and a percent spliced in (PSI) metric calculated from A, B, C, d, and f. B. Heatmaps showing cryptic exon production is independent of gene expression changes between hnRNPM knockdown (KD, Orange) and non-specific shRNA control (Ctrl, Blue). Left, PSI fold change. Right, fold change of genes containing cryptic exons. C. Representative hnRNPM-repressed cryptic exons. Left, sashimi plots of cryptic splicing events. Numbers of splice junction reads are shown next of arches. Right, semi-qPCR validations. showing agarose gel images (top) and PSI quantifications (bottom). Data is represented as mean ± SEM of at least three biological replicates, *P ≤ 0.05, **P ≤ 0.01, ****P ≤ 0.0001 (unpaired student t test). D. Heatmaps showing PSI values of top 50 representative hnRNPM-repressed cryptic exons identified from HMLE cells in four cell lines (HMLE, LM2, BM2, HeLa) with hnRNPM KD. Cryptic events are ranked from high to low based on ΔPSI values (ΔPSI = PSI{KD} – PSI{Ctrl}) calculated from HMLE RNA-Seq data. Extended Data for Figures 2B and 2D: Supplemental Table S2.
Figure 3:
Figure 3:. hnRNPM binding overlaps with cryptic splice sites at deep intronic LINEs.
A. Violin plot showing length distributions of introns containing hnRNPM-repressed cryptic exons (CryEx, Orange), hnRNPM-regulated alternative exons (AS, Blue), and annotated background exons (Exon, Green) separately. ***P ≤ 0.001 (Wilcoxon rank-sum test). B. Bar plot showing percentage of CryEx, AS, and Exon bound by hnRNPM. Exons with 500bp flanking regions overlapping hnRNPM binding are considered positive. C. Bar plot depicting the percentage of CryEx at proximal and deep introns. D. Metaprofile showing hnRNPM binding in a +/− 2 Kb window flanking the splice sites of CryEx, AS, or Exon. The schematic above metaplot depicts introns (thin lines) and exons with cryptic/alternative exon marked in red and annotated exons marked in blue. E. Weblogo consensus motifs at splice sites of CryEx. Flanking annotated exons are marked in blue. F. Model of hnRNPM-mediated cryptic splicing repression. G-H. Bar plots showing U2AF2 and PRPF8 binding density within 200nt window at 3’ (U2AF, Panel G) and 5’ (PRPF8, Panel H) splice sites of cryptic exons and their flanking exons in Control and hnRNPM KD cells. I-J. Bar plots showing hnRNPM binding enrichment in repeats (I) and LINEs (J) in a +/− 500bp window flanking CryEx. See details in Methods. K. Bar plot showing hnRNPM binding density at intronic LINEs without and with CryEx. L. Bar plot showing hnRNPM binding enrichment at repeats near spliceAI predicted splice sites. See details in Methods. M. Bar plot showing hnRNPM binding enrichment at different LINE subtypes. N. Bar plot depicting the percentage of hnRNPM-bound cryptic exons that contain evolutionarily old or young L1s. O. Example of an hnRNPM-repressed cryptic exon in the INPP4B gene. Top two IGV tracks represent RNA-seq reads aligned in Control shRNA and hnRNPM KD cells. Annotated exons are represented in blue; the cryptic exon is marked in orange. hnRNPM iCLIP binding peaks (Dark Blue) are shown in the third track. LINE elements are depicted as purple boxes below the iCLIP track. Below the LINE track, a snapshot of the Primates Multiz Alignment & Conservation tracks (Green) from UCSC genome browser are shown, which include 6 species, with the first 2 being primates. RefSeq track shows annotated exons (vertical bars) and sequences near spliceAI-predicted 3’ (Pink) and 5’ (Yellow) splice sites indicated by triangles.
Figure 4:
Figure 4:. hnRNPM-repressed cryptic exons form cytoplasmic long stem-like dsRNAs.
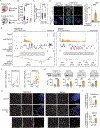
A. Pie charts depicting the percentage of hnRNPM-bound cryptic exons (CryEx) predicted to form dsRNA structures by RNAfold. B. Boxplots showing highest absolute minimum free energy (|MFE|) values for hnRNPM-bound CryEx and alternatively spliced exons (AS). MFE values were calculated using RNAfold. C. Boxplots showing mean A-to-I editing levels of repeat-containing and hnRNPM-bound CryEx in non-specific shRNA control (Ctrl) and hnRNPM knockdown (KD) cells. Numbers of ADAR editing sites are shown at the bottom. Statistics in Panel B-C: ****P ≤ 0.0001 (Wilcoxon rank-sum test). D. Detection of cytoplasmic dsRNA upon hnRNPM KD. Control shRNA (shLuc) and shhnRNPM-expressing HMLE cells were stained for dsRNA (J2, Green); DAPI (Blue) served as a marker for nuclei. Representative images of Control (left), hnRNPM KD (middle), and hnRNPM KD treated with RNAse III (right) cells are shown. Scale bar represents 10 μm. Quantification of cytoplasmic dsRNA signal intensity are shown on the right. Data is represented as mean ± SEM, each data point represents the average cytoplasmic signal of 10–20 cells from three independent biological repeats. ****P ≤ 0.0001 (Ordinary one-way ANOVA). E. Representative examples of dsRNA-forming cryptic exons. Left, TRAPPC10. Right, RBM34. Top two tracks represent RNA-seq reads aligned in Control shRNA and hnRNPM KD cells. hnRNPM iCLIP binding peaks are shown in the third track. Below the iCLIP track shows colored boxes indicating LINE elements (Purple), ALU elements (Green), ALU elements predicted to form dsRNA (Red) and ADAR editing sites (Pink). Seventh track indicates RefSeq annotation. Eighth track represents RNAfold-predicted secondary structure of the cryptic exon. Box indicates the position of a dsRNA fragment whose sequence is depicted above. Approximate lengths of highly base-paired dsRNA regions are indicated together with predicted folding free energies (ΔG). F. Dot plots depicting ADAR editing sites found in predicted dsRNA-forming regions of TRAPPC10 (left) and RBM34 (right) in Control shRNA and hnRNPM KD HMLE cells. G. semi-qRT-PCR validations for cytoplasmic cryptic splicing products showing agarose gel images (top) and PSI quantifications (bottom). Data is represented as mean ± SEM of at least three biological replicates. *P ≤ 0.05, **P ≤ 0.01, ***P ≤ 0.001 (unpaired student t test). H. RNA-FISH images of dsRNA containing cryptic exons (CryEx, Green) and constitutive exons (Exon, Red) for TRAPPC10 (left) and MED15 (right). Nuclei are stained with DAPI; nuclei boundaries are shown as dotted lines. Orange triangles indicate overlapped signals of CryEx and Exon foci. Boxes depict the position of the 3x enlarged inset. Scale bar represents 10 μm. I. Quantification of images in H. Data is represented as mean ± SEM, n = 3, 8 – 25 cells per experiment, ****P ≤ 0.0001(unpaired student t test).
Figure 5:
Figure 5:. Cryptic splicing-produced dsRNA elevates type-I interferon response.
A. Model depicting how hnRNPM KD can trigger a type I interferon response via dsRNA sensing. B-C. GO (B) and GSEA (C) showing top biological processes and pathways positively enriched in hnRNPM KD cells. Immune-related GO terms and pathways are indicated in red. Gene sets related to epithelial characteristics are shown in blue, and other terms are shown in grey. D. Heatmaps showing ISG expression in non-specific shRNA-expressing control (Ctrl) and hnRNPM KD HMLE cells. Relative expression was calculated as mean FPKM fold change versus control. ISGs involved with virus stimulated interferon response are highlighted in red. E. qRT-PCR validations for ISGs highlighted in panel D. Data is normalized to TBP and represented as mean ± SEM, n=10 biological replicates. F. Model illustrating siRNA treatment of dsRNA sensors (DDX58, IFIH1, TLR3) inhibits type I interferon response and overall ISG expression. G. qRT-PCR analyses of ISG expression in Control (shLuc; Blue) and hnRNPM KD (shM; Orange) HMLE cells. Lighter colors represent the ISG expression in cells additionally depleted of the dsRNA sensors DDX58, IFIH1 and TLR3. Data is normalized to TBP and represented as mean ± SEM, n=5 biological replicates. H. qRT-PCR analyses of ISG expression in Control (shLuc; Blue) and hnRNPM KD (shM; Orange) HMLE cells. Lighter colors represent the ISG expression in cells additionally treated for 48–72 hrs with the 2 μM of the JAK inhibitor Ruxolitinib. Data relative to TBP is shown. Data is represented as mean ± SEM, n=7 biological replicates, Statistics in Panel D, G-H: *P ≤ 0.05, **P ≤ 0.01, ****P ≤ 0.0001 (two-tailed paired student’s test).
Figure 6.
Figure 6.. hnRNPM deficiency in cancer patients leads to upregulated immunity and better survival.
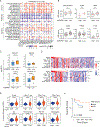
A. Selected MsigDB hallmark gene sets enriched in hnRNPM lowly expressed tumors in TCGA cohorts. Circle size represents gene set enrichment significance (-log10 FDR). Color indicates normalized enrichment score (NES) for each gene set per cancer. B. ISG score distribution between hnRNPM-low and -high tumors across cancers. Scores from ssGSEA analysis of the curated ISG gene signature were computed C. Boxplots of log2-transformed PSI distributions of the four most representative dsRNA-forming cryptic exons between hnRNPM-low (Orange) and - high (Blue) tumors in TCGA basal subtype breast cancer. D. Heatmap showing MED15 cryptic exon inclusion levels across tumors and ssGSEA scores for xCell immune cell signatures. E. Violin plots showing immune infiltration ssGSEA score distributions between low- and high-risk score tumors. F. Kaplan-Meier survival analysis for patients with low- vs high-risk scores. or. P value was calculated using the logrank test. Statistics in Panel B-E: *P ≤ 0.05, **P ≤ 0.01, ***P ≤ 0.001, ****P ≤ 0.0001 (Wilcoxon rank-sum test)

Update of

References

    1. Jo BS, and Choi SS (2015). Introns: The Functional Benefits of Introns in Genomes. Genomics Inform 13, 112–118. 10.5808/GI.2015.13.4.112. - DOI - PMC - PubMed
    1. McCoy MJ, and Fire AZ (2020). Intron and gene size expansion during nervous system evolution. BMC Genomics 21, 360. 10.1186/s12864-020-6760-4. - DOI - PMC - PubMed
    1. Hare MP, and Palumbi SR (2003). High intron sequence conservation across three mammalian orders suggests functional constraints. Mol Biol Evol 20, 969–978. 10.1093/molbev/msg111. - DOI - PubMed
    1. Oggenfuss U, Badet T, Wicker T, Hartmann FE, Singh NK, Abraham L, Karisto P, Vonlanthen T, Mundt C, McDonald BA, and Croll D. (2021). A population-level invasion by transposable elements triggers genome expansion in a fungal pathogen. Elife 10. 10.7554/eLife.69249. - DOI - PMC - PubMed
    1. Gozashti L., Roy SW., Thornlow B., Kramer A., Ares M Jr., and Corbett-Detig R. (2022). Transposable elements drive intron gain in diverse eukaryotes. Proc Natl Acad Sci U S A 119, e2209766119. 10.1073/pnas.2209766119. - DOI - PMC - PubMed

LinkOut - more resources