. 2024 Jun 20;187(13):3262-3283.e23.
doi: 10.1016/j.cell.2024.04.042. Epub 2024 May 29.

RNA quality control factors nucleate Clr4/SUV39H and trigger constitutive heterochromatin assembly

Affiliations

RNA quality control factors nucleate Clr4/SUV39H and trigger constitutive heterochromatin assembly

Jasbeer S Khanduja et al. Cell. .

Abstract

In eukaryotes, the Suv39 family of proteins tri-methylate lysine 9 of histone H3 (H3K9me) to form constitutive heterochromatin. However, how Suv39 proteins are nucleated at heterochromatin is not fully described. In the fission yeast, current models posit that Argonaute1-associated small RNAs (sRNAs) nucleate the sole H3K9 methyltransferase, Clr4/SUV39H, to centromeres. Here, we show that in the absence of all sRNAs and H3K9me, the Mtl1 and Red1 core (MTREC)/PAXT complex nucleates Clr4/SUV39H at a heterochromatic long noncoding RNA (lncRNA) at which the two H3K9 deacetylases, Sir2 and Clr3, also accumulate by distinct mechanisms. Iterative cycles of H3K9 deacetylation and methylation spread Clr4/SUV39H from the nucleation center in an sRNA-independent manner, generating a basal H3K9me state. This is acted upon by the RNAi machinery to augment and amplify the Clr4/H3K9me signal at centromeres to establish heterochromatin. Overall, our data reveal that lncRNAs and RNA quality control factors can nucleate heterochromatin and function as epigenetic silencers in eukaryotes.

Keywords: Clr3; Clr4/SUV39H; H3K9 deacetylation and methylation; MTREC/NURS; Mtl1; Sir2; de novo heterochromatin formation; heterochromatin nucleation; long noncoding RNAs; nuclear exosome.


Conflict of interest statement

Declaration of interests M.M. and J.S.K. have a pending US provisional patent application related to the data from this paper.

Figures

Figure 1.
Figure 1.. Clr4 can be recruited to the pericentromeres de novo in the absence of Ago1 and pre-existing H3K9me
A) Representative graph depicting the 3XFLAG-Clr4 ChIP-seq profile at cen1L. The Clr4 ChIP signal is plotted after subtracting the ChIP signal of the 3XFLAG tag alone (clr4Δ::3xflag). Black rectangles- ChIP-qPCR amplicons; green rectangles-pericentromeric lncRNAs; purple rectangle- gene immediately outside the heterochromatin region. The outer repeats dg/dh and the innermost repeat imr1L regions of cen1L are also shown (n=3). B) Graph depicting 3XFLAG-Clr4 ChIP-qPCR mean fold change (percent input) at a representative pericentromeric repetitive lncRNA, SPNCRNA.230, normalized to wild type. Error bars-S.D.; n=4. C) Representative graph depicting the H3K9me2 ChIP-seq profile at cen1L. The H3K9me2 signal is plotted after subtracting the ChIP signal in clr4Δ::3xflag strain. ChIP-qPCR amplicons and cen ncRNAs are shown in the same format as panel A. (n=3) D and E) Graphs depicting H3K9me2 ChIP-qPCR at SPNCRNA.230 (D) and a dg sequence (E). Mean fold change (percent input) normalized to wild type is plotted. Error bars-S.D.; n=4. Outliers from the data set were removed using Grubbs method in GraphPad Prism 8.3.0 In panels B, D and E, statistical significance was determined using a two-tailed unpaired Student’s t-test. Not significant (ns) p>0.05; *p<0.05; **p<0.01 § indicates strains in which clr4+ was reintroduced by yeast genetic crosses. See also Data S1
Figure 2.
Figure 2.. Clr4 localizes to SPNCRNA.230 in the absence of Ago1 and H3K9me
A) Representative graph depicting the FLAG-Clr4 ChIP-seq profile at cen1L in the indicated strains. The Clr4 ChIP signal is plotted after subtracting the ChIP signal of the 3XFLAG tag alone (clr4Δ::3xflag). Bottom panel- RNA-seq profile for representative transcripts arising from sense (+ve) and antisense (-ve) strand of pericentromeric repeats in a clr4Δ strain. Black rectangle- ChIP-qPCR amplicon; green rectangles-pericentromeric ncRNAs; purple rectangle- gene immediately outside the heterochromatin region. (n=3). B) Graph depicting 3XFLAG-Clr4 ChIP-qPCR (mean percent input) at SPNCRNA.230 in the indicated strains. Error bars-S.D.; n=5. Outliers from the data set were removed using Grubbs method in GraphPad Prism 8.3.0 C) A representative Western blot depicting time-course H3K9 deacetylation activity of recombinant NusA-Clr3 on H3K9Ac peptide substrate. Recombinant NusA-Clr3.D232N (catalytically inactive) and H3K14Ac peptides were used as negative and positive controls, respectively. Streptavidin-HRP probing of biotinylated H3K9Ac and H3K14Ac peptide blots show substrate loading (n=3). See Data S1 for original blots. D) Graph depicting H3K9me2 ChIP-qPCR mean fold change (percent input) in the indicated mutant strains normalized to wild-type, which was set to 1.0. Error bars-S.D.; n=3. E) Graph depicting the steady-state level of a heterochromatic transcript from the dg region of pericentromeres in the indicated strains. Transcript level was normalized to act1 and mean fold change over wild-type is plotted. Error bars-S.D.; n=3. F) Representative graph depicting the 3XFLAG-Clr4 ChIP-seq profile at cen1L. The Clr4 ChIP signal is plotted after subtracting the ChIP signal of the 3XFLAG tag alone (clr4Δ::3xflag). RNA-seq profile, ChIP-qPCR amplicon and cen ncRNAs are shown in the same format as panel A. (n=3) G) Graph depicting 3XFLAG-Clr4 ChIP-qPCR (mean percent input) at SPNCRNA.230. Error bars-S.D.; n=4. H) Graph depicting 3XFLAG-Clr4 ChIP-qPCR (mean percent input) at SPNCRNA.230 in the indicated strains. ‘sir2Δ clr3Δ clr4Δclr4+’ denotes a sir2Δ clr3Δ ago1Δ clr4Δ strain into which clr4+ was reintroduced by transformation. The 3XFLAG-Clr4 ChIP-qPCR signals were normalized to the S. cerevisiae SIR3–3XFLAG signal of the spike-in control. Error bars-S.D.; n=4. In panels B, D, E, G and H, statistical significance was determined using a two-tailed unpaired Student’s t-test. ns p>0.05; *p<0.05; **p<0.01; ***p<0.001; ****p<0.0001 See also Figures S1, S2 and Data S1
Figure 3.
Figure 3.. H3K9 deacetylases (Sir2 and Clr3) can be recruited to pericentromeric regions, including SPNCRNA.230, in the absence of H3K9me and sRNAs.
A) Graph depicting Clr3–3XFLAG ChIP-qPCR at SPNCRNA.230, dh, and dg sequences. Mean fold change (percent input) normalized to clr3Δ::3xflag background control is plotted. Error bars-S.D.; n=3. B) Table showing total spectral counts of selected proteins that co-purified with Sir2-MYC as determined by LC-MS/MS. (n=3). These purifications were performed from purified intact yeast nuclei (See Methods for details). See Table S3 for list of proteins. C) Representative western blots showing reciprocal co-immunoprecipitation (co-IP) of Sir2 with Cdc20 and Cdc6 from S-phase cells (lanes 1–5 and 7) synchronized by HU block and release or asynchronous cells (lanes 6 and 8; shown in red). (n=3). See Data S1 for original blots. D) Representative western blots showing co-IP of Sir2 with Mcm3 and Mcm7 from S-phase cells (lanes 1–3 and 5) synchronized by HU block and release or asynchronous cells (lanes 4 and 6; shown in red). (n=3). See Data S1 for original blots. E) Representative graph depicting the Sir2–3XFLAG ChIP-seq profile at pericentromere 3R (cen3R) at different time points after cells are released from HU block. Sir2 ChIP enrichment over the inputs is plotted. Magenta vertical lines-replication origins in the pericentromeric repeats; Green rectangles- pericentromeric lncRNAs; blue rectangles-genes immediately outside the heterochromatin region; CC- central core region. Select S-phase samples are depicted in red text. (n=3). F and G) Graph depicting Sir2–3XFLAG ChIP-qPCR (mean percent input) at SPNCRNA.230 (F) and a dh sequence (G) from S-phase cells synchronized by HU block and release and asynchronous cells (Unsync). sir2Δ::3xflag was used as FLAG background control. The Sir2-FLAG ChIP-qPCR signals in the indicated strains were normalized to the S. cerevisiae SIR3–3XFLAG signal of the spike-in control. Error bars-S.D.; n=3 biological replicates. H and I) Graph depicting Sir2–3XFLAG ChIP-qPCR at SPNCRNA.230 (H) and a dg sequence (I) from S-phase cells synchronized by HU block and release. Mean fold change (percent input) normalized to sir2Δ::3xflag control is plotted. Error bars-S.D.; n=3. In panels A, and F-I, statistical significance was determined using a two-tailed unpaired Student’s t-test. ns p>0.05; *p<0.05; **p<0.01; ***p<0.001; ****p<0.0001 See also Figure S3, Table S3
Figure 4.
Figure 4.. Sir2 and Clr3 work in parallel pathways with Clr4 for de novo H3K9 methylation and Clr4 spreading.
A-B) Graphs depicting H3K9me2 ChIP-qPCR at SPNCRNA.230 (A) and a dh sequence (B). Mean fold change (percent input) normalized to wild-type is plotted. Error bars-S.D.; n=3. C-D) Graphs depicting the steady-state level of SPNCRNA.230 (C) and a dh lncRNA (D). Transcript level was normalized to act1 and mean fold change over wild-type is plotted. Error bars-S.D.; n=3. E-I) Graphs depicting 3XFLAG-Clr4 ChIP-qPCR (mean percent input) at SPNCRNA.230 (E), SPNCRNA.3677 (F), 174 bp downstream from the annotated end (on the sense strand) of SPNCRNA.230 (G), dh (H), and dg (I) sequences. clr4Δ::3xflag was used as background control. The 3XFLAG-Clr4 ChIP-qPCR signals were normalized to the S. cerevisiae SIR3–3XFLAG signal of the spike-in control. Error bars-S.D.; n=4. J) Graphs depicting the SIR3–3XFLAG ChIP-qPCR mean fold change (percent input) at the TEL X element found in the S. cerevisiae telomeres. The specific SIR3 enrichment at the TEL X element was calculated relative to the SIR3 signal at the control euchromatic CUP1 gene. The telomeric TEL X element and CUP1 gene primers do not show significant homology to the S. pombe genome. Error bars-S.D.; n=4. ^- indicates catalytically inactive version of clr4 (clr4.H410D.C412A) § indicates strain in which clr4+ was reintroduced by yeast genetic crosses. # indicates strain in which clr4.H410D.C412A allele was introduced by yeast genetic crosses. For panels A-I, statistical significance was determined using a two-tailed unpaired Student’s t-test. For panel J, Statistical significance was determined using ordinary one-way ANOVA with multiple comparisons. ns p>0.05; *p<0.05; **p<0.01; ***p<0.001; ****p<0.0001 The data for clr4Δ::3xflag, wild-type, and ago1Δ controls in panels F and J also have been used in Figure S2L and S2M, respectively. See also Figure S4
Figure 5.
Figure 5.. SPNCRNA.230 is sufficient to recruit Clr4 and together with RNAi triggers heterochromatic silencing at an ectopic site.
A) Schematic showing where SPNCRNA.230 was integrated in euchromatin by replacing ade6 (ade6::SPNCRNA.230). P and P’ represent 267 bp sequences upstream and downstream of the annotated SPNCRNA.230 gene. B1 and B2 represent the unique barcodes inserted into the ade6::SPNCRNA.230. Black arrows show the direction of transcription of ade6::SPNCRNA.230 and adjacent genes. Red arrows indicate the position of primers used in ChIP-qPCR and RT-qPCR assays. B) Graph depicting the 3XFLAG-Clr4 ChIP-seq profile at ade6::SPNCRNA.230 and adjacent regions. Sequences unique to ade6::SPNCRNA.230 (B1- and B2-containing sequences and SPNCRNA.230-bub1 and SPNCRNA.230-vtc4 hybrid sequences) are shown. The specific 3XFLAG-Clr4 signal was obtained by subtracting the signal in clr4Δ::3xflag strain. (n=3) C and D) Graphs depicting the steady-state ade6::SPNCRNA.230 (C) and bub1 (D) RNA levels in the indicated ade6::SPNCRNA.230 strains. Transcript levels were normalized to act1 and mean fold change relative to clr4Δ::3xflag control or wild type is plotted. Error bars-S.D.; n=3. E and F) Graph depicting 3XFLAG-Clr4 ChIP-qPCR at SPNCRNA.230 (E) and bub1 (F). Mean fold change (percent input) normalized to wild type is plotted. clr4Δ::3xflag strain was used as the FLAG background control. Error bars-S.D.; n=3. G-J) Graphs depicting 3XFLAG-Clr4 ChIP-qPCR at SPNCRNA.230 (G), ade6::SPNCRNA.230 (H), bub1 (I) and vtc4 (J). Genetic crosses were used to re-introduce clr4+ (1st) and then ago1+ (2nd) in the clr4Δ ago1Δ strain. The results of three independent clones are shown. Mean percent input is plotted. Error bars-S.D.; n=3. K-N) Graphs depicting the steady-state SPNCRNA.230 (K), ade6::SPNCRNA.230 (L), bub1 (M) and vtc4 (N) RNA levels in the indicated ade6::SPNCRNA.230 strains. Genetic crosses were used to re-introduce clr4+ (1st) and then ago1+ (2nd) in the clr4Δ ago1Δ strain. The result of one clone is shown. Transcript levels were normalized to act1 and mean fold change relative to wildtype is plotted. Error bars-S.D.; n=3. In panels C-N, statistical significance was determined using a two-tailed unpaired Student’s t-test. ns p>0.05; *p<0.05; **p<0.01; ***p<0.001; ****p<0.0001
Figure 6.
Figure 6.. MTREC/Exosome recruits Clr4 to SPNCRNA.230 and works in parallel to Ago1 for Clr4 recruitment to pericentromeres.
A-B) Graphs depicting 3XFLAG-Clr4 ChIP-qPCR (mean percent input) at SPNCRNA.230. Error bars-S.D.; n=3. C) Heat map depicting log10 transformed normalized spectral abundance factor (NSAF) values of selected proteins that copurified with FLAG-Clr4 from the indicated strains as determined by LC-MS/MS. Wild type (n=1); H3K9R ago1Δ (n=3); H3K9R ago1Δ rik1ΔC (n=3). These values were normalized to untagged control. See Table S5 for list of proteins. D-F) Graphs depicting FLAG-Clr4 ChIP-qPCR (mean percent input) at SPNCRNA.230. Error bars-S.D.; n=4 (panel D) or 3 (panel E and F). The data for clr4Δ::3xflag and wild-type strains in panel E has also been used in panel F. In panels A, B, and D-F, statistical significance was determined using a two-tailed unpaired Student’s t-test. ns p>0.05; *p<0.05; **p<0.01; ***p<0.001; ****p<0.0001 See also Figures S5 and S6, and Tables S5 and S6
Figure 7.
Figure 7.. Mmi1 together with the ATPase activity of the RNA helicase Mtl1 are required for Clr4 recruitment to SPNCRNA.230 in the absence of H3K9me and sRNAs.
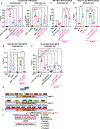
A and B) Graphs depicting FLAG-Clr4 ChIP-qPCR (mean percent input) at SPNCRNA.230. Error bars-S.D.; n=3 (panel A) or 4 (panel B) biological replicates. The data for clr4Δ::3xflag, wild-type, ago1Δ and H3K9R ago1Δ controls in panel A have been used in Figure S6L. Also, the data for clr4Δ::3xflag, wild-type, and H3K9R ago1Δ controls in panel B have been used in Figure S6K. C) Graph depicting Mtl1–13XMYC RIP RT-qPCR (mean percent input) at SPNCRNA.230. Error bars-S.D.; n=4. D) Graph depicting Red1–3XFLAG RIP RT-qPCR (mean percent input) at SPNCRNA.230. Error bars-S.D.; n=4. E) Graph depicting Red1–3XFLAG ChIP-qPCR (mean percent input) at SPNCRNA.230. Error bars-S.D.; n=4. F) Graph depicting 3XFLAG-Clr4 ChIP-qPCR (mean percent input) at SPNCRNA.230. Error bars-S.D.; n=4. G) Model for stepwise assembly of heterochromatin at pericentromeres of S. pombe (1) In the absence of Ago1 and pre-existing H3K9me, MTREC/NURS complex recruits Clr4 to SPNCRNA.230 lncRNA. Clr3 and Sir2 also are recruited to SPNCRNA.230, thus amassing H3K9 deacetylases and methyltransferase at this region. (2) Following deposition of H3K9Ac nucleosomes during DNA replication, Sir2 and Clr3 deacetylate H3K9Ac, generating the substrate (unmodified H3K9) for methylation by Clr4. Clr4-mediated H3K9 methylation leads to its spreading in cis via its read-write activities. (3) sRNAs recruit more Clr4, leading to synergistic amplification of H3K9me and sRNAs, establishing silencing by recruiting TGS and PTGS complexes. In panels A-F, statistical significance was determined using a two-tailed unpaired Student’s t-test. ns p>0.05; *p<0.05; **p<0.01; ***p<0.001; ****p<0.0001 See also Figure S7 and Data S1

References

    1. Allshire RC, and Madhani HD (2018). Ten principles of heterochromatin formation and function. Nat Rev Mol Cell Biol 19, 229–244. 10.1038/nrm.2017.119. - DOI - PMC - PubMed
    1. Rea S, Eisenhaber F, O’Carroll D, Strahl BD, Sun ZW, Schmid M, Opravil S, Mechtler K, Ponting CP, Allis CD, and Jenuwein T (2000). Regulation of chromatin structure by site-specific histone H3 methyltransferases. Nature 406, 593–599. - PubMed
    1. Bannister AJ, Zegerman P, Partridge JF, Miska EA, Thomas JO, Allshire RC, and Kouzarides T (2001). Selective recognition of methylated lysine 9 on histone H3 by the HP1 chromo domain. Nature 410, 120–124. - PubMed
    1. Motamedi MR, Hong EJ, Li X, Gerber S, Denison C, Gygi S, and Moazed D (2008). HP1 proteins form distinct complexes and mediate heterochromatic gene silencing by nonoverlapping mechanisms. Mol Cell 32, 778–790. 10.1016/j.molcel.2008.10.026. - DOI - PMC - PubMed
    1. Moazed D, Rudner AD, Huang J, Hoppe GJ, and Tanny JC (2004). A model for step-wise assembly of heterochromatin in yeast. Novartis Found Symp 259, 48–56; discussion 56–62, 163–169. - PubMed

MeSH terms

LinkOut - more resources