. 2024 Oct;13(27):e2401603.
doi: 10.1002/adhm.202401603. Epub 2024 Jun 8.

A 3D Bioprinted Cortical Organoid Platform for Modeling Human Brain Development

Affiliations

A 3D Bioprinted Cortical Organoid Platform for Modeling Human Brain Development

Melissa A Cadena et al. Adv Healthc Mater. 2024 Oct.

Abstract

The ability to promote three-dimensional (3D) self-organization of induced pluripotent stem cells into complex tissue structures called organoids presents new opportunities for the field of developmental biology. Brain organoids have been used to investigate principles of neurodevelopment and neuropsychiatric disorders and serve as a drug screening and discovery platform. However, brain organoid cultures are currently limited by a lacking ability to precisely control their extracellular environment. Here, this work employs 3D bioprinting to generate a high-throughput, tunable, and reproducible scaffold for controlling organoid development and patterning. Additionally, this approach supports the coculture of organoids and vascular cells in a custom architecture containing interconnected endothelialized channels. Printing fidelity and mechanical assessments confirm that fabricated scaffolds closely match intended design features and exhibit stiffness values reflective of the developing human brain. Using organoid growth, viability, cytoarchitecture, proliferation, and transcriptomic benchmarks, this work finds that organoids cultured within the bioprinted scaffold long-term are healthy and have expected neuroectodermal differentiation. Lastly, this work confirms that the endothelial cells (ECs) in printed channel structures can migrate toward and infiltrate into the embedded organoids. This work demonstrates a tunable 3D culturing platform that can be used to create more complex and accurate models of human brain development and underlying diseases.

Keywords: 3D bioprinting; brain organoids; extracellular matrix; induced pluripotent stem cells; vasculature.


Conflict of interest statement

The authors declare no conflict of interest.

Figures

Figure 1
Figure 1
Schematic illustration of the study workflow. A) Three‐dimensional (3D) embedded bioprinting process of gelatin methacrylate (GelMA) into a support hydrogel. B) GelMA scaffold design consisting of a network of interconnected channels on the lateral side to incorporate vasculature and a top channel to manually load organoids into the scaffold. C) 3D embedded bioprinting, where GelMA (blue) is extruded from the printing needle into Carbopol (clear), the support hydrogel. Scale bar, 5 mm. D) Workflow to encapsulate and culture organoids in the bioprinted scaffold. 1) Organoids are manually loaded through the top channel, followed by GelMA casting and UV cross‐linking. 2) Following UV cross‐linking, the top channel is sealed, and organoids can be cultured. Readouts include assessing growth, viability, architecture, and transcriptomics. E) Bioprinted GelMA scaffold containing an encapsulated organoid, immediately after loading. Scale bar, 1 mm. F) Workflow to coculture endothelial cells (ECs) and cortical organoids. Human umbilical vein endothelial cells (HUVECs) are manually seeded through the top and side channels to achieve uniform endothelialization. Following 5 days of HUVEC culture, organoids are loaded through the top channel, GelMA is cast and UV cross‐linked, thus beginning the EC‐organoid coculture. Readouts include HUVEC coverage of the side channels and HUVEC infiltration into the organoid. Schematics created with BioRender.com.
Figure 2
Figure 2
Characterization of printing fidelity, porosity, and mechanical properties of bioprinted scaffolds. A) Schematic depicting the high throughput capabilities of embedded 3D bioprinting, where 16 scaffolds can be printed in 90 min. B) Cross‐linked gelatin methacrylate (GelMA) scaffolds, following high throughput Three‐dimensional (3D) bioprinting (n = 16 scaffolds). Scale bar, 5 mm. C) Designed and D) printed two‐layer model used to assess 2D bioprinting fidelity. Scale bars, 1 mm (left) and 250 µm (right). E) Printing fidelity characterization of the strand diameter (D), interstrand angle (α), and interstrand area (A) for two‐layer model (n = 9 prints, 27 measurements). The mean and standard deviations for the strand fidelity ratios are 0.96 ± 0.05 (D), 1.02 ± 0.04 (α), and 1.02 ± 0.06 (A). F) Designed and printed GelMA scaffolds, highlighting the top channel (left) and side channel (right). Scale bar, 1 mm. G) Bulk fidelity characterization of the length (l), height (h), top channel diameter (D TC), and side channel diameter (D SC) of microchanneled GelMA scaffold (n = 12 scaffolds). The mean and standard deviations for the bulk fidelity ratios are 0.98 ± 0.03 (l), 0.99 ± 0.05 (h), 0.72 ± 0.03 (D TC), and 1.04 ± 0.18 (D SC). H) Scanning electron microscopy (SEM) of the microchanneled GelMA scaffolds. The side channels (top row), the sagittal view of the scaffold (bottom row), and magnified view of the middle of the scaffold (inset) are shown. Scale bar represents 1 mm for the low magnification images and 100 µm for the inset. I) Pore size quantification of GelMA microchanneled construct (n = 4 scaffolds, 60 measurements per scaffold). Gaussian distribution fit to the histogram of the pore size. Median = 80.46 µm, mean = 82.79 µm, SD = 27.57 µm. J) Quantification of the aspect ratio of the pores within the microchanneled scaffold (n = 4 scaffolds, 20 measurements/scaffold). Mean = 2.00, SD = 1.01. Data represents mean ± SD. K) Mechanical testing workflow where a microindentation probe is used to measure the elastic modulus of the top and bottom surfaces of the scaffold. Scaffolds are then cut in half and the elastic moduli of the side channels and central cavity are assessed. Scale bar, 5 mm. L) Elastic modulus of the top, bottom, side channel, and central cavity of cross‐linked GelMA scaffolds (n = 4 scaffolds). Elastic modulus values are 7.03 ± 0.42 kPa (top), 7.69 ± 0.53 kPa (bottom), 8.09 ± 0.67 kPa (side channels), and 9.42 ± 0.84 kPa (center cavity). All error bars represent ± standard error of the mean (SEM). No significant difference in elastic modulus of different areas of the microchanneled scaffold (one‐way analysis of variance (ANOVA) with Tukey's multiple comparisons test), p = 0.1757. Created in part with BioRender.com.
Figure 3
Figure 3
Assessment of the growth, viability, cytoarchitecture, and proliferation of embedded organoids compared to suspended controls. A) Schematic depicting study workflow. Day 20–25 organoids are manually embedded at a timepoint considered “days in scaffold” (DIS 0). Scaffolds are then cultured for 30 or 60 days. Asterisk (*) indicates that the assay was only performed on one differentiation per hiPSC line used, for a total of two lines. Scale bar, 1 mm. B) Quantification of organoid growth over 60 days of culture (n = 5–6 organoids per condition). Two‐way analysis of variance (ANOVA) performed with Tukey's multiple comparisons test reveals a significant size difference between suspended and embedded organoids only at DIS 6 (p = 0.044), validating that embedded organoids grow comparably to the suspended control. Error bars represent ± standard error of the mean (SEM). C) Live (calcein‐AM) and dead (ethidium homodimer‐1) quantification of dissociated suspended and embedded organoids at DIS 30 and 60. Scale bars, 100 µm. D) Quantification of the percentage of live cells at DIS 30 and DIS 60 across both cell lines. A total of n = 6 samples per condition were used for both cell lines at DIS 30. For DIS 60, n = 4 samples per condition used for line 1 and n = 6 samples per condition used for line 2. The percentage of live cell at DIS 30 are 89.74 ± 4.39% (line 1) and 87.31 ± 3.58% (line 2) for embedded samples, and 91.10 ± 1.79% (line 1) and 84.12 ± 3.06% (line 2) for suspended samples. The percentage of live cells at DIS 60 are at 86.70 ± 5.20% (line 1) and 93.37 ± 2.89% (line 2) for embedded samples, and 80.82 ± 8.23% (line 1) and 89.86 ± 1.35% (line 2) for suspended samples. Error bars represent ± SD. Two‐way ANOVA with Sidak's multiple comparisons test no significant difference in cell viability between suspended and embedded samples (DIS 30: line 1, p = 0.7370, line 2, p = 0.2131; DIS 60: line 1, p = 0.1918, line 2, p = 0.3935). E) IHC of suspended and embedded organoids reveals no difference in overall organoid cytoarchitecture. The stains are DAPI (blue), PAX6 (green), and Nestin (magenta). Scale bars are 200 and 50 µm (magnified images). F) Immunohistochemistry (IHC) on sections of suspended and embedded organoids exposed to a 48‐h pulse of EdU. Stains represent DAPI (blue) and EdU (magenta). Scale bar, 50 µm. G) Quantification of the percentage of EdU positive cells normalized to the number of DAPI cells. A total of n = 4 samples per condition per cell line were used. A two‐way ANOVA with Sidak's multiple comparisons test was used and demonstrates no significant difference in the percentage of EdU cells between the two culture conditions (line 1: p = 0.4784, line 2: p = 0.4163). Error bars represent ± SEM. * p < 0.05, ** p < 0.01, *** p < 0.001. Schematics created with BioRender.com.
Figure 4
Figure 4
Transcriptomic assessment of embedded and suspended organoids at “days in scaffold” (DIS 30). A) Schematic depicting the RNA‐seq sample collection timeline. A total of n = 60 samples were sequenced at DIS 30 (n = 28 embedded samples, n = 28 suspended samples, n = 4 Matrigel embedded samples) and n = 9 suspended and n = 9 embedded samples were sequenced at DIS 60. DIS 30 samples include organoids from three different hiPSC lines and three different differentiations that are pooled together for analyses. DIS 60 samples include organoids from two different hiPSC lines that are pooled together for analyses. B) Normalized counts of suspended and embedded samples at DIS 30 reveals that there is a correlation in gene expression across the two culture conditions (R 2 = 0.92). C) Comparison of the expression (normalized counts) of different neuroectodermal related genes. * p_adjusted < 0.05, ** p_adjusted < 0.01, *** p_adjusted < 0.001. Significance determined by edgeR and Bonferroni correction. Error bars represent ± standard error of the mean (SEM). D) Normalized counts of neuronal maturation genes, EOMES and TBR1, and E) synaptic maturation genes, GRIN1 and SNAP25 from DIS 30 to DIS 60. GRIN1 is upregulated in embedded DIS 60 samples according to differential expression analysis (p < 0.001). Error bars represent ± SEM. F) Principal component analysis (PCA) reveals that the primary variation is a result of culture condition (PC1 = 35.7%), followed by cell line (PC2 = 24.7%). G) Volcano plot highlighting the upregulated genes in the suspended and embedded samples. Cutoffs are logFC ± 1 and adjusted p value < 0.01. H) Heatmap demonstrating the differentially expressed genes and highlighting genes involved in matrix remodeling, noradrenergic signaling, neurogenesis, extracellular matrix (ECM) components, and cell division. I) Gene ontology (GO) analysis using upregulated genes for suspended and embedded samples. Schematics created with BioRender.com.
Figure 5
Figure 5
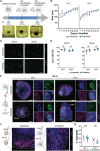
Coculture of human umbilical vein endothelial cells (HUVECs) and cortical organoids within microchanneled gelatin methacrylate (GelMA) scaffolds. A) Schematic of the coculture workflow. GelMA microchanneled scaffolds are coated with gelatin for 24 h and then seeded with HUVECs. HUVECs are cultured for 5 days and then day 25–30 organoids are manually loaded through the top channel “days in scaffold” (DIS 0). Scaffolds are then cultured for up to 4 weeks (DIS 28). B) HUVEC only scaffolds are sectioned coronally to observe the coverage of the microchannels. There is an increase in HUVEC coverage of the microchannel from DIS 7 to DIS 28, shown by DAPI (blue), GFP (green), and Lectin (magenta). The white dashed line depicts the channel wall. Scale bar, 100 µm. C) Whole mount imaging of DIS 35 HUVEC only bioprinted scaffolds, preserving the four interconnected side channels, demonstrating almost complete coverage of the microchanneled surface. The stains are DAPI (blue), GFP (green), and Lectin (magenta). Channel walls are highlighted by the dashed white lines. Scale bar, 1000 µm. D) Immunohistochemistry (IHC) of cocultured organoids, which reveals progressive HUVEC infiltration into the organoid. Organoids are manually removed from the scaffold, sectioned, and stained with DAPI (blue), GFP (green), and TUJ1 (magenta). Scale bars are 200 µm for the first two columns and 50 µm for the magnified third column. Quantification of E) HUVEC infiltration depth into the organoid and F) HUVEC area fraction following 7, 14, or 28 days of coculture. Stained sections from two cell lines are pooled and analyzed. A total of n = 5 samples per time point were used. One‐way analysis of variance (ANOVA) with Tukey's multiple comparisons test demonstrates a significant difference in HUVEC infiltration depth (p = 0.0005) and area coverage (p = 0.0004) from DIS 7 to DIS 28. * p < 0.05, ** p < 0.01, *** p < 0.001. All error bars represent ± standard error of the mean (SEM). G) Uniform Manifold Approximation and Projection (UMAP) plot of scRNAseq data from embedded only organoids (n = 7 scaffolds, 5839 cells), HUVEC monoculture (9825 cells), and embedded organoids cultured with HUVECs (n = 12 scaffolds, 8735 cells) for a total of 24 399 cells. One hiPSC line was used. H) Cell type specific clusters, depicted by ICAM2 (ECs) and STMN2 (neural lineage). I) UMAP of reclusterd EC (n = 13 382 cells), revealing a separation based on the presence or absence of human cortical organoids (hCOs). J) Differential gene expression (DGE) demonstrates a shift toward cerebral vascular identity in HUVECs cultured with hCOs compared to monoculture HUVECs and increased expression of the blood–brain barrier (BBB) specific marker TNFRSF19. Schematics created with BioRender.com.

References

    1. Lancaster M. A., Renner M., Martin C. A., Wenzel D., Bicknell L. S., Hurles M. E., Homfray T., Penninger J. M., Jackson A. P., Knoblich J. A., Nature 2013, 501, 373. - PMC - PubMed
    1. Sloan S. A., Darmanis S., Huber N., Khan T. A., Birey F., Caneda C., Reimer R., Quake S. R., Barres B. A., Paşca S. P., Neuron 2017, 95, 779. - PMC - PubMed
    1. Sloan S. A., Andersen J., Pasca A. M., Birey F., Pasca S. P., Nat. Protoc. 2018, 13, 2062. - PMC - PubMed
    1. Qian X., Nguyen H. N., Song M. M., Hadiono C., Ogden S. C., Hammack C., Yao B., Hamersky G. R., Jacob F., Zhong C., Yoon K. J., Jeang W., Lin L., Li Y., Thakor J., Berg D. A., Zhang C., Kang E., Chickering M., Nauen D., Ho C. Y., Wen Z., Christian K. M., Shi P. Y., Maher B. J., Wu H., Jin P., Tang H., Song H., Ming G. L., Cell 2016, 165, 1238. - PMC - PubMed
    1. Pasca A. M., Sloan S. A., Clarke L. E., Tian Y., Makinson C. D., Huber N., Kim C. H., Park J. Y., O'Rourke N. A., Nguyen K. D., Smith S. J., Huguenard J. R., Geschwind D. H., Barres B. A., Pasca S. P., Nat. Methods 2015, 12, 671. - PMC - PubMed

MeSH terms

LinkOut - more resources