. 2024 May 30;15(1):4616.
doi: 10.1038/s41467-024-48214-3.

Rapid P-TEFb-dependent transcriptional reorganization underpins the glioma adaptive response to radiotherapy

Affiliations

Rapid P-TEFb-dependent transcriptional reorganization underpins the glioma adaptive response to radiotherapy

Faye M Walker et al. Nat Commun. .

Abstract

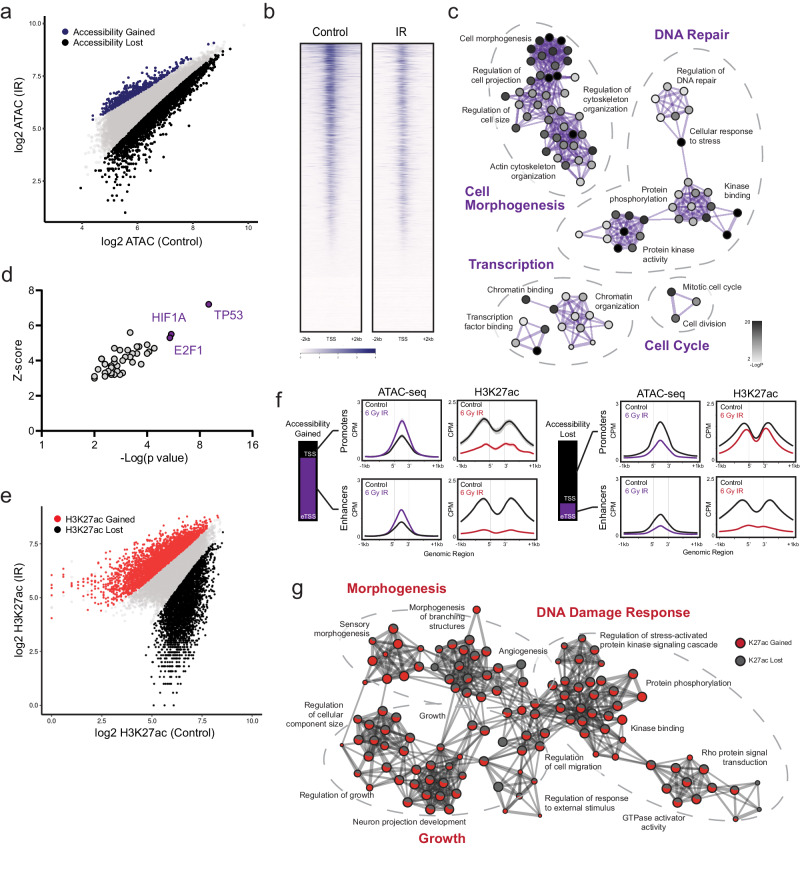
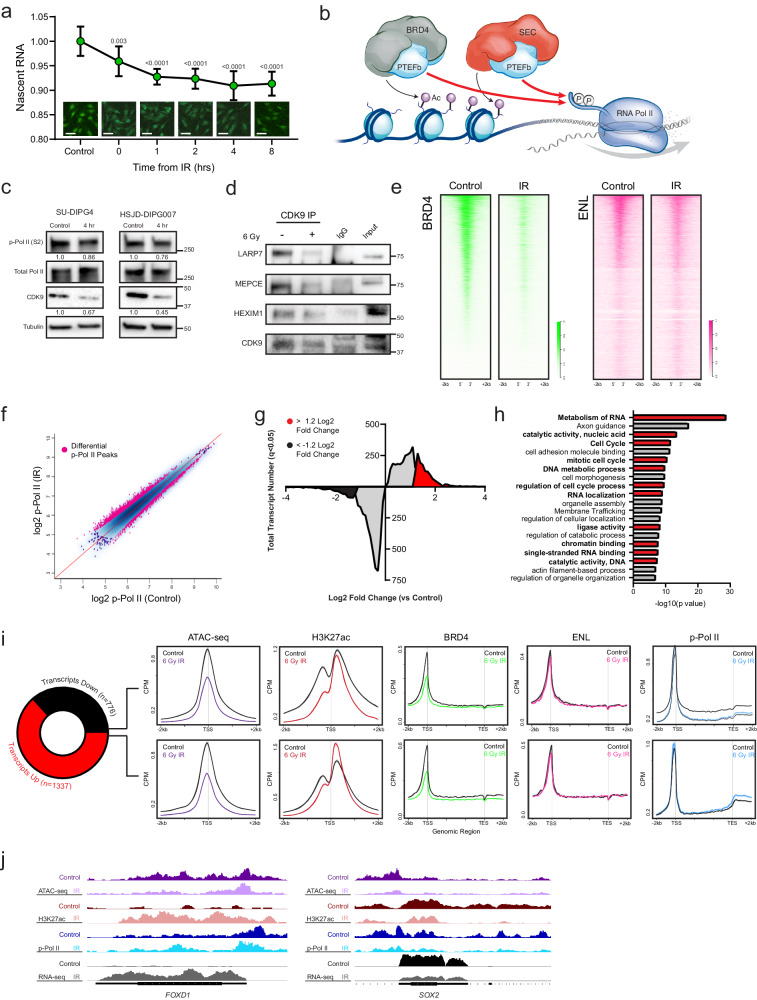
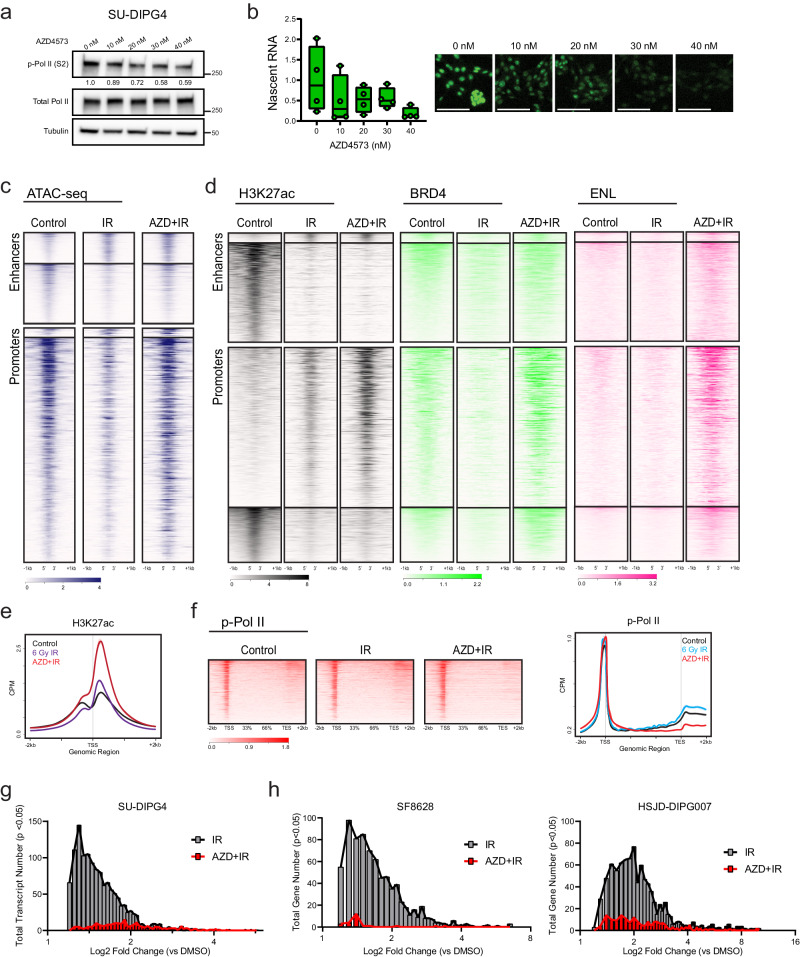
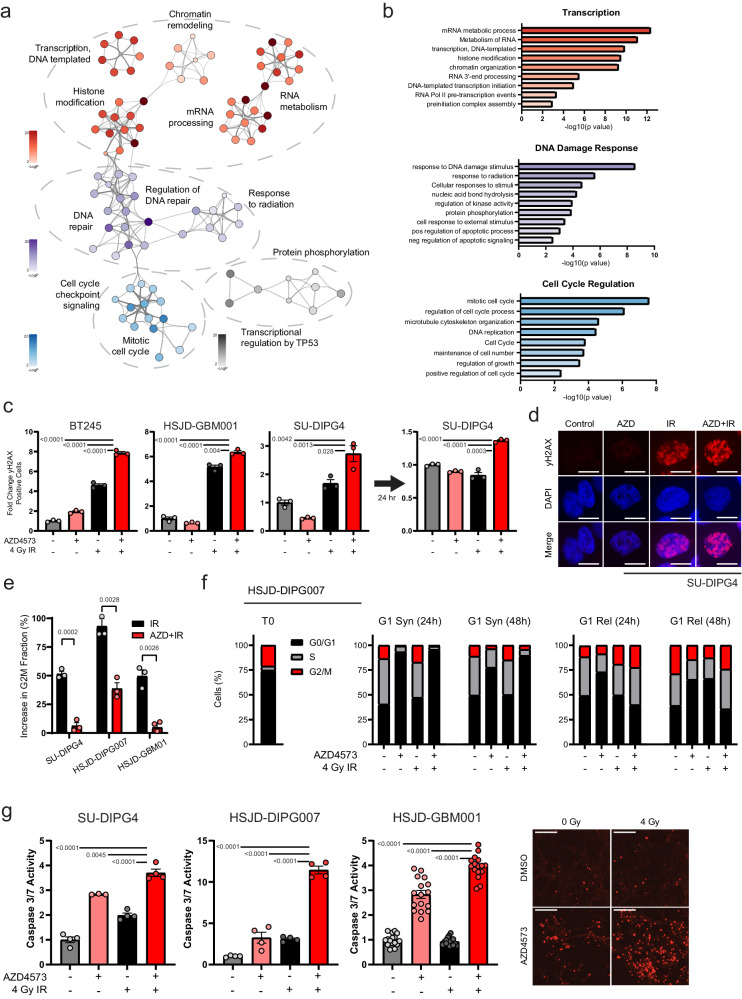
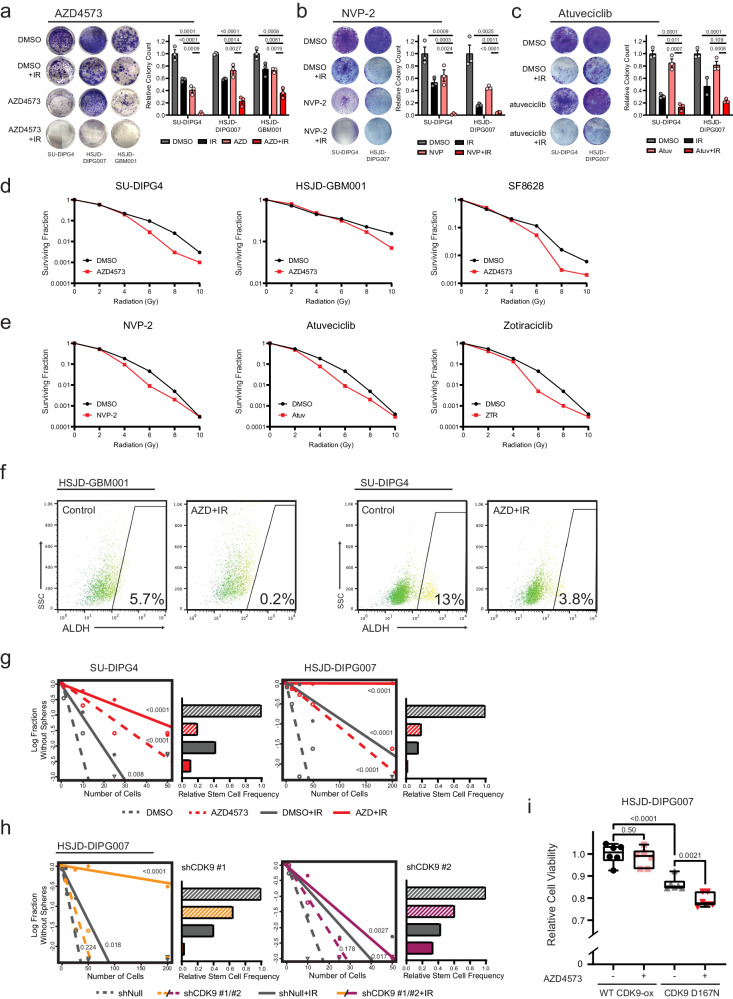
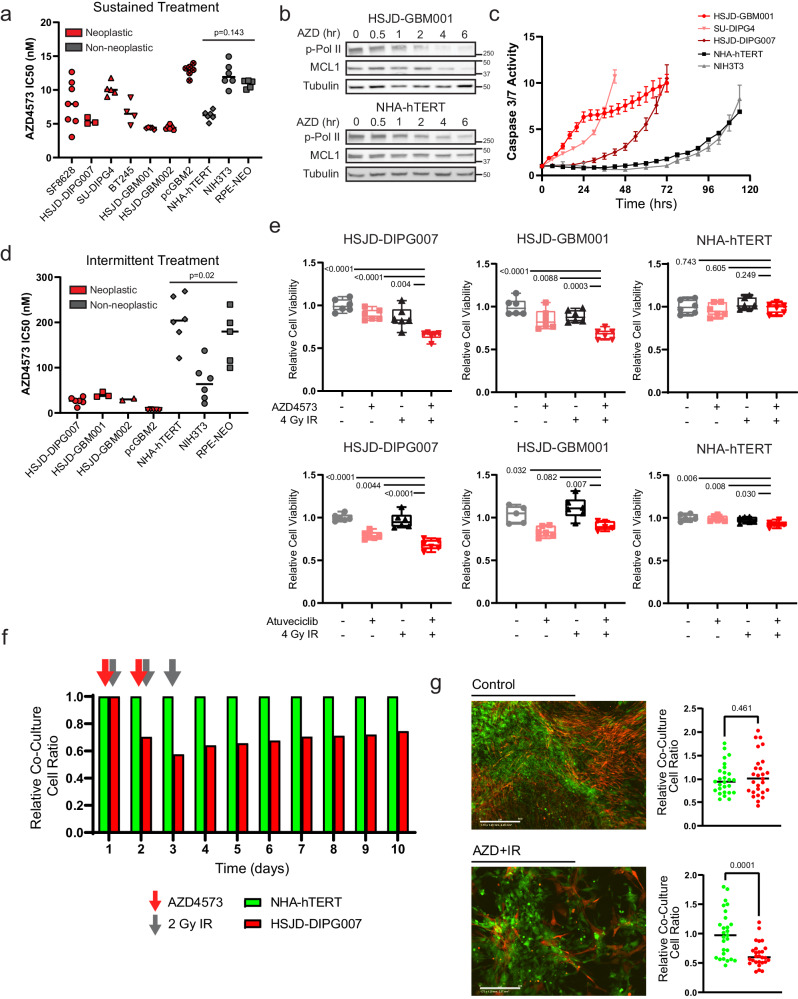
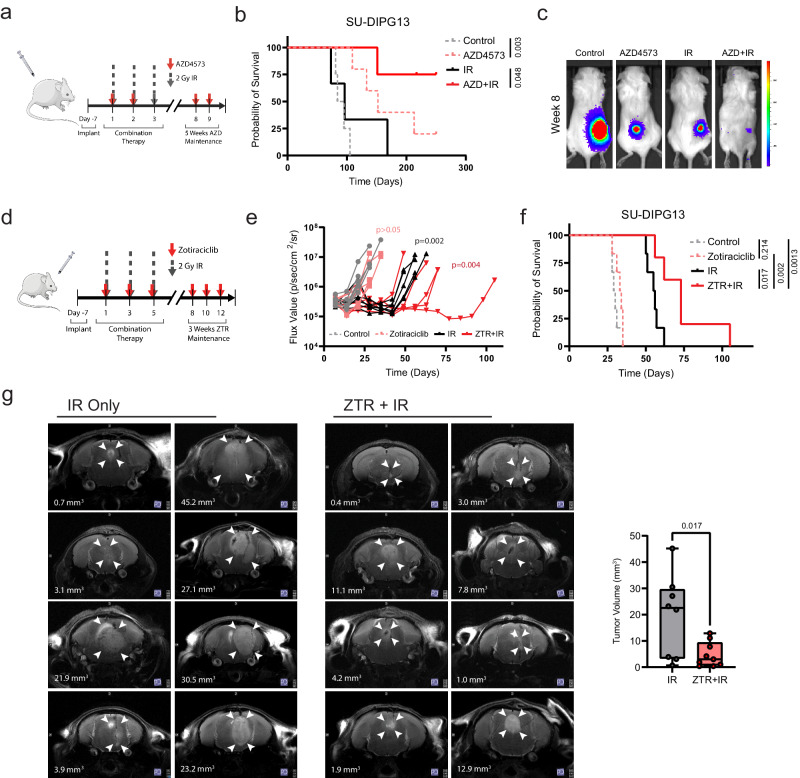
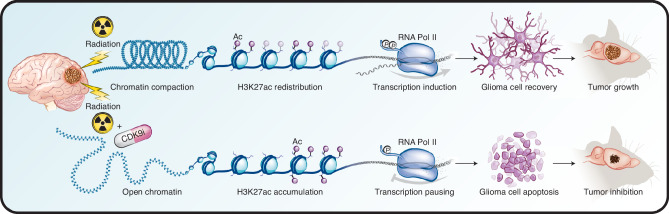
Dynamic regulation of gene expression is fundamental for cellular adaptation to exogenous stressors. P-TEFb-mediated pause-release of RNA polymerase II (Pol II) is a conserved regulatory mechanism for synchronous transcriptional induction in response to heat shock, but this pro-survival role has not been examined in the applied context of cancer therapy. Using model systems of pediatric high-grade glioma, we show that rapid genome-wide reorganization of active chromatin facilitates P-TEFb-mediated nascent transcriptional induction within hours of exposure to therapeutic ionizing radiation. Concurrent inhibition of P-TEFb disrupts this chromatin reorganization and blunts transcriptional induction, abrogating key adaptive programs such as DNA damage repair and cell cycle regulation. This combination demonstrates a potent, synergistic therapeutic potential agnostic of glioma subtype, leading to a marked induction of tumor cell apoptosis and prolongation of xenograft survival. These studies reveal a central role for P-TEFb underpinning the early adaptive response to radiotherapy, opening avenues for combinatorial treatment in these lethal malignancies.


Conflict of interest statement

S.D.K received clinical trial funding from Genentech, AstraZenca, and Ionis unrelated to this work. She also receives preclinical funding from Roche, unrelated to this work. The remaining Authors declare no competing interests.

Figures

Fig. 1
Fig. 1. Glioma cells rapidly reorganize active chromatin following exposure to IR.
a Scatterplot of ATAC-seq peaks compared between 6 Gy IR-exposed cells and untreated controls (n = 2). Differentially gained loci of accessibility are indicated in purple, differentially lost accessibility in black. b Genome-wide heatmap of accessibility before and after IR exposure. c. Gene ontology network constructed from loci of accessibility lost following IR. Each node denotes an enriched term, with color density reflecting -log(Pval). d. TRRUST inference of transcription factor-target pairs from differential ATAC-seq loci, ranked by Fisher’s exact test (-Log(p val)). e Scatterplot of H3K27ac ChIP-seq peaks compared between 6 Gy IR-exposed cells and untreated controls (n = 2). Differentially gained H3K27ac occupancy is indicated in red, differentially lost occupancy in black. f H3K27ac ChIP-seq metagene profiles clustered by ATAC-seq-defined chromatin features. Shaded bands reflect standard error. g Gene ontology network constructed from loci of differential H3K27ac occupancy following IR. Each node denotes an enriched term, with color ratio reflecting relative contribution from H3K27ac gain and lost lists. Source data are provided as a Source Data file.
Fig. 2
Fig. 2. Redistributed H3K27ac occupancy correlates with early transcription from DDR programs.
a Click-IT fluorescent assay of relative nascent RNA abundance at indicated timepoints following 6 Gy IR. Comparisons reflect p value of two-tailed Student’s t-test vs untreated control (bar = 50 µm), mean ± SD of n = 3 biologically independent replicates imaged 4 fields per replicate. b. Schematic representation of P-TEFb localization to H3K27ac-marked chromatin by active BRD4- or SEC-P-TEFb complexes to facilitate the phosphorylation of Pol II CTD (Ser2). c Immunoblot of p-Pol II (Ser2), total Pol II, and CDK9 measured 4 h after 6 Gy IR. Value below represents mean quantification of biological triplicates. d Immunoblot for 7SK snRNP complex members LARP7, MEPCE, and HEXIM1 following CDK9 co-immunoprecipitation before and 4 h after 6 Gy IR exposure. Data represent two independent experiments. e Genome-wide heatmap of BRD4 (left) and ENL (right) CUT&RUN occupancy before and after IR exposure (n = 2). f Scatterplot of p-Pol II (S2) CUT&RUN peaks compared between IR-exposed cells and untreated controls (n = 3). Differentially bound peaks are indicated in pink. g Histogram of differentially expressed transcripts following IR. Transcripts with significant (Wilcoxon rank sum qval <0.05) but <1.2 LF change are indicated in grey. Transcripts with >± LFC are in red and black, respectively. h Functional ontology enrichment of transcripts ≥ 1.2 LFC in e. Unbiased top 20 terms identified by Metascape using a hypergeometric test and Benjamini-Hochberg P value correction algorithm are displayed, with terms involved in transcriptional processing or DDR in red. i Metagene plots of ATAC-seq, H3K27ac ChIP-seq, BRD4, ENL, and p-Pol II (S2) CUT&RUN changes at differentially expressed transcripts. j Illustrative loci at FOXD1 and SOX2 promoters demonstrate p-Pol II downstream egress and active transcription correlates with H3K27ac deposition irrespective of change in accessibility. Paired tracks reflect the same data scale. Source data are provided as a Source Data file.
Fig. 3
Fig. 3. Concurrent CDK9 inhibition disrupts IR-driven chromatin reorganization and abrogates transcriptional induction.
a Immunoblot of p-Pol II (Ser2) and total Pol II at indicated doses of AZD4573. Quantification normalized to total Pol II shown below. Data represent two independent experiments. b Click-IT fluorescent assay of relative nascent RNA abundance at indicated doses of AZD4573 (bar = 100 µm), n = 4 biologically independent replicates. Box plots display interquartile range, median, and whisker (minimum to maximum). c. ATAC-seq heatmap of untreated SU-DIPG4 controls, 6 Gy IR exposed, or IR exposed with concurrent AZD4573 (40 nM) (n = 2). Genome is clustered by a change in ATAC-seq peaks following IR exposure. d H3K27ac, BRD, and ENL heatmap of untreated SU-DIPG4 controls, 6 Gy IR exposed, or IR exposed with concurrent AZD4573 (40 nM) (n = 2). Genome is clustered by a change in H3K27ac ChIP-seq peaks at enhancers or promoters following IR exposure. e. H3K27ac metagene profile at transcripts differentially upregulated following IR in the presence or absence of AZD4573. f p-Pol II heatmap (left) and metagene profile (right) of untreated controls, IR exposed, or IR exposed with concurrent AZD4573 (40 nM) (n = 3). g Histogram of IR-induced transcripts (ANOVA p < 0.05) LFC value in the presence or absence of AZD4573 (SU-DIPG4). h IR-induced gene (ANOVA p < 0.05) LFC value in the presence or absence of AZD4573 in SF8628 and HSJD-DIPG007 cells. Source data are provided as a Source Data file.
Fig. 4
Fig. 4. P-TEFb activity is required for canonical DNA damage response programs.
Gene ontology network (a) and terms (b) constructed from genes significantly induced by 6 Gy IR but abrogated with concurrent AZD4573 (40 nM) across three cell lines (SU-DIPG4, HSJD-DIPG007, SF8628; n = 3 each condition, LFC + /− 1.2 with p val <0.05). Each node denotes an enriched term, with color density reflecting -log(Pval). Enrichment defined by Metascape using hypergeometric test and Benjamini-Hochberg P value correction algorithm. c. DNA damage as measured by flow cytometry for yH2AX 6 h (left) or 24 h (right) after IR, 8 nM AZD4573, or combination. Comparison reflects p value of two-tailed Student’s t-test, mean ± SEM of n = 3 biologically independent replicates. d. Representative immunofluorescent staining for yH2AX in SU-DIPG4 at same timepoint and conditions as (c) (bar = 10 µm). e. IR-induced G2M arrest in the presence or absence of AZD4573 as measured by increase in G2M fraction from cells treated with 8 nM AZD4573, IR, or combination. Comparison reflects p value of two-tailed Student’s t-test, mean ± SEM of n = 3 biologically independent replicates per cell line. f. Cell cycle distribution of HSJD-DIPG007 cells synchronized to G0/G1 (T0, left) and then treated either while in G0/G1 synchronization (G1 Syn, middle) or after G1 release (G1 Rel, right). n = 3 biologically independent replicates per condition. g. Caspase 3/7 activation measured 24 h after treatment with 4 nM AZD4573, IR, or combination. Comparison reflects p value of two-tailed Student’s t-test, mean ± SEM of n = 4 biologically independent replicates, with HSJD-GBM001 imaged 4 fields per replicate. Representative fluorescent live-cell imaging from HSJD-GBM001 shown on right (bar = 200 µm). Source data are provided as a Source Data file.
Fig. 5
Fig. 5. CDK9i exhibits cytotoxic synergy with IR in HGG.
Colony focus assay images (left) and quantification (right) of HGG cultures treated with 4 nM AZD4573 (a), 6 nM NVP-2 (b), or 700 nM atuveciclib (c), IR, or in combination. Quantitative comparisons reflect p value of two-tailed Student’s t-test, mean ± SEM of n = 3 biologically independent replicates. d. Clonogenic survival for HGG cultures treated with IR alone or combination with 2 nM AZD4573, n = 3 biologically independent replicates. e. SU-DIPG4 clonogenic survival treated in combination with IR alone or in combination with 6 nM NVP-2, 700 nM atuveciclib (Atuv), or 15 nM zotiraciclib (ZTR), n = 3 biologically independent replicates. f. Brain tumor initiating cell fraction as identified by ALDH expression before and after combinatorial AZD4573 + IR treatment, n = 2 biologically independent replicates. g. Neurosphere formation efficacy (left) and relative stem cell frequency (right) by extreme limiting dilution assay following treatment with 4 nM AZD4573, IR, or combination. Comparisons reflect p value of pairwise one-sided Chi-square test for stem cell frequencies, data reflect single experiment per cell line with replicates per density in Source Data file. h. Neurosphere formation efficacy and relative stem cell frequency by extreme limiting dilution assay following CDK9 shRNA transduction compared to non-targeting control. Insert reflects p value of pairwise one-sided Chi-square test, data reflect single experiment per cell line with replicates per density in Source Data file. i. Viability of HSJD-DIPG007 cells following 4 Gy IR and ±4 nM AZD4573 treatment. Cells were modified to overexpress either WT CDK9 or D167N catalytic-inactive mutant. Quantitative comparisons reflect p value of two-tailed Student’s t-test of n = 6 biologically independent replicates, box plots display interquartile range, median, and whisker (minimum to maximum). Source data are provided as a Source Data file.
Fig. 6
Fig. 6. Transcriptional addiction in HGG gives rise to a therapeutic index for CDK9i relative to normal astrocytes.
a. Half-maximal inhibitory concentration of AZD4573 after 3-day exposure in respective cell lines. Comparison reflects p value of two-tailed Student’s t-test of mean IC50 values from neoplastic vs non-neoplastic cultures. Minimum n = 3 biologically independent replicates per cell line (n = 3 HSJD-DIPG007, n = 4 BT245, n = 5 SU-DIPG4, HSJD-GBM001, and RPE-NEO, n = 6 HSJD-GBM002, pcGBM2, NHA-hTERT, and NIH3T3, n = 8 SF8628). b. Western blot analysis of p-Pol II (Ser 2) and MCL1 after indicated exposure times to 50 nM AZD4573. Data represent single experiment. c. Caspase 3/7 activity over time following fixed 4 nM dose of AZD4573. Error bars indicate SEM from minimum 4 biological replicates per cell line (n = 4 HSJD-GBM001, NHA-hTERT, and NIH3T3, n = 5 SU-DIPG4 and HSJD-DIPG007). d. Half-maximal inhibitory concentrations and comparison as in (A) but measured 3 days after a single 8-hour drug exposure followed by drug washout. Comparison reflects p value of two-tailed Student’s t-test of mean IC50 values from neoplastic vs non-neoplastic cultures, minimum n = 2 biologically independent replicates per cell line (n = 2 HSJD-GBM002, n = 3 HSJD-GBM001, n = 5 pcGMB2 and RPE-NEO, n = 6 HSJD-DIPG007, NHA-hTERT, and NIH3T3). e. Cell viability measured at 3 days following 8-hour exposure to 5 nM AZD4573 (top) or 700 nM atuveciclib (bottom) +/− 4 Gy IR. Box plots display interquartile range, median, and whisker (minimum to maximum). Comparison reflects p value of two-tailed Student’s t-test, n = 6 biologically independent replicates. f. Relative ratio of co-cultured DIPG cells (HSJD-DIPG007) and normal astrocytes (NHA-hTERT) following fractionated radiotherapy and intermittent AZD4573 treatment as indicated by arrows. g. Quantification of (f) at day 10, p value of two-tailed Student’s t-test from n = 6 biologically independent replicates imaged 4 fields per replicate. Source data are provided as a Source Data file.
Fig. 7
Fig. 7. Concurrent CDK9i augments anti-tumor effect of IR to prolong survival in vivo.
a. Schematic represents the treatment schedule of SU-DIPG13* xenografts with either AZD4573 (15/15 mg/kg biweekly administered intraperitoneally), radiotherapy (2 Gy x 3 fractions), or combination. b. Kaplan-Meier survival analysis of SU-DIPG13* flank cohorts receiving indicated treatments. Comparison reflects p value of Mantel-Cox log-rank test (control n = 4, AZD4573 n = 5, IR n = 3, AZD + IR n = 4). c. Bioluminescent imaging from median mouse of each treatment cohort in (B) at completion of therapy period. d. Schematic representation of schedule for SU-DIPG13* xenografts treated with either zotiraciclib (ZTR, 50 mg/kg 3x weekly for two weeks followed by 35 mg/kg 3x weekly for two weeks, administered by oral gavage), radiotherapy (2 Gy x 3 fractions), or combination. e. Bioluminescent flux from individual animals within indicated treatment groups (two-tailed Mann-Whitney test at completion of treatment, p value in insert). f. Kaplan-Meier survival analysis of orthotopic xenograft cohorts receiving indicated treatments. Comparison reflects p value of Mantel-Cox log-rank test (control n = 6, ZTR n = 6, IR n = 6, ZTR + IR n = 5). g. Representative axial T2-weighted turboRARE MRI sequences of IR- or ZTR + IR-treated mice. Arrowheads indicate margins of tumor; white text overlay denotes three-dimensional tumor volume. Comparison of tumor volume quantification shown on right (p value of two-tailed Student’s t-test, IR n = 8, ZTR + IR n = 9). Box plots display interquartile range, median, and whisker (minimum to maximum). Source data are provided as a Source Data file.
Fig. 8
Fig. 8. Model of IR-induced transcriptional reorganization.
Rapid reorganization of active chromatin drives transcriptional induction required for DDR programs. Concurrent inhibition of P-TEFb-mediated transcriptional elongation abrogates this adaptive response, augmenting the anti-tumor effect of radiotherapy.

Update of

Similar articles

Cited by

References

    1. Vignard J, Mirey G, Salles B. Ionizing-radiation induced DNA double-strand breaks: a direct and indirect lighting up. Radiother. Oncol. 2013;108:362–369. doi: 10.1016/j.radonc.2013.06.013. - DOI - PubMed
    1. Jackson SP, Bartek J. The DNA-damage response in human biology and disease. Nature. 2009;461:1071–1078. doi: 10.1038/nature08467. - DOI - PMC - PubMed
    1. Sulli G, Di Micco R, d’Adda di Fagagna F. Crosstalk between chromatin state and DNA damage response in cellular senescence and cancer. Nat. Rev. Cancer. 2012;12:709–720. doi: 10.1038/nrc3344. - DOI - PubMed
    1. Pedersen, H., Schmiegelow, K., & Hamerlik, P. Radio-Resistance and DNA Repair in Pediatric Diffuse Midline Gliomas. Cancers (Basel)12, 2813 (2020). - PMC - PubMed
    1. Pilié PG, Tang C, Mills GB, Yap TA. State-of-the-art strategies for targeting the DNA damage response in cancer. Nat. Rev. Clin. Oncol. 2019;16:81–104. doi: 10.1038/s41571-018-0114-z. - DOI - PMC - PubMed

MeSH terms

Substances