. 2024 May 30;14(1):12470.
doi: 10.1038/s41598-024-60298-x.

Primary cilia suppress the fibrotic activity of atrial fibroblasts from patients with atrial fibrillation in vitro

Affiliations

Primary cilia suppress the fibrotic activity of atrial fibroblasts from patients with atrial fibrillation in vitro

Makiri Kawasaki et al. Sci Rep. .

Abstract

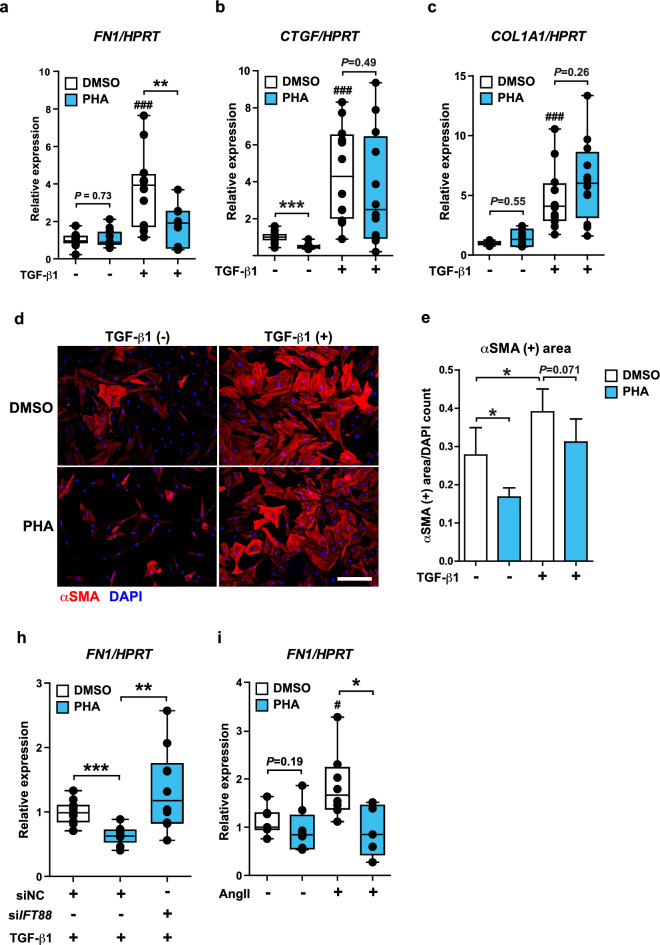
Atrial fibrosis serves as an arrhythmogenic substrate in atrial fibrillation (AF) and contributes to AF persistence. Treating atrial fibrosis is challenging because atrial fibroblast activity is multifactorial. We hypothesized that the primary cilium regulates the profibrotic response of AF atrial fibroblasts, and explored therapeutic potentials of targeting primary cilia to treat fibrosis in AF. We included 25 patients without AF (non-AF) and 26 persistent AF patients (AF). Immunohistochemistry using a subset of the patients (non-AF: n = 10, AF: n = 10) showed less ciliated fibroblasts in AF versus non-AF. Acetylated α-tubulin protein levels were decreased in AF, while the gene expressions of AURKA and NEDD9 were highly increased in AF patients' left atrium. Loss of primary cilia in human atrial fibroblasts through IFT88 knockdown enhanced expression of ECM genes, including FN1 and COL1A1. Remarkably, restoration or elongation of primary cilia by an AURKA selective inhibitor or lithium chloride, respectively, prevented the increased expression of ECM genes induced by different profibrotic cytokines in atrial fibroblasts of AF patients. Our data reveal a novel mechanism underlying fibrotic substrate formation via primary cilia loss in AF atrial fibroblasts and suggest a therapeutic potential for abrogating atrial fibrosis by restoring primary cilia.


Conflict of interest statement

JRdG received research grants through his institution from Abbott, Atricure, Boston Scientific, Bayer, Daiichi Sankyo, Johnson&Johnson, Medtronic Servier, and received speaker/consultancy fees from Atricure, Bayer, Daiichi Sankyo, Johnson&Johnson and Medtronic outside the submitted work. AHGD is a consultant for Atricure. The other authors report no disclosures.

Figures

Figure 1
Figure 1
The proportion of fibroblasts with primary cilia is significantly decreased in the left atrial tissue of AF patients possibly via the NEDD9/AURKA/HDAC6 axis. (a) A representative morphology of primary cilium projecting from the apical surface of a cultured fibroblast isolated from the left atrial tissue of a non-AF patient. Red: ac α-tub (acetylated α-tubulin, primary cilium), green: vimentin (intermediate cytoskeleton), blue: DAPI (nucleus). Fibroblasts were starved for 48 h to promote the formation of primary cilia. Scale bar, 25 μm. **p < 0.01 (Student’s unpaired t-test). (b) Representative images of immunohistochemistry performed on the cryosections of left atrial tissue from the non-AF and AF patients. Arrow heads and a void arrowhead indicate the primary cilia of vimentin positive and vimentin negative cells, respectively. Scale bar, 10 μm. (c) The proportion of fibroblasts with primary cilia (%) in the left atrial tissue of non-AF and AF patients. Approximately 300–500 cells/patient were counted. **p < 0.01 (Student’s unpaired t-test). (d) Protein levels of ac α-tub and HDAC6 in the left atrial tissue of non-AF and AF patients. GAPDH serves as a loading control. **p < 0.01 (Mann–Whitney U test). (e) The protein levels of α-tubulin in the left atrial tissue of non-AF and AF patients. N = 6/group. (f) The protein levels of ac α-tub in the fibroblast fraction isolated from left atrial tissue of non-AF and AF patients. The values at the lowest row show the band density of ac α-tub relative to GAPDH in each lane. (g, h) The gene expression of AURKA (g) and NEDD9 (h) in the left atrial tissue of non-AF and AF patients. HPRT serves as an internal control. **p < 0.01, ***p < 0.001 (Mann–Whitney U test).
Figure 2
Figure 2
Loss of the primary cilia through knockdown of IFT88 reduces the proportion of NHCF-A cells with primary cilia. (a) The gene expression of IFT88 in the left atrial tissue of non-AF and AF patients tested by Mann–Whitney U test. (b, c) The gene expression (b) and the protein levels (c) of IFT88 in NHCF-A cells transfected with siNC (negative control) or siIFT88. Error bars, mean (SD). N = 3/group. **p < 0.01, ***p < 0.001 (Student’s unpaired t-test). (d) The representative images and quantification of ciliated cells (%) in NHCF-A cells transfected with siNC or siIFT88. Red: acetylated α-tubulin (primary cilia), blue: DAPI (nuclei). Scale bar, 50 μm. *p < 0.05 (Mann–Whitney U test); n = 4/group (101–122 cells/replicate).
Figure 3
Figure 3
Loss of the primary cilia through knockdown of IFT88 enhances the profibrotic capacity of NHCF-A cells and the atrial fibroblasts isolated from non-AF patients. (ad) The gene expression of FN1 (a), COL1A1 (b), CTGF (c), and COL3A1 (d) in the NHCF-A cells transfected with siNC (negative control) or siIFT88 and cultured in the absence (vehicle) or presence of 2 ng/mL TGF-β1 for 48 h. HPRT serves as an internal control. #p < 0.05, ###p < 0.001 vs. siNC group treated with vehicle, *p < 0.05, ***p < 0.001 (Student’s unpaired t-test or Mann–Whitney U test were employed according to the data distribution, and all the p-values were adjusted by post-hoc analysis). (e, f) The induction of FN1 (e) and COL1A1 (f) gene expression by TGF-β1 in the fibroblasts isolated from the left atrial tissue of three non-AF and three AF patients is shown as a fold-change (TGF-β1 treated/vehicle treated group). The dashed line indicates the baseline. (g, h) The representative images (g) and quantification (h) of αSMA-expressing myofibroblasts isolated from two non-AF (#1 and #2) and two AF patients (#3 and #4). Fibroblasts from non-AF patients were transfected with siNC or siIFT88, and fibroblasts from AF patients were transfected with siNC. Red: αSMA (myofibroblasts), blue: DAPI (nuclei). Scale bar, 50μm. The proportion of αSMA-positive cells was quantified from three technical replicates. Error bar, mean (SD).
Figure 4
Figure 4
PHA promotes the cilia formation and increase the length of primary cilia in NHCF-A cells. (a) The proportion of NHCF-A cells with primary cilia cultured in the growth medium supplemented with 10%FBS, hFGF-B and insulin following a PHA treatment at different doses (0, 0.5, 1.0 or 2.0 μM) for 48 h. N = 2/treatment. Error bars, mean (SD). (bd) The proportion of ciliated NHCF-A cells (b), the representative morphology (c) and the length of primary cilia (d) when NHCF-A cells were cultured in 0.5% FBS medium with vehicle or 2 ng/mL TGF-β1 in the absence (DMSO) or presence of 2 μg/mL PHA. Arrow heads indicate primary cilia. Red: ac α-tub (primary cilia), blue: DAPI (nuclei). Scale bar, 20 μm. In total, > 100 primary cilia/treatment from three technical replicates were measured. Error bars, mean (SD). **p < 0.01 in (b) (Student’s unpaired t-test). ***p < 0.001 in (c) (Mann–Whitney U test).
Figure 5
Figure 5
PHA (AURKA selective inhibitor PHA-680632) inhibits the profibrotic response of the fibroblasts isolated from the left atrial tissue of AF patients. (ad) The gene expression of FN1 (a), COL1A1 (b), CTGF (c) and COL3A1 (d) in the fibroblasts isolated from AF patients and cultured with vehicle or 2 ng/mL TGF-β1 in the absence (DMSO) or presence of 2 μg/mL PHA. The dashed line indicates the baseline. ##p < 0.01, ###p < 0.001 vs. PHA (−) TGF-β1 (−) group, *p < 0.05, **p < 0.01, ***p < 0.001 (paired t-test or Wilcoxon signed-rank test according to the data distribution). (e, f) The representative images (e) and the quantification (f) of fibroblasts from AF patients that differentiated into αSMA-expressing myofibroblasts in respective treatments. Red: αSMA (myofibroblasts), blue: DAPI (nuclei). Scale bar, 100 μm. *p < 0.05 (paired t-test).
Figure 6
Figure 6
PHA suppresses the gene expression of FN1 induced by TGF-β1 in a primary cilia-dependent manner. (ac) The gene expression of FN1 (a), COL1A1 (b), CTGF (c) in NHCF-A cells when cells were cultured with vehicle or 2 ng/mL TGF-β1 for 48 h in the absence (DMSO) or presence of 2 μM PHA in respective treatments. ###p < 0.001 vs. PHA (−) TGF-β1 (−) group, **p < 0.01 (Mann–Whitney U test). (d, e) The representative images of NHCF-A cells that differentiated into αSMA positive myofibroblasts (d) and the quantification of αSMA positive area (e). Red: αSMA (myofibroblasts), blue: DAPI (nuclei). Scale bar, 100 μm. αSMA positive area is normalized by DAPI count (a.u.). N = 5/group. Error bars, mean (SD). *p < 0.05 (Student’s unpaired t-test). (h) The gene expression of FN1 when NHCF-A cells were first transfected with siNC or siIFT88 and then cultured with 2 ng/mL TGF-β1 in the absence (DMSO) or presence of 2 μg/mL PHA. **p < 0.01, ***p < 0.001 (Student’s unpaired t-test). (i) The gene expression of FN1 in NHCF-A treated with vehicle or 10−6 M AngII (angiotensin II) for 48 h in the absence of presence of 2 μg/mL PHA. #p < 0.05, vs. PHA (−) AngII (−) group, *p < 0.05 (Mann–Whitney U test).
Figure 7
Figure 7
LiCl elongates primary cilia and inhibits the profibrotic response of the NHCF-A and dedifferentiates them into αSMA-negative cells. (a) The representative images and the quantification of cilia length with LiCl treatment. Red: acetylated α-tubulin (primary cilia), blue: DAPI (nuclei). Scale bar, 20 μm *p < 0.05 (Mann–Whitney U test); n = 4/group (20–29 cells/sample). (bd) The gene expression of FN1 (b), CTGF (c) and COL1A1 (d) when NHCF-A cells were cultured with vehicle or 2 ng/mL TGF-β1 for 48 h in the absence (water) or presence of 50 mM LiCl. ##p < 0.01, ###p < 0.001 vs. LiCl (−) TGF-β1 (−) group, *p < 0.05, ***p < 0.001 (Student’s unpaired t-test or Mann–Whitney U test according to the data distribution). (e, f) The representative images of NHCF-A cells that differentiated into αSMA-positive myofibroblasts (e) and the quantification of αSMA-positive area (f). NHCF-A cells were passaged more than five times and then cultured with or without 50 mM LiCl for 48 h. Red: αSMA (myofibroblasts), blue: DAPI (nuclei). Scale bar, 100 μm. αSMA-positive area is normalized by DAPI count (a.u.); n = 3–4/group. Error bar, mean (SD). *p < 0.05 (Student’s unpaired t-test).

References

    1. Wolf PA, Abbott RD, Kannel WB. Atrial fibrillation as an independent risk factor for stroke: The Framingham study. Stroke. 2018;22:983–988. doi: 10.1161/01.STR.22.8.983. - DOI - PubMed
    1. Wolf PA, Dawber TR, Thomas HE, Kannel WB. Epidemiologic assessment of chronic atrial fibrillation and risk of stroke: The Framingham study. Neurology. 1978;28:973–977. doi: 10.1212/WNL.28.10.973. - DOI - PubMed
    1. Anter E, Jessup M, Callans DJ. Atrial fibrillation and heart failure: Treatment considerations for a dual epidemic. Circulation. 2009;119:2516–2525. doi: 10.1161/CIRCULATIONAHA.108.821306. - DOI - PubMed
    1. Thrall G, Lane D, Carroll D, Lip GYH. Quality of life in patients with atrial fibrillation: A systematic review. Am. J. Med. 2006;119(448):e1–448.e19. - PubMed
    1. Andersson T, et al. All-cause mortality in 272,186 patients hospitalized with incident atrial fibrillation 1995–2008: A Swedish nationwide long-term case-control study. Eur. Heart J. 2013;34:1061–1067. doi: 10.1093/eurheartj/ehs469. - DOI - PMC - PubMed

MeSH terms

Grants and funding