. 2024 May 30;12(1):34.
doi: 10.1038/s41413-024-00331-x.

Lumbar instability remodels cartilage endplate to induce intervertebral disc degeneration by recruiting osteoclasts via Hippo-CCL3 signaling

Affiliations

Lumbar instability remodels cartilage endplate to induce intervertebral disc degeneration by recruiting osteoclasts via Hippo-CCL3 signaling

Hanwen Li et al. Bone Res. .

Abstract

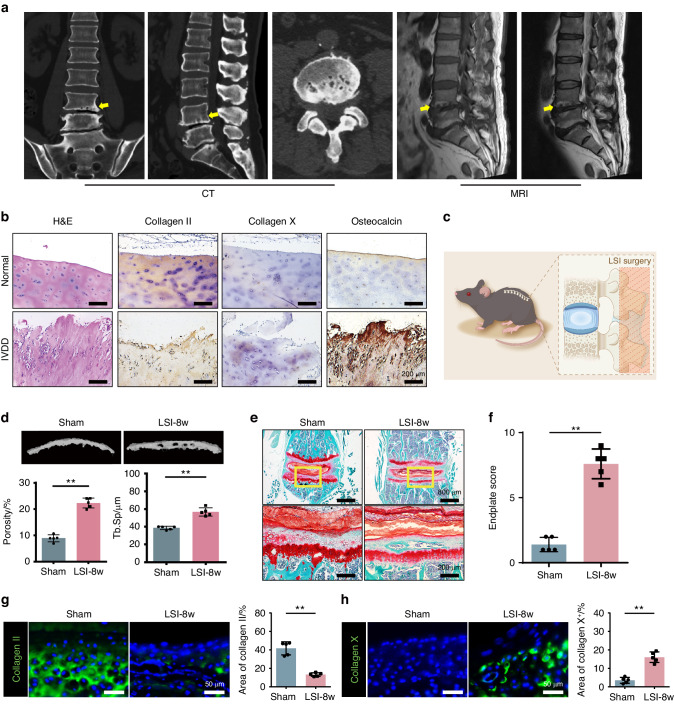
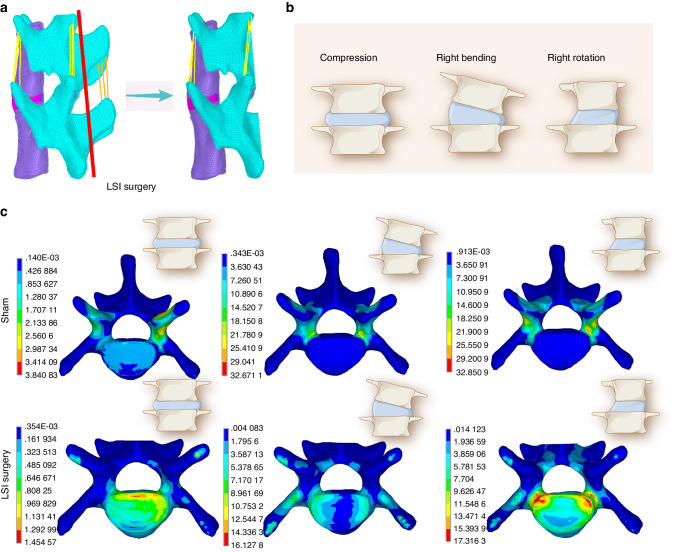
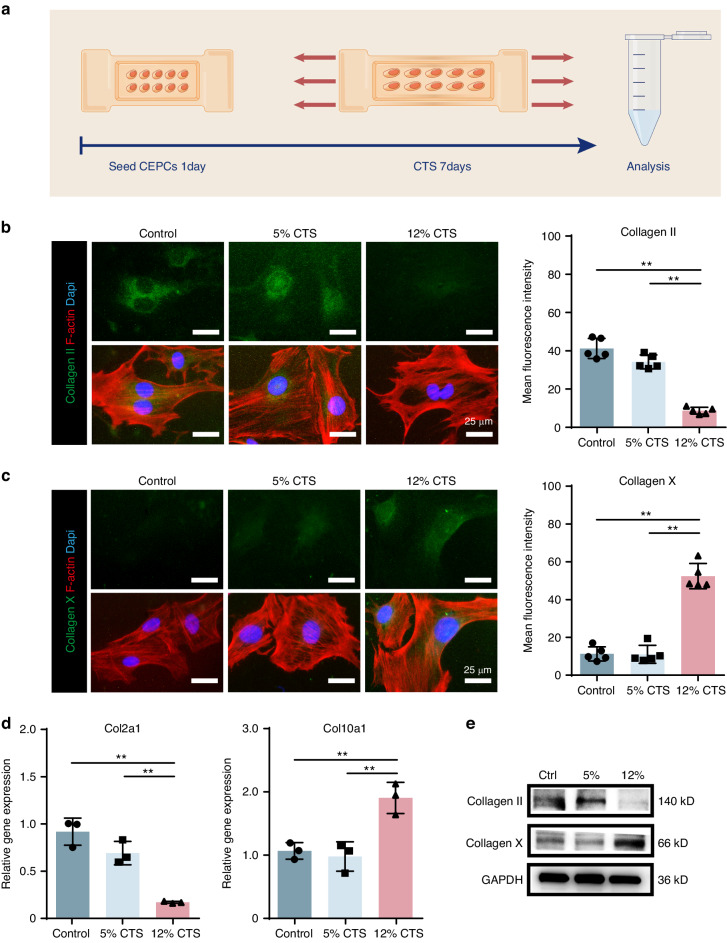
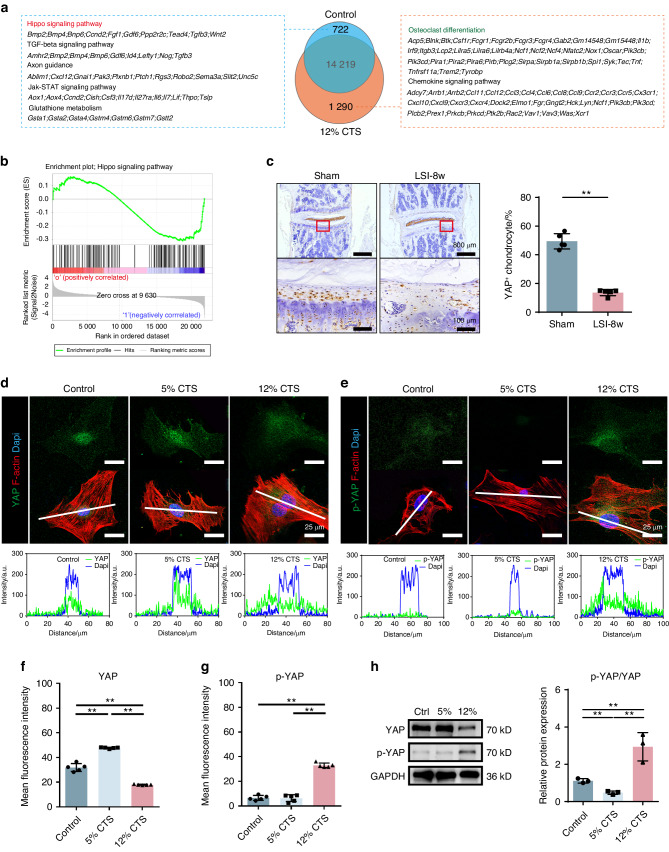
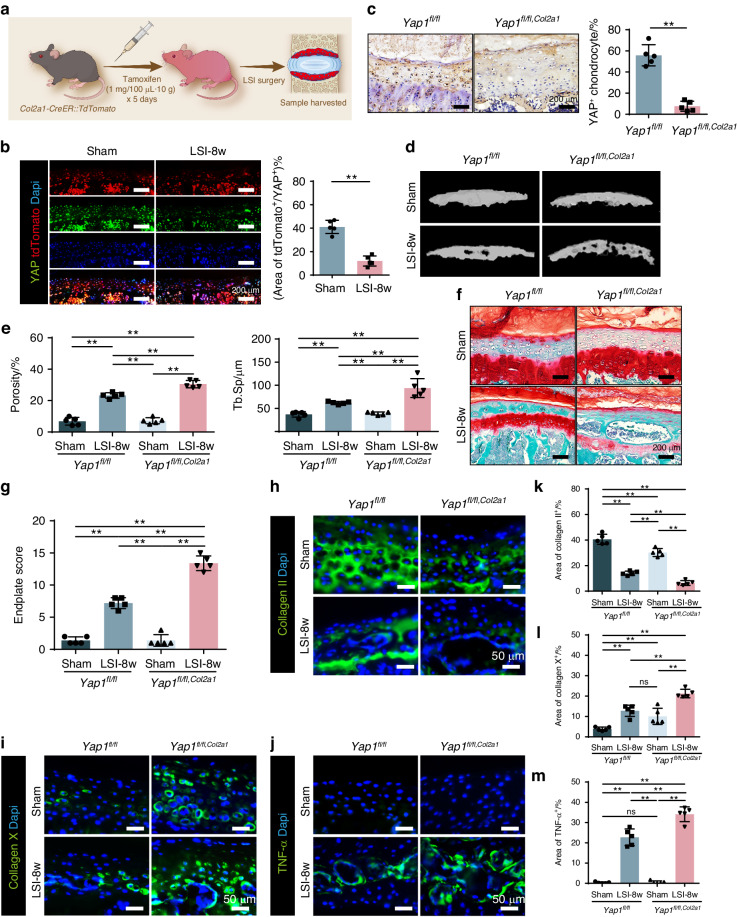
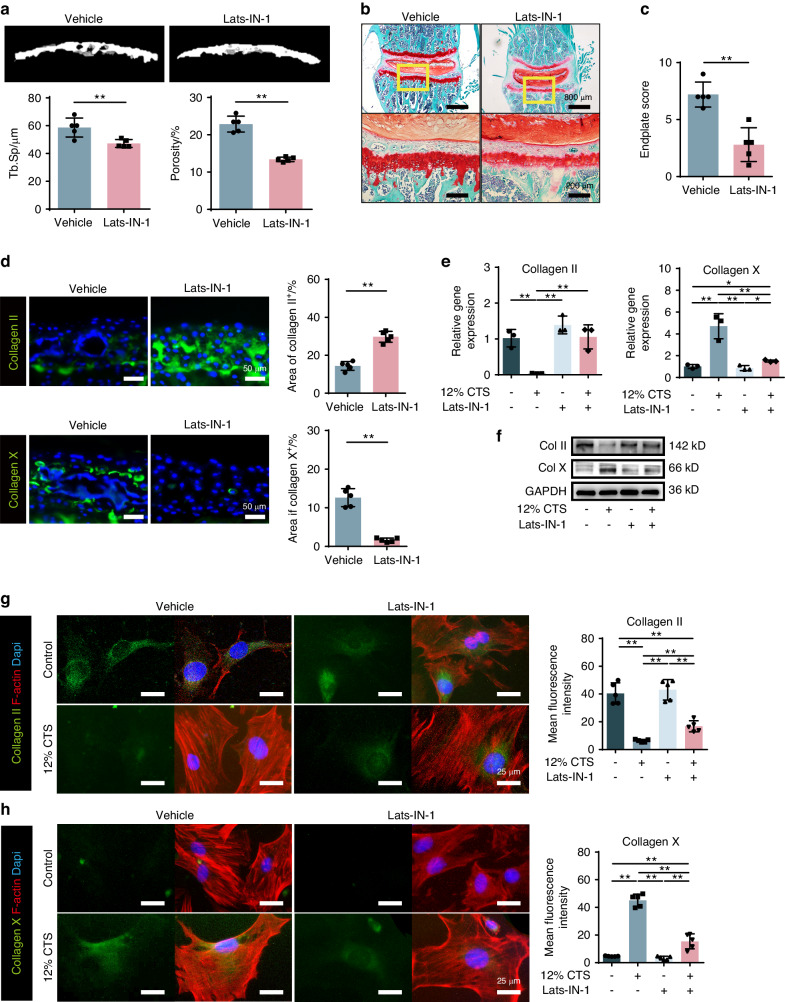
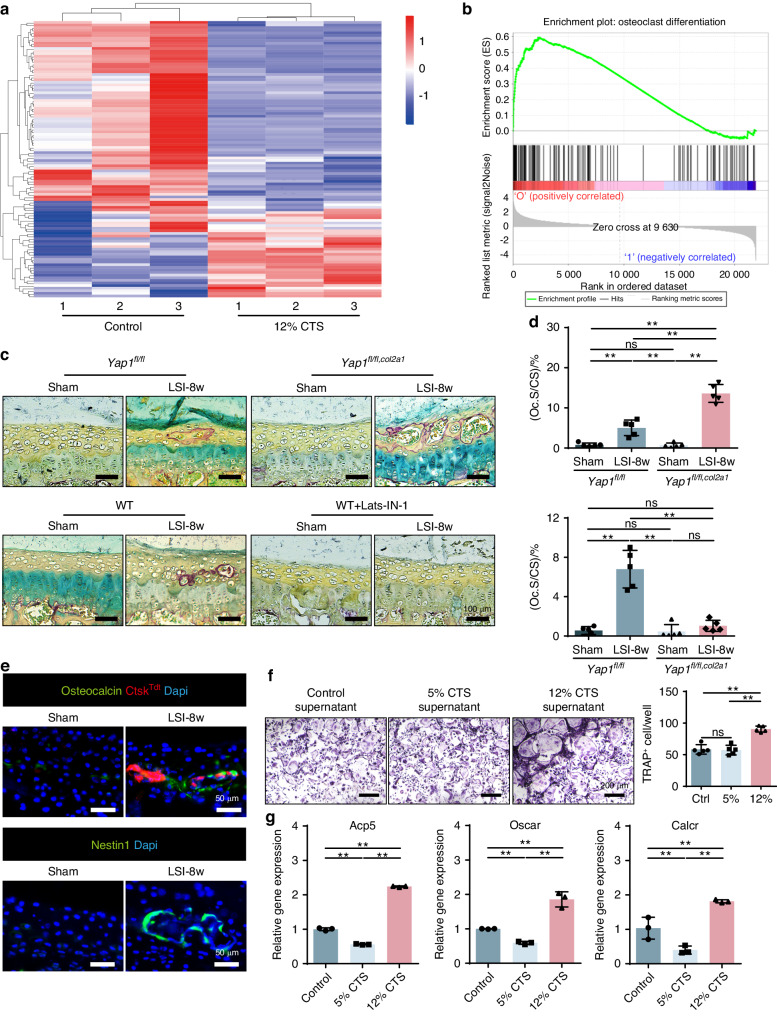
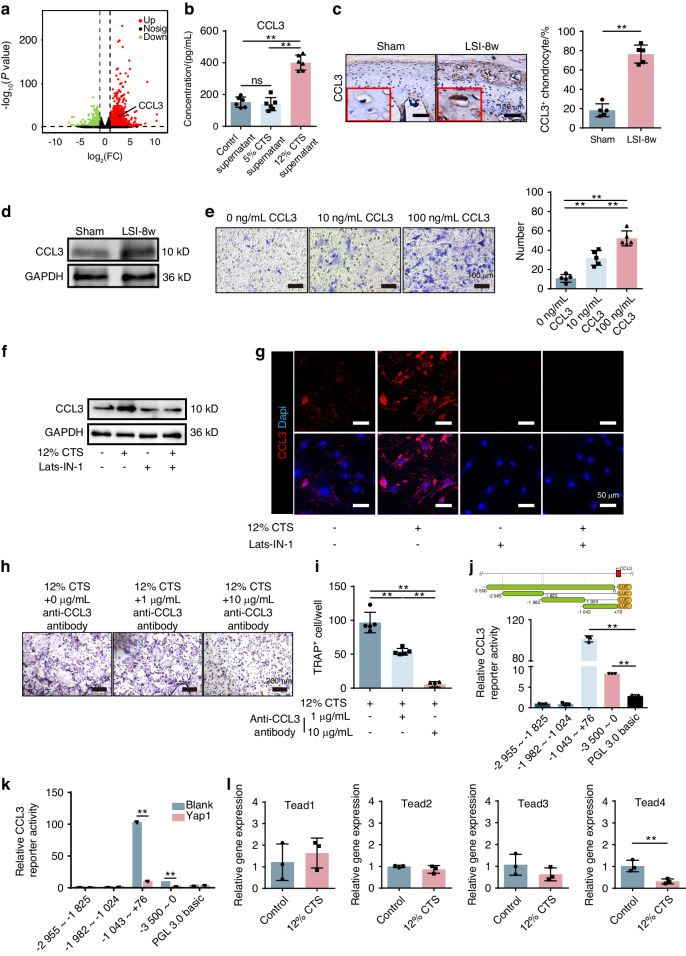
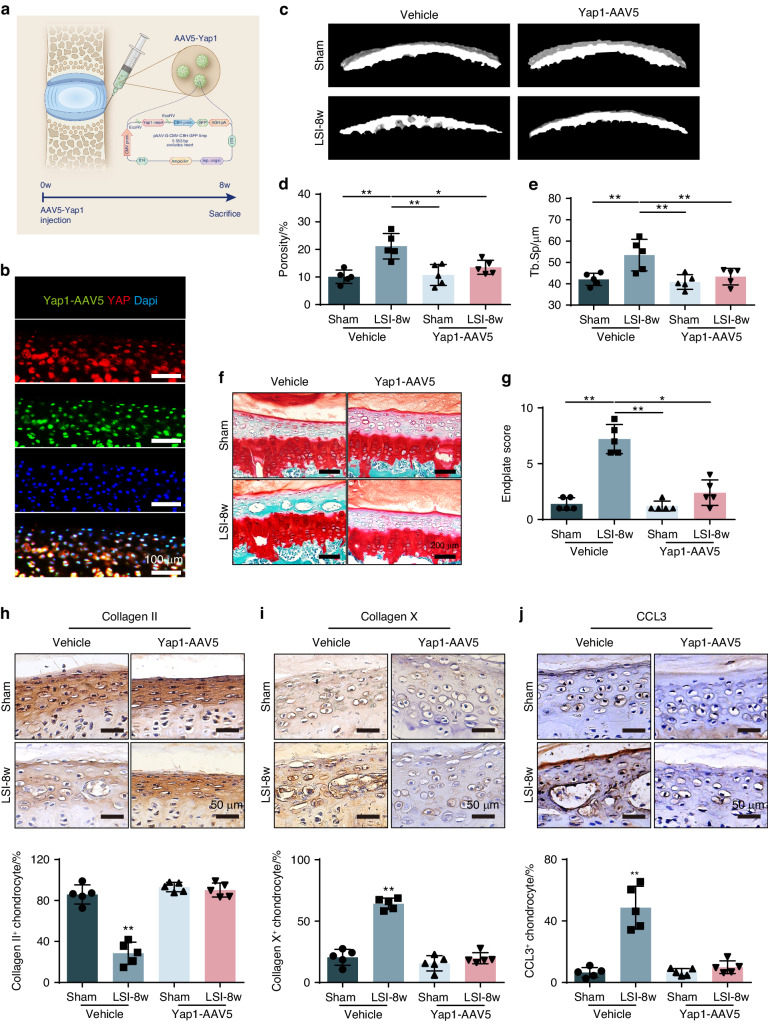
Degenerated endplate appears with cheese-like morphology and sensory innervation, contributing to low back pain and subsequently inducing intervertebral disc degeneration in the aged population.1 However, the origin and development mechanism of the cheese-like morphology remain unclear. Here in this study, we report lumbar instability induced cartilage endplate remodeling is responsible for this pathological change. Transcriptome sequencing of the endplate chondrocytes under abnormal stress revealed that the Hippo signaling was key for this process. Activation of Hippo signaling or knockout of the key gene Yap1 in the cartilage endplate severed the cheese-like morphological change and disc degeneration after lumbar spine instability (LSI) surgery, while blocking the Hippo signaling reversed this process. Meanwhile, transcriptome sequencing data also showed osteoclast differentiation related gene set expression was up regulated in the endplate chondrocytes under abnormal mechanical stress, which was activated after the Hippo signaling. Among the discovered osteoclast differentiation gene set, CCL3 was found to be largely released from the chondrocytes under abnormal stress, which functioned to recruit and promote osteoclasts formation for cartilage endplate remodeling. Over-expression of Yap1 inhibited CCL3 transcription by blocking its promoter, which then reversed the endplate from remodeling to the cheese-like morphology. Finally, LSI-induced cartilage endplate remodeling was successfully rescued by local injection of an AAV5 wrapped Yap1 over-expression plasmid at the site. These findings suggest that the Hippo signaling induced osteoclast gene set activation in the cartilage endplate is a potential new target for the management of instability induced low back pain and lumbar degeneration.


Conflict of interest statement

The authors declare no competing interests.

Figures

Fig. 1
Fig. 1
Destruction of cartilage endplate in IVDD patients and LSI model. a Cheese-like endplate in patients with lumbar degeneration. b Representative H&E and immunohistochemical (IHC) staining of endplates in patients with lumbar degeneration. c Schematic diagram of the LSI surgery. d Top, representative 3D Micro-CT images of the mouse caudal endplates of L4/5 (coronal view) at 8 weeks after LSI or sham surgery. Bottom, quantitative analysis of the total porosity and trabecular separation (Tb. Sp). e Representative SOFG staining images of the CEP in mice with LSI or sham surgery for 8 weeks. f Endplate scores of the caudal endplates based on (e). g, h Left, representative IF staining images of the Collagen II and Collagen X (green) in the CEP. Right, quantitative analysis of the percentage of each area in CEP. **P < 0.01
Fig. 2
Fig. 2
FEA simulated CEP mechanical stress distribution after LSI surgery. a FEA model based on the microstructure of a mouse spine, in which the red line indicates the location of LSI resection. b Schematic diagram of the FEA model with different postures. c FEA simulation of the maximum principal strain from different directions at the CEP
Fig. 3
Fig. 3
Application of abnormal stress on CEPCs. a Schematic diagram indicates the application of abnormal stress on CEPCs. Left, IF staining of Collagen II (b) and Collagen X (c) after CTS. Right, quantitative analysis of the mean fluorescence intensity of CESCs in Ctrl, 5% CTS and 12% CTS groups. F-actin (red), Collagen II and Collagen X (Green), DAPI (blue). d Quantitative analysis of Col2a1 and Col10a1 mRNA expression in CEPCs treated with CTS. e Western blot (WB) analysis of Collagen II and Collagen X in CEPCs treated with CTS. *P < 0.05, **P < 0.01
Fig. 4
Fig. 4
Abnormal stress regulates the Hippo signaling in CEPCs. a KEGG analysis of the CEPCs before and after 12% CTS stimulation. b Gene set enrichment analysis of the differentially expressed genes in 12% CTS versus control. c Left, IHC of YAP expression in CEP of mice with LSI or sham surgery for 8 weeks. Right, statistical analysis of the percentage of YAP positive chondrocytes. d, e Top, IF staining of YAP and p-YAP in CEPCs with Ctrl, 5% CTS and 12% CTS. Bottom, fluorescence colocalization analysis of YAP and DAPI following the white line shown in staining. F-actin (red), YAP and p-YAP (green), DAPI (blue). f, g Quantitative analysis of the mean fluorescence intensity of CESCs in (d) and (e), respectively. h WB analysis of YAP and p-YAP expression in CEPCs treated with CTS. *, P < 0.05, **, P < 0.01
Fig. 5
Fig. 5
Loss of Yap1 exaggerates CEP degeneration after LSI surgery. a Schematic diagram of the usage of the Col2a1-CreER::TdTomato mice to evaluate the chondrocytes in CEP. b IF staining and quantitative analysis of YAP in CEP from the mice with sham or LSI surgery. c IHC and quantitative analysis of the YAP expression in the CEP from Yap1fl/fl,Col2a1 mice with sham or LSI surgery. d Representative 3D Micro-CT images of the mice caudal endplates of L4-5 level (coronal view) at 8 weeks after LSI or sham surgery. e Quantitative analysis of the total porosity and Tb. Sp. f Representative SOFG staining images of the CEP from mice with Yap1 conditional knockout and LSI surgery. g Endplate scores evaluation of the CEP based on (f). h, i, j Representative IF staining images of the Collagen II, Collagen X and TNF-α (green) in CEP from different groups. k, l, m Quantitative analysis of the percentage of each area in CEP. **P < 0.01
Fig. 6
Fig. 6
Activation of YAP attenuates cartilage degradation during LSI. a Top, representative 3D Micro-CT images of the caudal endplates of L4-5 level (coronal view) from LSI mice with or without Lats-IN-1 treatment. Bottom, quantitative analysis of the total porosity and Tb. Sp. b Representative SOFG staining images of the CEP from LSI mice with or without Lats-IN-1 treatment. c Endplate scores of the caudal endplates based on (b). d Left, representative IF staining images of the Collagen II and Collagen X (green) of the CEP from LSI mice with or without Lats-IN-1 treatment. Right, quantitative analysis of the percentage of each area in CEP. e Gene expression of Col2a1 and Col10a1 in CEPCs treated with 12% CTS and Lats-IN-1. f WB analysis of Collgen II, Collgen X and YAP in CEPCs treated with 12% CTS and Lats-IN-1. g, h Left, IF staining of Collagen II and Collagen X in Ctrl, 12% CTS, Ctrl+Lats-IN-1 and 12% CTS+Lats-IN-1 groups. Right, quantitative analysis of the mean fluorescence intensity. F-actin (red), Collagen II and Collagen X (Green), DAPI (blue). *P < 0.05, **P < 0.01
Fig. 7
Fig. 7
Abnormal stress allows osteoclast recruitment in CEP to initiate remodeling through the Hippo signaling. a Heatmap of the osteoclast related genes expression in CEPCs in the 12% CTS group versus the control group. b Gene set enrichment analysis of the osteoclastogenesis realted genes in the 12% CTS group as compared to the control group. c Representative images of TRAP staining on CEP in each group. d Quantitative analysis of (c), Osteoclasts surface/CEP surface (Oc.S/CS). e Top. IF staining of Osteocalcin in CEP from the Ctsk-Cre::TdTomato mice with sham or LSI surgery. Bottom, representative IF staining images of Nestin1+ area (green) with DAPI (blue). f Left, TRAP staining of the BMMs after induction by using the supernatant of CTS-treated CEPCs supplemented with low-does RANKL. Right, quantative analysis of osteoclast number in each group. g Gene expression analysis of Acp5, Oscar and Calcr in BMMs treated with the supernatant of CTS-treated CEPCs
Fig. 8
Fig. 8
Loss of YAP triggered CCL3 expression in CEPCs to active osteoclastogenesis. a Volcano plot analysis of the genes expression change profile in CEPCs treated with 12% CTS. b ELISA analysis of CCL3 concentration in the supernatant of CEPCs treated with CTS. c IHC and quantitative analysis of CCL3 in CEP from mice with sham or LSI surgery. d WB analysis of CCL3 in CEPs from mice taken sham or LSI surgery after 8 weeks. e Transwell assay to evaluate the BMM migration under CCL3 attraction. The BMMs were seeded on the upper chamber and different concentrations of CCL3 were added into the lower chamber. Representative images are shown on the left and random cell counting manually in five random fields under ×100 magnification on the right. f WB analysis of YAP and CCL3 in CEPCs treated with 12% CTS and YAP agonists Lats-IN-1. g IF staining of CCL3 in CEPCs treated with 12% CTS and YAP agonists Lats-IN-1. h TRAP staining of BMMs after induction with the supernatant of CTS-treated CEPCs supplemented with CCL3-neutralizing antibody. i Quantative analysis of osteoclast number in (g). j Luciferase assay of CCL3 reporter activity to identify the active region of CCL3 promoter in HEK293T cells. k Luciferase assay of CCL3 reporter activity with transfection of control or Yap1-overexpression plasmid in HEK293T cells. l Gene expression analysis of TEADs in CEPCs treated by 12% CTS. *P < 0.05. **P < 0.01
Fig. 9
Fig. 9
Yap1-AAV5 protected CEP from remodeling in LSI mice. a LSI or sham mice CEP treated with paravertebral injection of Yap1-AAV5. The L4-5 level of CEP were harvested at 8 weeks after injection of Yap1-AAV5 in LSI or sham mice. b Tracing of Yap1-AAV5 in the CEP of L4/5 by IF staining of Yap1-AAV5 (Green), YAP (Red) and DAPI (blue). c Representative 3D Micro-CT images of the mice caudal endplates of L4-5 level (coronal view) at 8 weeks after LSI or sham surgery. d, e Quantitative analysis of the total porosity and Tb. Sp based on (c). f Representative SOFG staining of the CEP from LSI or sham mice injected with or without Yap1-AAV5. g Endplate score of the caudal endplates based on (f). h, i, j IHC of Collagen II, Collagen X and TNF-αin CEP from LSI or sham mice injected with or without Yap1-AAV5

Similar articles

Cited by

References

    1. Ni S, et al. Sensory innervation in porous endplates by Netrin-1 from osteoclasts mediates PGE2-induced spinal hypersensitivity in mice. Nat. Commun. 2019;10:5643. doi: 10.1038/s41467-019-13476-9. - DOI - PMC - PubMed
    1. Andersson GB. Epidemiological features of chronic low-back pain. Lancet. 1999;354:581–585. doi: 10.1016/S0140-6736(99)01312-4. - DOI - PubMed
    1. Centers for Disease, C. & Prevention Prevalence and most common causes of disability among adults–United States, 2005. MMWR Morb. Mortal. Wkly Rep. 58, 421–426 (2009). - PubMed
    1. Teraguchi M, et al. Prevalence and distribution of intervertebral disc degeneration over the entire spine in a population-based cohort: the Wakayama Spine Study. Osteoarthr. Cartil. 2014;22:104–110. doi: 10.1016/j.joca.2013.10.019. - DOI - PubMed
    1. Cheung KM, et al. Prevalence and pattern of lumbar magnetic resonance imaging changes in a population study of one thousand forty-three individuals. Spine (Philos. Pa 1976) 2009;34:934–940. doi: 10.1097/BRS.0b013e3181a01b3f. - DOI - PubMed

MeSH terms