

Direct comparison of mass cytometry and single-cell RNA sequencing of human peripheral blood mononuclear cells
- PMID: 38816402
- PMCID: PMC11139855
- DOI: 10.1038/s41597-024-03399-6
Direct comparison of mass cytometry and single-cell RNA sequencing of human peripheral blood mononuclear cells
Abstract
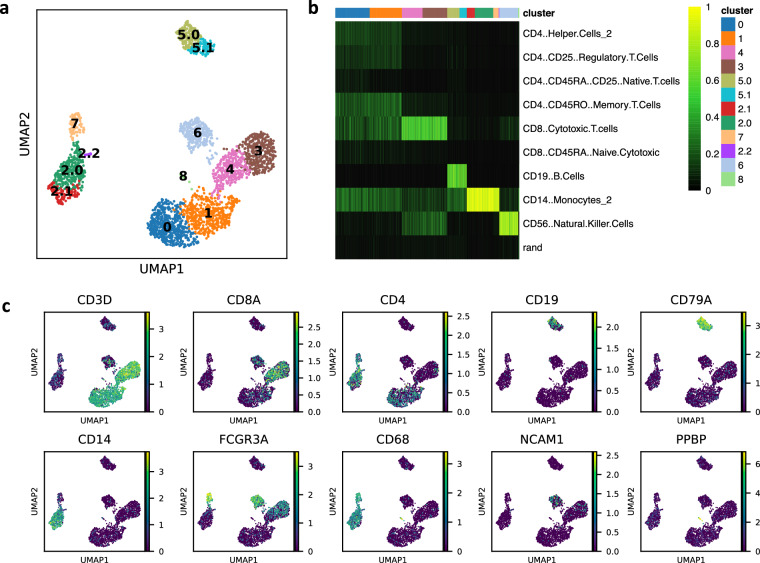
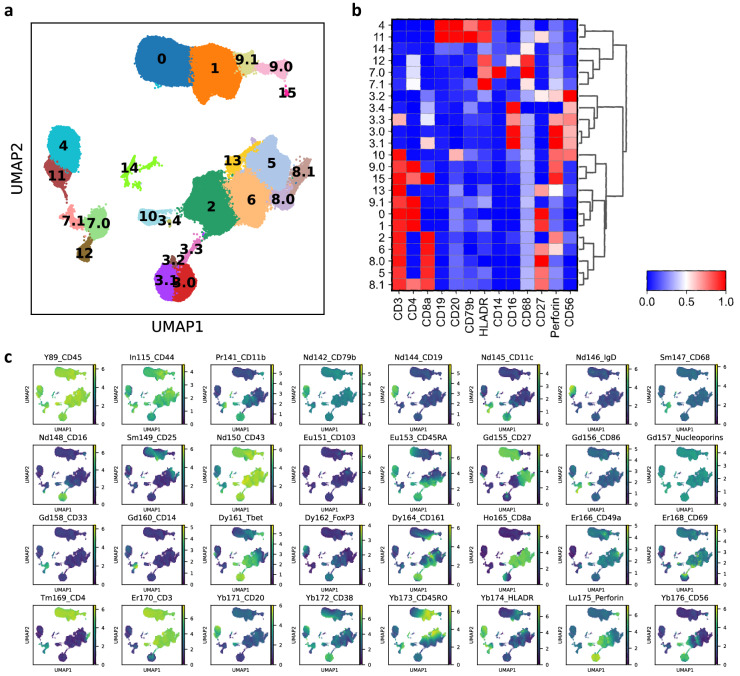
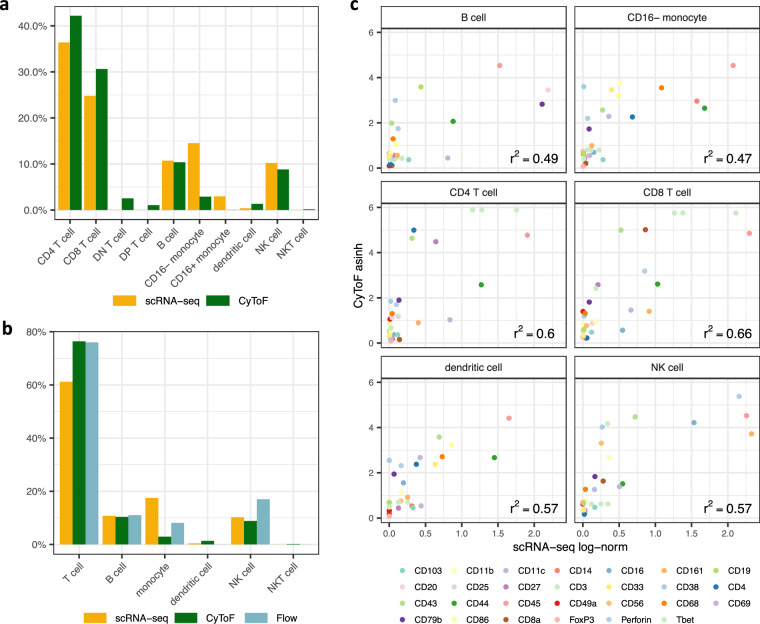
Single-cell methods offer a high-resolution approach for characterizing cell populations. Many studies rely on single-cell transcriptomics to draw conclusions regarding cell state and behavior, with the underlying assumption that transcriptomic readouts largely parallel their protein counterparts and subsequent activity. However, the relationship between transcriptomic and proteomic measurements is imprecise, and thus datasets that probe the extent of their concordance will be useful to refine such conclusions. Additionally, novel single-cell analysis tools often lack appropriate gold standard datasets for the purposes of assessment. Integrative (combining the two data modalities) and predictive (using one modality to improve results from the other) approaches in particular, would benefit from transcriptomic and proteomic data from the same sample of cells. For these reasons, we performed single-cell RNA sequencing, mass cytometry, and flow cytometry on a split-sample of human peripheral blood mononuclear cells. We directly compare the proportions of specific cell types resolved by each technique, and further describe the extent to which protein and mRNA measurements correlate within distinct cell types.
© 2024. The Author(s).
Conflict of interest statement
The authors declare no competing interests.
Figures
Similar articles
-
Combined protein and transcript single-cell RNA sequencing in human peripheral blood mononuclear cells.BMC Biol. 2022 Sep 1;20(1):193. doi: 10.1186/s12915-022-01382-4. BMC Biol. 2022. PMID: 36045343 Free PMC article.
-
CITEViz: interactively classify cell populations in CITE-Seq via a flow cytometry-like gating workflow using R-Shiny.BMC Bioinformatics. 2024 Apr 2;25(1):142. doi: 10.1186/s12859-024-05762-1. BMC Bioinformatics. 2024. PMID: 38566005 Free PMC article.
-
No detectable alloreactive transcriptional responses under standard sample preparation conditions during donor-multiplexed single-cell RNA sequencing of peripheral blood mononuclear cells.BMC Biol. 2021 Jan 20;19(1):10. doi: 10.1186/s12915-020-00941-x. BMC Biol. 2021. PMID: 33472616 Free PMC article.
-
Single-Cell High-Throughput Technologies in Cerebrospinal Fluid Research and Diagnostics.Front Immunol. 2019 Jun 11;10:1302. doi: 10.3389/fimmu.2019.01302. eCollection 2019. Front Immunol. 2019. PMID: 31244848 Free PMC article. Review.
-
Single-Cell Sequencing of Brain Cell Transcriptomes and Epigenomes.Neuron. 2021 Jan 6;109(1):11-26. doi: 10.1016/j.neuron.2020.12.010. Neuron. 2021. PMID: 33412093 Free PMC article. Review.
Cited by
-
Approaching the holistic transcriptome-convolution and deconvolution in transcriptomics.Brief Bioinform. 2025 Jul 2;26(4):bbaf388. doi: 10.1093/bib/bbaf388. Brief Bioinform. 2025. PMID: 40753537 Free PMC article. Review.
-
Exploring the molecular mechanisms of macrophages in islet transplantation using single-cell analysis.Front Immunol. 2024 Aug 29;15:1407118. doi: 10.3389/fimmu.2024.1407118. eCollection 2024. Front Immunol. 2024. PMID: 39267737 Free PMC article.
-
Single cell transcriptome profiling of immune tissues from germ-free and specific pathogen-free piglet.Sci Data. 2025 Apr 18;12(1):652. doi: 10.1038/s41597-025-04957-2. Sci Data. 2025. PMID: 40251240 Free PMC article.
References
Publication types
MeSH terms
Grants and funding
- 5R01NS111220/U.S. Department of Health & Human Services | NIH | National Institute of Neurological Disorders and Stroke (NINDS)
- R01 NS111220/NS/NINDS NIH HHS/United States
- T32 LM012416/LM/NLM NIH HHS/United States
- DGE-1746891/National Science Foundation (NSF)
- T32 GM136615/GM/NIGMS NIH HHS/United States
- 5T32GM136615/U.S. Department of Health & Human Services | NIH | National Institute of General Medical Sciences (NIGMS)
- R35 GM124725/GM/NIGMS NIH HHS/United States
- R35GM124725/U.S. Department of Health & Human Services | NIH | National Institute of General Medical Sciences (NIGMS)
- 5T32LM012416/U.S. Department of Health & Human Services | National Institutes of Health (NIH)
LinkOut - more resources
Full Text Sources
Molecular Biology Databases
