

A novel fatty acid metabolism-related signature identifies MUC4 as a novel therapy target for esophageal squamous cell carcinoma
- PMID: 38816411
- PMCID: PMC11139939
- DOI: 10.1038/s41598-024-62917-z
A novel fatty acid metabolism-related signature identifies MUC4 as a novel therapy target for esophageal squamous cell carcinoma
Abstract
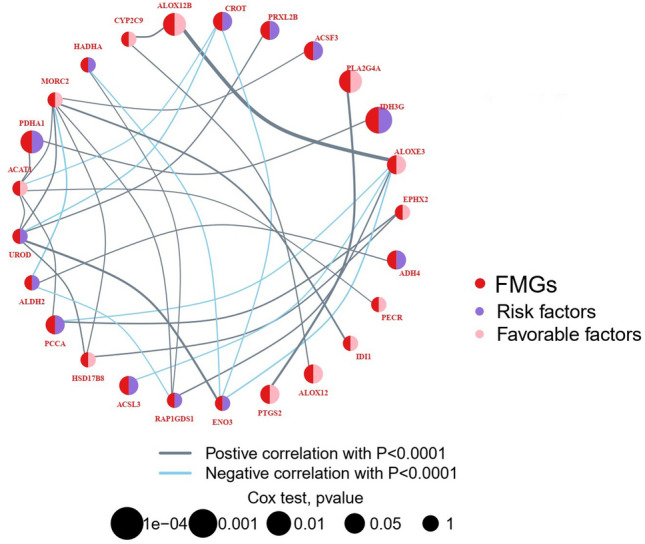
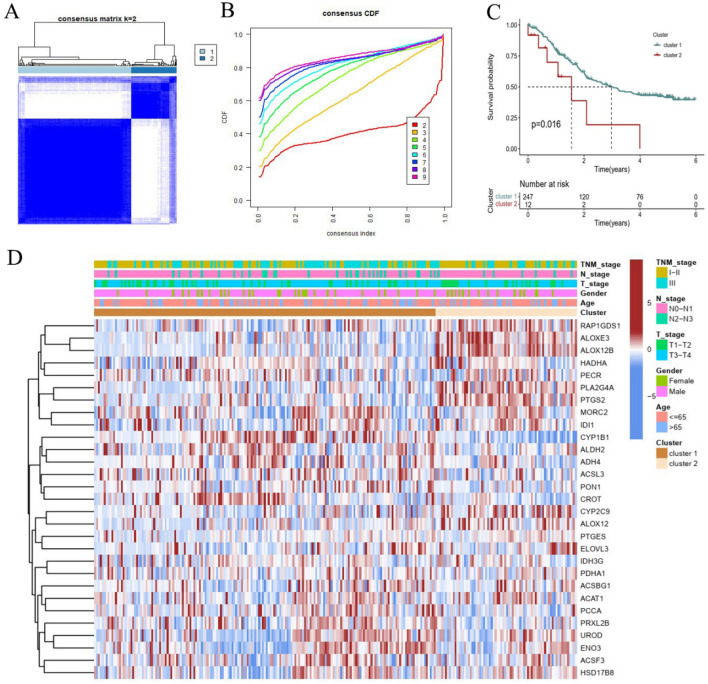
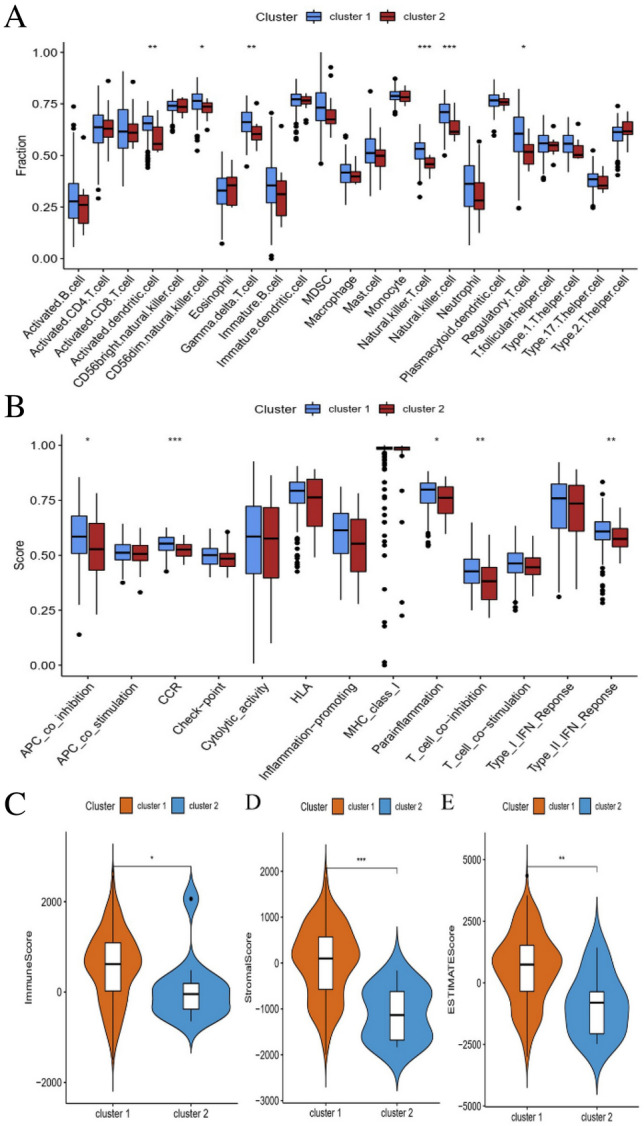
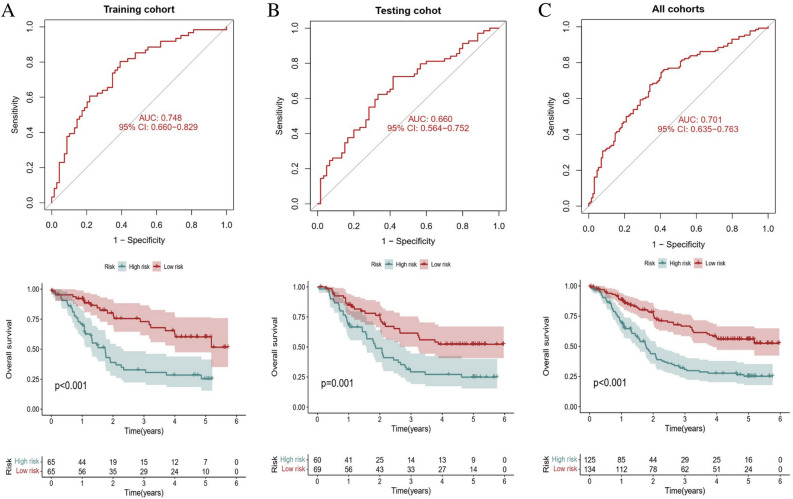
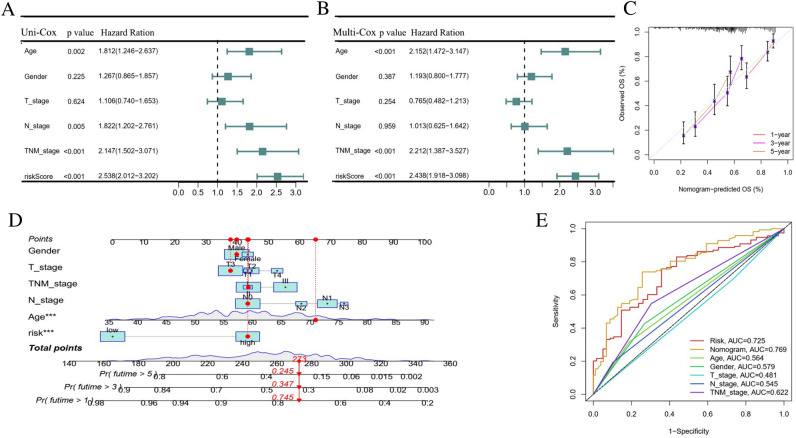
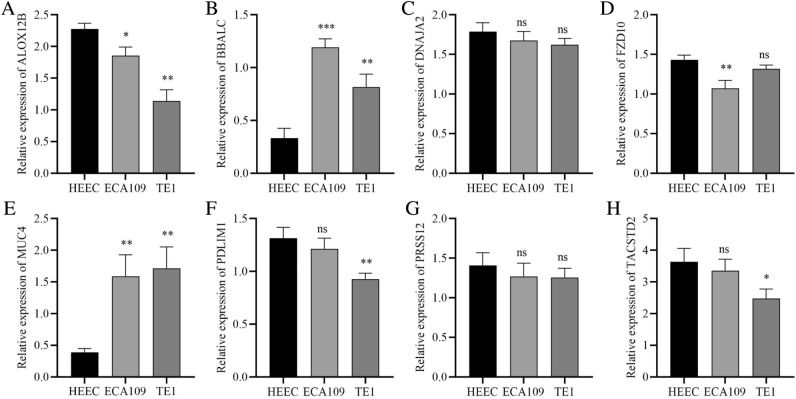
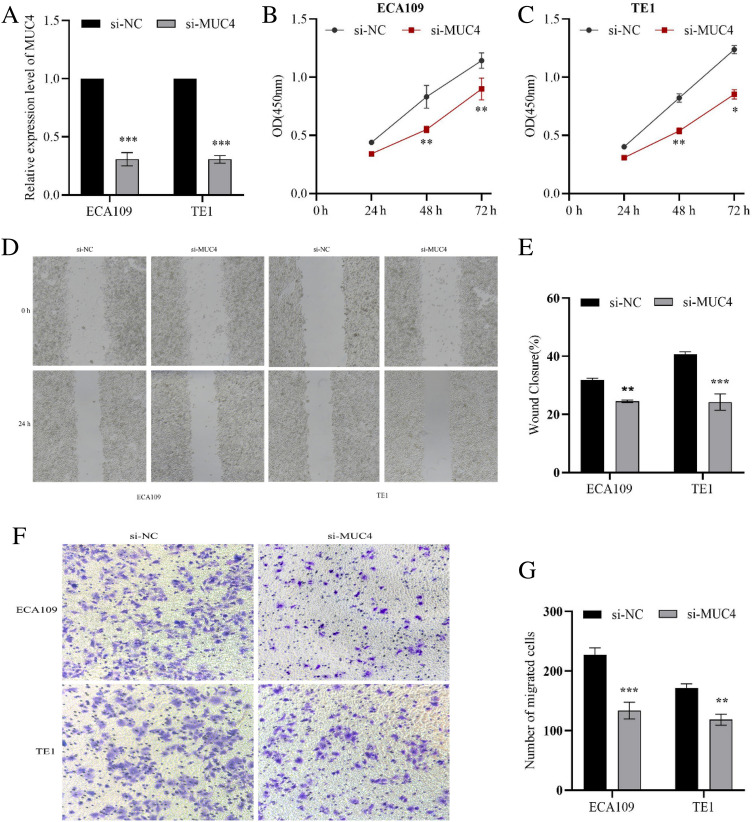
Fatty acid metabolism has been identified as an emerging hallmark of cancer, which was closely associated with cancer prognosis. Whether fatty acid metabolism-related genes (FMGs) signature play a more crucial role in biological behavior of esophageal squamous cell carcinoma (ESCC) prognosis remains unknown. Thus, we aimed to identify a reliable FMGs signature for assisting treatment decisions and prognosis evaluation of ESCC. In the present study, we conducted consensus clustering analysis on 259 publicly available ESCC samples. The clinical information was downloaded from The Cancer Genome Atlas (TCGA, 80 ESCC samples) and Gene Expression Omnibus (GEO) database (GSE53625, 179 ESCC samples). A consensus clustering arithmetic was used to determine the FMGs molecular subtypes, and survival outcomes and immune features were evaluated among the different subtypes. Kaplan-Meier analysis and the receiver operating characteristic (ROC) was applied to evaluate the reliability of the risk model in training cohort, validation cohort and all cohorts. A nomogram to predict patients' 1-year, 3-year and 5-year survival rate was also studied. Finally, CCK-8 assay, wound healing assay, and transwell assay were implemented to evaluate the inherent mechanisms of FMGs for tumorigenesis in ESCC. Two subtypes were identified by consensus clustering, of which cluster 2 is preferentially associated with poor prognosis, lower immune cell infiltration. A fatty acid (FA) metabolism-related risk model containing eight genes (FZD10, TACSTD2, MUC4, PDLIM1, PRSS12, BAALC, DNAJA2 and ALOX12B) was established. High-risk group patients displayed worse survival, higher stromal, immune and ESTIMATE scores than in the low-risk group. Moreover, a nomogram revealed good predictive ability of clinical outcomes in ESCC patients. The results of qRT-PCR analysis revealed that the MUC4 and BAALC had high expression level, and FZD10, PDLIM1, TACSTD2, ALOX12B had low expression level in ESCC cells. In vitro, silencing MUC4 remarkably inhibited ESCC cell proliferation, invasion and migration. Our study fills the gap of FMGs signature in predicting the prognosis of ESCC patients. These findings revealed that cluster subtypes and risk model of FMGs had effects on survival prediction, and were expected to be the potential promising targets for ESCC.
Keywords: Esophageal squamous cell carcinoma; Fatty acid metabolism; Immune microenvironment; Prognosis.
© 2024. The Author(s).
Conflict of interest statement
The authors declare no competing interests.
Figures


Similar articles
-
Identification of a nomogram based on long non-coding RNA to improve prognosis prediction of esophageal squamous cell carcinoma.Aging (Albany NY). 2020 Jan 24;12(2):1512-1526. doi: 10.18632/aging.102697. Epub 2020 Jan 24. Aging (Albany NY). 2020. PMID: 31978896 Free PMC article.
-
Identification and validation of an eight-lncRNA signature that predicts prognosis in patients with esophageal squamous cell carcinoma.Cell Mol Biol Lett. 2022 May 16;27(1):39. doi: 10.1186/s11658-022-00331-x. Cell Mol Biol Lett. 2022. PMID: 35578166 Free PMC article.
-
A Novel Clinical Six-Flavoprotein-Gene Signature Predicts Prognosis in Esophageal Squamous Cell Carcinoma.Biomed Res Int. 2019 Oct 30;2019:3869825. doi: 10.1155/2019/3869825. eCollection 2019. Biomed Res Int. 2019. PMID: 31815134 Free PMC article.
-
Impact of APOBEC3s on the occurrence, development and prognosis of esophageal squamous cell carcinoma.Future Oncol. 2025 Jan;21(1):117-125. doi: 10.1080/14796694.2024.2442300. Epub 2024 Dec 30. Future Oncol. 2025. PMID: 39840662 Free PMC article. Review.
-
Artificial intelligence enhances the management of esophageal squamous cell carcinoma in the precision oncology era.World J Gastroenterol. 2024 Oct 21;30(39):4267-4280. doi: 10.3748/wjg.v30.i39.4267. World J Gastroenterol. 2024. PMID: 39492825 Free PMC article. Review.
Cited by
-
Establishing a new-onset diabetes-related metabolism signature for predicting the prognosis and immune landscape in pancreatic cancer.Carcinogenesis. 2025 Apr 3;46(2):bgae072. doi: 10.1093/carcin/bgae072. Carcinogenesis. 2025. PMID: 39526455 Free PMC article.
-
Identification of fatty acid anabolism patterns to predict prognosis and immunotherapy response in gastric cancer.Discov Oncol. 2025 Jan 4;16(1):6. doi: 10.1007/s12672-025-01745-7. Discov Oncol. 2025. PMID: 39755916 Free PMC article.
References
MeSH terms
Substances
LinkOut - more resources
Full Text Sources
Medical
Molecular Biology Databases
Research Materials
Miscellaneous
