. 2024 May 30;14(1):12436.
doi: 10.1038/s41598-024-62945-9.

Machine learning models for predicting blood pressure phenotypes by combining multiple polygenic risk scores

Affiliations

Machine learning models for predicting blood pressure phenotypes by combining multiple polygenic risk scores

Yana Hrytsenko et al. Sci Rep. .

Abstract

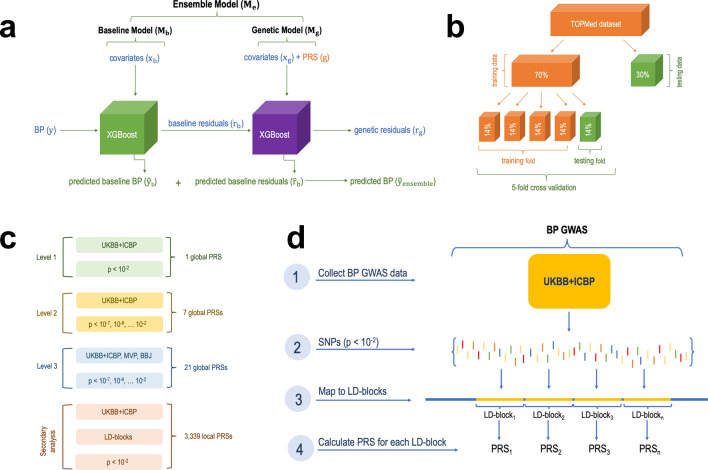
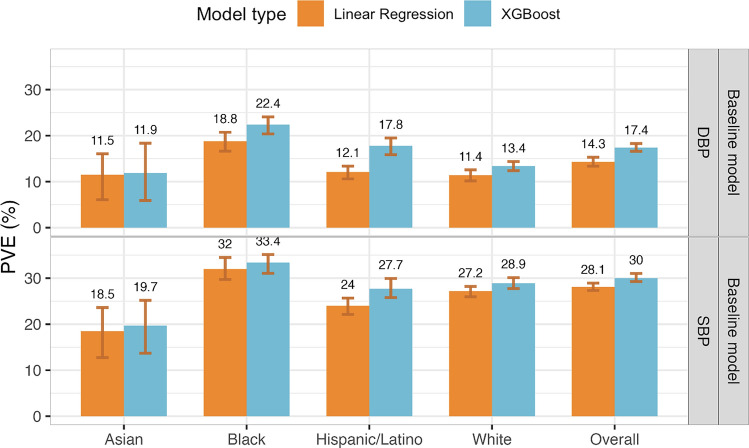
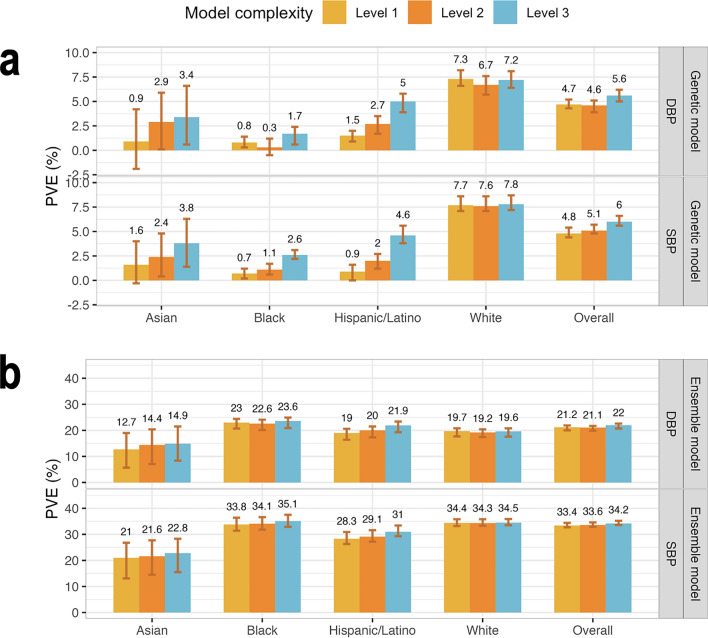
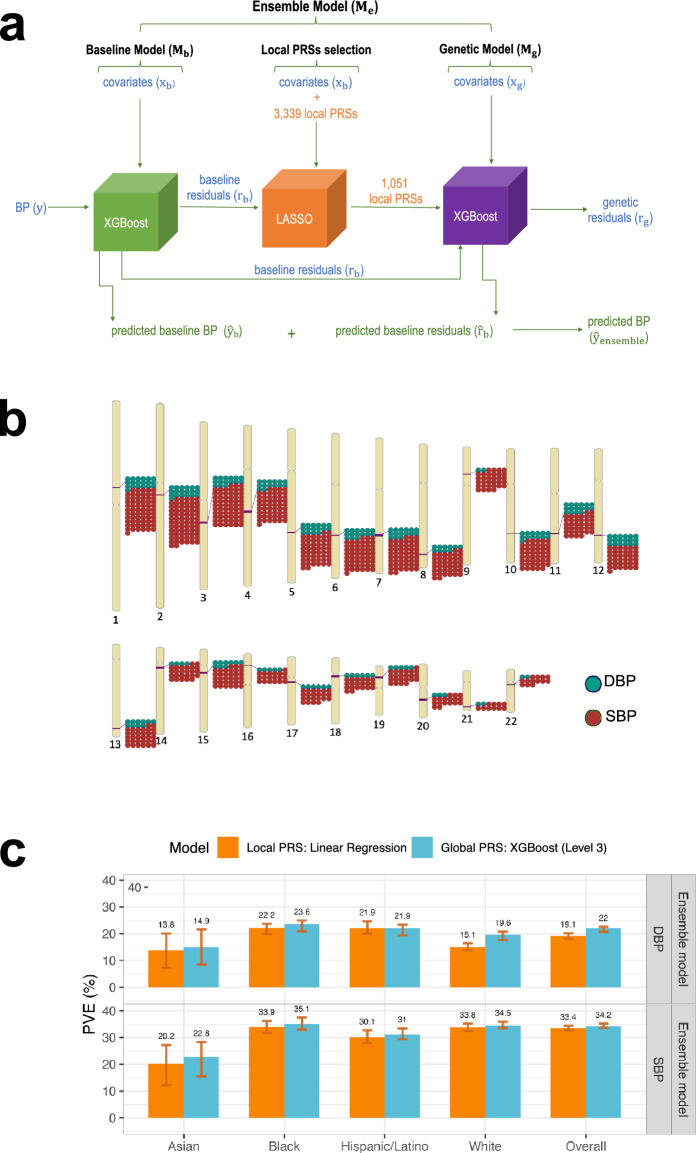
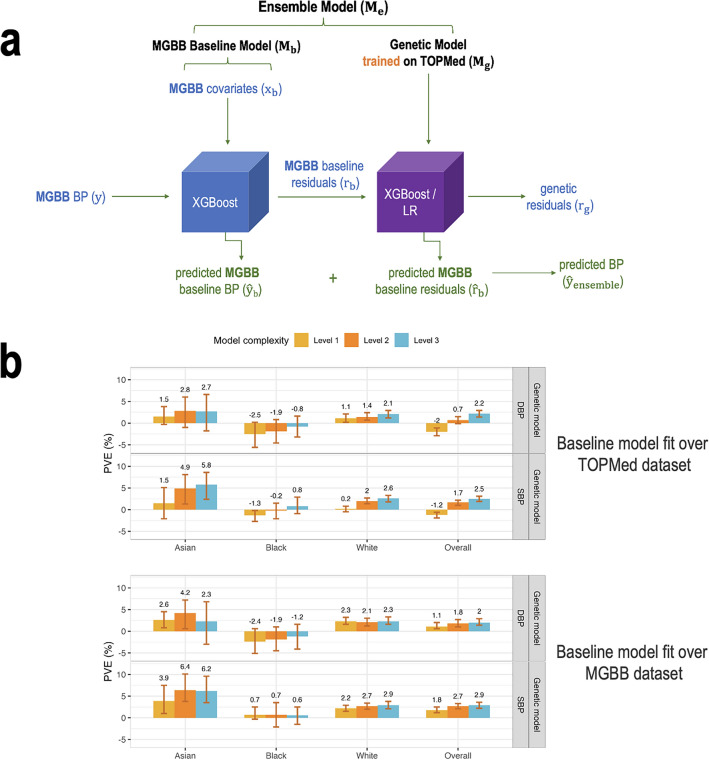
We construct non-linear machine learning (ML) prediction models for systolic and diastolic blood pressure (SBP, DBP) using demographic and clinical variables and polygenic risk scores (PRSs). We developed a two-model ensemble, consisting of a baseline model, where prediction is based on demographic and clinical variables only, and a genetic model, where we also include PRSs. We evaluate the use of a linear versus a non-linear model at both the baseline and the genetic model levels and assess the improvement in performance when incorporating multiple PRSs. We report the ensemble model's performance as percentage variance explained (PVE) on a held-out test dataset. A non-linear baseline model improved the PVEs from 28.1 to 30.1% (SBP) and 14.3% to 17.4% (DBP) compared with a linear baseline model. Including seven PRSs in the genetic model computed based on the largest available GWAS of SBP/DBP improved the genetic model PVE from 4.8 to 5.1% (SBP) and 4.7 to 5% (DBP) compared to using a single PRS. Adding additional 14 PRSs computed based on two independent GWASs further increased the genetic model PVE to 6.3% (SBP) and 5.7% (DBP). PVE differed across self-reported race/ethnicity groups, with primarily all non-White groups benefitting from the inclusion of additional PRSs. In summary, non-linear ML models improves BP prediction in models incorporating diverse populations.


Conflict of interest statement

B Psaty serves on the Steering Committee of the Yale Open Data Access Project funded by Johnson & Johnson. G Lyons is currently a full time employee of Alexion, AstraZeneca Rare Disease, and hold stock in the company, however, her contributions to the present manuscript were performed as part of her previous affiliation at the Harvard T.H. Chan School of Public Health and this work is not related to her current occupation and affiliation. M Moll has received grant funding from Bayer and consulting fees from TriNetX, 2ndMD, TheaHealth, Sitka, Verona Pharma, and Axon Advisors. All other authors report no competing interests.

Figures

Figure 1
Figure 1
Study design. (a) The proposed ensemble model framework. The ensemble is composed of two models. The baseline model, trained on covariates (Xb) only for prediction of SBP and DBP (y^b). To assess the accuracy of the baseline model we calculated the residuals (baseline residuals rb) by subtracting the predicted value of SBP/DBP from the actual value of SBP/DBP. The genetic model was trained on a subset of the covariates, and genetic components (global PRSs) for prediction of the baseline model residuals rb. We measured the accuracy of the genetic model by subtracting predicted genetic residuals r^g from baseline residuals rb. The overall prediction of BP by the ensemble model is the sum of the predicted baseline BP y^b (by the baseline model) and the predicted baseline residuals r^b (by the genetic model). The accuracy of the ensemble model was assessed by calculating percent variance explained (PVE) by two models jointly. (b) The split of the primary, TOPMed dataset, into training and testing sets followed by the fivefold cross validation procedure where the training dataset is further split into 5 equal parts with one part designated for testing (repeated 5 times with 1/5 of the training data being designated at random for testing at each iteration). (c) Increasing levels of genetic models’ complexity where each new model included additional PRSs. (d) The process of calculating local PRSs per LD-blocks (secondary analysis). BBJ BioBank Japan, BP blood pressure, GWAS genome wide association study, LD linkage disequilibrium, Level model complexity level, MVP Million Veteran Program, P p-value threshold, PRS polygenic risk score, SNPs single-nucleotide polymorphisms, TOPMed Trans-Omics for Precision Medicine, UKBB + ICBP UK Biobank and International Consortium for Blood Pressure.
Figure 2
Figure 2
Estimated phenotypic PVE of baseline models fitted using non-linear ML and linear models. Estimated PVEs in the TOPMed test dataset for baseline model performance for prediction of SBP and DBP in the overall test dataset and stratified by self-reported race/ethnicity (White N = 10,877, Hispanic/Latino N = 3831, Black N = 3657, Asian N = 403 for DBP; White N = 10,823, Hispanic/Latino N = 3877, Black N = 3674, Asian N = 374 for SBP). The visualized 95% confidence intervals were computed as the 2.5% and 97.5% percentiles of the bootstrap distribution of the PVEs estimated over the test dataset. PVE percent variance explained, TOPMed Trans-Omics for Precision Medicine, SBP systolic blood pressure, DBP diastolic blood pressure.
Figure 3
Figure 3
Comparison of genetic and ensemble model performance in TOPMed test dataset. (a) Estimated PVEs in the TOPMed test dataset obtained by genetic models incorporating one or more PRSs according to the three complexity levels. Level 1: a single PRS based on the UKBB + ICBP GWAS. Level 2: PRSs based on the UKBB + ICBP GWAS based on seven p-value thresholds. Level 3: 21 PRSs, 7 PRSs based on each of the UKBB + ICBP, MVP, and BBJ GWAS. PVE is reported for predicting residuals from the baseline model, where the baseline model was a non-linear ML model and only used non-genetic covariates. (b) Estimated PVEs in the TOPMed test dataset for ensemble model at the raw phenotypic level. PVEs are reported for models of SBP and DBP, in the overall test dataset and stratified by self-reported race/ethnicity (White N = 10,877, Hispanic/Latino N = 3831, Black N = 3657, Asian N = 403 for DBP; White N = 10,823, Hispanic/Latino N = 3877, Black N = 3674, Asian N = 374 for SBP). The visualized 95% confidence intervals were computed as the 2.5% and 97.5% percentiles of the bootstrap distribution of the PVEs estimated over the test dataset. PVE percent variance explained, TOPMed Trans-Omics for Precision Medicine, SBP systolic blood pressure, DBP diastolic blood pressure, PRS polygenic risk score.
Figure 4
Figure 4
Integration of LASSO feature selection tool into the ensemble model workflow. (a) The workflow of the ensemble model with the integration of the LASSO variable selection tool. To include local PRSs in the ensemble model while attempting to avoid overfitting, we added a LASSO selection step to the ensemble model development. As visualized, the residuals of the baseline model were used as the outcome in LASSO penalized regression with the local PRSs as features. LASSO substantially reduced the number of local PRSs (to 827 for SBP and 224 for DBP). The local PRSs selected by LASSO were then used as an input into the genetic model for prediction of the baseline residuals (r^b). (b) Genomic locations of local PRSs, calculated over predefined LD-regions, selected by LASSO for SBP and DBP. (c) Comparison between the estimated PVE in the TOPMed test dataset for ensemble model Level 3 using global PRSs and the ensemble model using Linear regression and local PRSs. PVEs are reported for models of SBP and DBP, in the overall test dataset and stratified by self-reported race/ethnicity (White N = 10,877, Hispanic/Latino N = 3831, Black N = 3657, Asian N = 403 for DBP; White N = 10,823, Hispanic/Latino N = 3877, Black N = 3674, Asian N = 374 for SBP). The visualized 95% confidence intervals were computed as the 2.5% and 97.5% percentiles of the bootstrap distribution of the PVEs estimated over the test dataset. BP blood pressure, DBP diastolic blood pressure, LASSO least absolute shrinkage and selection operator, PRS polygenic risk score, SBP systolic blood pressure.
Figure 5
Figure 5
Application of the model trained on the TOPMed dataset to the MGBB data. (a) The figure visualizes the workflow of the Ensemble model with the baseline being trained on the MGBB dataset and application of the genetic models, trained on the TOPMed data, incorporating one or more PRSs according to the three model complexity levels. Level 1: a single PRS based on the UKBB + ICBP GWAS. Level 2: seven PRSs based on the UKBB + ICBP GWAS, difference p-value thresholds. Level 3: 21 PRSs, 7 PRSs based on each of the UKBB + ICBP, MVP, and BBJ GWAS. (b) Estimated PVE in the MGBB test dataset for XGBoost genetic models fitted on the TOPMed dataset of three levels of complexity with baseline model fitted using TOPMed baseline model weights (top) and using MGBB baseline model weights (bottom). PVEs are shown for the performance in prediction of the second order of residuals for SBP and DBP phenotypes in the overall test dataset and stratified by race/ethnicity (White N = 7985, Black N = 412, Asian N = 200). BP blood pressure, MGBB Mass General Brigham Biobank, PRS polygenic risk score, TOPMed trans-omics in precision medicine project.

Update of

Similar articles

  • Machine learning models for blood pressure phenotypes combining multiple polygenic risk scores.
    Hrytsenko Y, Shea B, Elgart M, Kurniansyah N, Lyons G, Morrison AC, Carson AP, Haring B, Mitchel BD, Psaty BM, Jaeger BC, Gu CC, Kooperberg C, Levy D, Lloyd-Jones D, Choi E, Brody JA, Smith JA, Rotter JI, Moll M, Fornage M, Simon N, Castaldi P, Casanova R, Chung RH, Kaplan R, Loos RJF, Kardia SLR, Rich SS, Redline S, Kelly T, O'Connor T, Zhao W, Kim W, Guo X, Der Ida Chen Y; Trans-Omics in Precision Medicine Consortium; Sofer T. Hrytsenko Y, et al. medRxiv [Preprint]. 2023 Dec 14:2023.12.13.23299909. doi: 10.1101/2023.12.13.23299909. medRxiv. 2023. Update in: Sci Rep. 2024 May 30;14(1):12436. doi: 10.1038/s41598-024-62945-9. PMID: 38168328 Free PMC article. Updated. Preprint.
  • Evaluating the use of blood pressure polygenic risk scores across race/ethnic background groups.
    Kurniansyah N, Goodman MO, Khan AT, Wang J, Feofanova E, Bis JC, Wiggins KL, Huffman JE, Kelly T, Elfassy T, Guo X, Palmas W, Lin HJ, Hwang SJ, Gao Y, Young K, Kinney GL, Smith JA, Yu B, Liu S, Wassertheil-Smoller S, Manson JE, Zhu X, Chen YI, Lee IT, Gu CC, Lloyd-Jones DM, Zöllner S, Fornage M, Kooperberg C, Correa A, Psaty BM, Arnett DK, Isasi CR, Rich SS, Kaplan RC, Redline S, Mitchell BD, Franceschini N, Levy D, Rotter JI, Morrison AC, Sofer T. Kurniansyah N, et al. Nat Commun. 2023 Jun 2;14(1):3202. doi: 10.1038/s41467-023-38990-9. Nat Commun. 2023. PMID: 37268629 Free PMC article.
  • Preeclampsia prediction with maternal and paternal polygenic risk scores: the TMM BirThree Cohort Study.
    Ohseto H, Ishikuro M, Obara T, Narita A, Takahashi I, Shinoda G, Noda A, Murakami K, Orui M, Iwama N, Kikuya M, Metoki H, Sugawara J, Tamiya G, Kuriyama S. Ohseto H, et al. Sci Rep. 2025 Apr 21;15(1):13743. doi: 10.1038/s41598-025-97291-x. Sci Rep. 2025. PMID: 40258933 Free PMC article.
  • Polygenic risk scores in kidney transplantation.
    Jelencsics K, Oberbauer R. Jelencsics K, et al. Curr Opin Organ Transplant. 2025 Jun 1;30(3):208-214. doi: 10.1097/MOT.0000000000001212. Epub 2025 Apr 1. Curr Opin Organ Transplant. 2025. PMID: 40171629 Review.
  • Implementation and implications for polygenic risk scores in healthcare.
    Slunecka JL, van der Zee MD, Beck JJ, Johnson BN, Finnicum CT, Pool R, Hottenga JJ, de Geus EJC, Ehli EA. Slunecka JL, et al. Hum Genomics. 2021 Jul 20;15(1):46. doi: 10.1186/s40246-021-00339-y. Hum Genomics. 2021. PMID: 34284826 Free PMC article. Review.

Cited by

References

    1. Torkamani A, Wineinger NE, Topol EJ. The personal and clinical utility of polygenic risk scores. Nat. Rev. Genet. 2018;19(9):581–590. doi: 10.1038/s41576-018-0018-x. - DOI - PubMed
    1. Choi SW, Mak TS, O’Reilly PF. Tutorial: A guide to performing polygenic risk score analyses. Nat. Protoc. 2020;15(9):2759–2772. doi: 10.1038/s41596-020-0353-1. - DOI - PMC - PubMed
    1. Ho DSW, et al. Machine learning SNP based prediction for precision medicine. Front. Genet. 2019;10:1. doi: 10.3389/fgene.2019.00267. - DOI - PMC - PubMed
    1. Elgart M, et al. Non-linear machine learning models incorporating SNPs and PRS improve polygenic prediction in diverse human populations. Commun. Biol. 2022;5(1):856. doi: 10.1038/s42003-022-03812-z. - DOI - PMC - PubMed
    1. Tibshirani R. Regression shrinkage and selection via the Lasso. J. R. Stat. Soc. Ser. B (Methodol.) 1996;58(1):267–288. doi: 10.1111/j.2517-6161.1996.tb02080.x. - DOI