. 2024 May 30;15(1):4609.
doi: 10.1038/s41467-024-48988-6.

TCAF1 promotes TRPV2-mediated Ca2+ release in response to cytosolic DNA to protect stressed replication forks

Affiliations

TCAF1 promotes TRPV2-mediated Ca2+ release in response to cytosolic DNA to protect stressed replication forks

Lingzhen Kong et al. Nat Commun. .

Abstract

The protection of the replication fork structure under stress conditions is essential for genome maintenance and cancer prevention. A key signaling pathway for fork protection involves TRPV2-mediated Ca2+ release from the ER, which is triggered after the generation of cytosolic DNA and the activation of cGAS/STING. This results in CaMKK2/AMPK activation and subsequent Exo1 phosphorylation, which prevent aberrant fork processing, thereby ensuring genome stability. However, it remains poorly understood how the TRPV2 channel is activated by the presence of cytosolic DNA. Here, through a genome-wide CRISPR-based screen, we identify TRPM8 channel-associated factor 1 (TCAF1) as a key factor promoting TRPV2-mediated Ca2+ release under replication stress or other conditions that activate cGAS/STING. Mechanistically, TCAF1 assists Ca2+ release by facilitating the dissociation of STING from TRPV2, thereby relieving TRPV2 repression. Consistent with this function, TCAF1 is required for fork protection, chromosomal stability, and cell survival after replication stress.


Conflict of interest statement

The authors declare no competing interests.

Figures
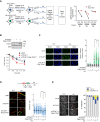
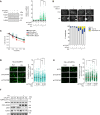
Fig. 1
Fig. 1. TCAF1 is required for replication fork protection, chromosome stability maintenance, and cell survival upon replication stress.
A Left panel: Experimental scheme of a genome-wide CRISPR knockout screen for identifying new factors that promote cell survival in the presence of replication stress by suppressing Exo1 function. Right panel: Changes in the relative abundance of the three TCAF1 sgRNAs detected in the sgRNA library after HU treatment (4 mM, 24 h) in WT and Exo1-KO HeLa cells. The relative abundance of the sgRNAs in H2O-treated samples was normalized to 1. Note that the other three sgRNAs for TCAF1 in the original library were not detected by deep sequencing. B Upper panel: Western blot analysis of TCAF1 knockdown by a UTR-targeting shRNA (#2) and the expression of Flag-TCAF1 in TCAF1-knockdown HeLa cells. *, nonspecific bands. Bottom panel: Effects of TCAF1 knockdown on cell survival and its rescue by Flag-TCAF1 expression after treatment with indicated concentrations of HU for 24 h. Data represent mean ± S.D. from triplicates. *, p ≤ 0.05 (two-tailed, unpaired t-test). See the source data for the exact P values. C Effects of TCAF1 knockdown on replication fork resection detected using a native BrdU IF assay, and the rescue of fork resection by Flag-TCAF1 expression after HU treatment (2 mM, 5 h). Left panel: Representative BrdU IF images for the indicated samples (scale bar, 25 μm). Right panel: Quantified BrdU signal. Cells with a BrdU signal higher than the majority (98%) of H2O-treated control cells (gray dots) were taken as BrdU-positive (green dots). Red bars represent the mean BrdU intensity of BrdU-positive cells. At least 1,000 cells were analyzed for each sample. n = 3, ****p ≤ 0.0001. **p ≤ 0.01(two-tailed, unpaired t-test). See the source data for the exact P values. Outlier signals were removed through ROUT (Q = 1%) analysis. D Effects of TCAF1 knockdown on fork resection detected using a DNA fiber assay, and the rescue of fork resection by Flag-TCAF1 expression after HU treatment (4 mM, 2 h). Upper panel: Experimental scheme (see Methods). Bottom left panel: representative images of DNA fibers for the indicated samples. Bottom right panel: dot plot of the CIdU/IdU track lengths ratio. Black bars represent the median. At least 200 tracks were scored for each sample. ****p ≤ 0.0001. ***p ≤ 0.001 (two-tailed, unpaired t-test). See the source data for the exact P values. E Effects of TCAF1 knockdown on chromosomal integrity analyzed using a metaphase spreading assay, and the rescue of chromosomal integrity by Flag-TCAF1 expression after HU treatment (4 mM, 4 h). Left panel: Representative images of metaphase chromosome spreads for the indicated samples (scale bar, 25 μm). Chromosomal aberrations are marked by arrows. Right panel: Quantified result of the samples depicted in the left panel. 150 metaphases from three independent experiments were examined for each sample. Source data are provided as a Source Data file.
Fig. 2
Fig. 2. TCAF1 protects replication forks under stress through the Ca2+-CaMKK2-AMPK-Exo1 signaling pathway.
A Left panel: siRNA-mediated knockdown of Exo1 in control- and TCAF1-knockdown HeLa cells. Right panel: Effects of Exo1 knockdown on fork resection in control-knockdown and TCAF1-knockdown cells treated with HU (2 mM, 5 h) or H2O. Red bars represent the mean BrdU intensity of BrdU-positive cells. At least 1,000 cells were analyzed for each sample. n = 3, ****, p ≤ 0.0001 (two-tailed, unpaired t-test). See the source data for the exact P values. B Effects of Exo1 knockdown on chromosomal stability in control-knockdown and TCAF1-knockdown HeLa cells after HU (4 mM, 4 h) or H2O treatment. Top panel: Representative images of metaphase chromosome spreads for the indicated samples (scale bar, 25 μm). Chromosomal aberrations are marked by arrows. Bottom panel: Quantified result of the samples depicted in the top panel. 150 metaphases from three independent experiments were examined for each sample. C Effects of Exo1 knockdown on the clonogenic survival of control-knockdown and TCAF1-knockdown HeLa cells treated with indicated concentrations of HU for 24 h. Data represent mean ± S.D. from triplicates. **, p ≤ 0.01 (two-tailed, unpaired t-test). See the source data for the exact P values. D Effects of TCAF1 knockdown on HU-induced ER Ca2+ release in HeLa cells. Left panel: Representative images of the GCaMPer signal (scale bar, 25 μm). Right panel: Quantified GCaMPer signal in S phase-synchronized cells treated with HU (4 mM, 4 h) or H2O. 250 cells were scored for each sample. Black bars represent the mean. n = 3, ****, p ≤ 0.0001 (two-tailed, unpaired t-test). See the source data for the exact P values. E Effects of TCAF1 knockdown on HU-induced iCa2+ elevation in HeLa cells. Left panel: Representative images of the GCaMP6s signal (scale bar, 25 μm). Right panel: Quantified GCaMP6s signal in S phase-synchronized cells treated with HU (4 mM, 4 h) or H2O. 250 cells were scored for each sample. Red bars represent the mean. n = 3, ****, p ≤ 0.0001 (two-tailed, unpaired t-test). See the source data for the exact P values. F Effects of TCAF1 knockdown on HU-induced T172-phosphorylation of AMPKα and S345-phosphorylation of Chk1 in HeLa cells treated with HU (4 mM, 6 h) or H2O. Source data are provided as a Source Data file.
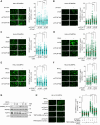
Fig. 3
Fig. 3. TCAF1 is required for Ca2+ release in response to cytosolic DNA or direct cGAS activation.
A Effects of TCAF1 knockdown on ER Ca2+ release induced by Trex1 knockdown in HeLa cells. Left panel: representative images of GCaMPer signal (scale bar, 25 μm). Right panel: quantified GCaMPer signals in the samples depicted in the left panel. 250 cells were scored for the GCaMPer signal in each sample. Black bars represent the median. n = 3, ****, p ≤ 0.0001 (two-tailed, unpaired t-test). See the source data for the exact P values. B Effects of TCAF1 knockdown on iCa2+ elevation induced by Trex1 knockdown in HeLa cells. Left panel: representative images of GCaMP6s signal (scale bar, 25 μm). Right panel: quantified GCaMP6s signals in the samples depicted in the left panel. 250 cells were scored for each sample. Red bars represent the median. n = 3, ****, p ≤ 0.0001 (two-tailed, unpaired t-test). See the source data for the exact P values. C Effects of TCAF1 knockdown on ER Ca2+ release induced by DNA transfection in HeLa cells. HeLa cells were transfected with plasmid DNA (2 μg/ml), and the GCaMPer signal was imaged 7 h after transfection. Left panel: representative images of GCaMPer signal (scale bar, 25 μm). Right panel: quantified GCaMPer signals in the samples depicted in the left panel. 250 cells were scored for each sample. Black bars represent the mean. n = 3, ****, p ≤ 0.0001 (two-tailed, unpaired t-test). See the source data for the exact P values. D Effects of TCAF1 knockdown on iCa2+ elevation induced by plasmid DNA transfection (2 μg/ml, 7 h) in HeLa cells. Left panel: representative images of GCaMP6s signal (scale bar, 25 μm). Right panel: quantified GCaMP6s signals in the samples depicted in the left panel. 250 cells were scored for each sample. Black bars represent the mean. n = 3, ****, p ≤ 0.0001 (two-tailed, unpaired t-test). See the source data for the exact P values. E Effects of TCAF1 knockdown on ER Ca2+ release induced by MnCl2 treatment (0.5 mM, 1.5 h) in HeLa cells. Left panel: representative images of GCaMPer signal (scale bar, 25 μm). Right panel: quantified GCaMPer signals in the samples depicted in the left panel. 250 cells were scored for each sample. Black bars represent the mean. n = 3, ****, p ≤ 0.0001 (two-tailed, unpaired t-test). See the source data for the exact P values. Outlier signals were removed through ROUT (Q = 1%) analysis. F Effects of TCAF1 knockdown on iCa2+ elevation induced by MnCl2 treatment (0.5 mM, 1.5 h) in HeLa cells. Left panel: representative images of GCaMP6s signal (scale bar, 25 μm). Right panel: quantified GCaMP6s signals in the samples depicted in the left panel. 250 cells were scored for each sample. Red bars represent the mean. n = 3, ****, p ≤ 0.0001 (two-tailed, unpaired t-test). See the source data for the exact P values. Outlier signals were removed through ROUT (Q = 1%) analysis. G Effects of TCAF1 knockdown on AMPKα-phosphorylation at T172 in HeLa cells after MnCl2 treatment (2.5 mM, 4 h). H Effect of TRPV2(DN) expression on iCa2+ elevation in control-knockdown and TCAF1-knockdown HeLa cells after MnCl2 treatment (0.5 mM, 1.5 h). Left panel: representative images of GCaMP6s signal (scale bar, 25 μm). Right panel: quantified GCaMP6s signals in the samples depicted in the left panel. 250 cells were scored for each sample. Red bars represent the mean. n = 3, ****, p ≤ 0.0001 (two-tailed, unpaired t-test). See the source data for the exact P values. Source data are provided as a Source Data file.
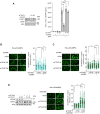
Fig. 4
Fig. 4. TCAF1 promotes iCa2+ elevation downstream of cGAMP.
A Left panel: Western blot analysis siRNA-mediated knockdown of TCAF1 or cGAS in HeLa cells. *, nonspecific bands. Right panel: ELISA analysis of 2’3’-cGAMP concentration in HeLa cells transfected with plasmid DNA (2 μg/ml, 7 h). Data represent mean ± S.D. from triplicate. **, p ≤ 0.01 (two-tailed, unpaired t-test). See the source data for the exact P values. B Effects of TCAF1 knockdown on ER Ca2+ release induced by cGAMP in HeLa cells. Cells were transfected with cGAMP (5 μg/ml), and the GCaMPer signal was imaged 7 h after transfection. Left panel: representative images of GCaMPer signal (scale bar, 25 μm). Right panel: quantified GCaMPer signals in the samples depicted in the left panel. 250 cells were scored for each sample. Black bars represent the mean. n = 3, ****, p ≤ 0.0001 (two-tailed, unpaired t-test). See the source data for the exact P values. Outlier signals were removed through ROUT (Q = 1%) analysis. C Effects of TCAF1 knockdown on iCa2+ elevation induced by cGAMP in HeLa cells. Cells were transfected with cGAMP (5 μg/ml), and the GCaMP6s signal was imaged 7 h after transfection. Left panel: representative images of GCaMP6s signal (scale bar, 25 μm). Right panel: quantified GCaMP6s signals in the samples depicted in the left panel. 250 cells were scored for each sample. Red bars represent the mean. n = 3, ****, p ≤ 0.0001 (two-tailed, unpaired t-test). See the source data for the exact P values. D Effects of TCAF1 knockdown on iCa2+ elevation induced by STING depletion in HeLa cells. Left panel: Western blot analysis shows the depletion of TCAF1 and STING in HeLa-GCaMP6s cells. Middle panel: representative images of GCaMP6s signal (scale bar, 25 μm). Right panel: quantified GCaMP6s signals in the samples depicted in the middle panel. 250 cells were scored for GCaMP6s signal in each sample. Red bars represent the mean. n = 3, ****, p ≤ 0.0001 (two-tailed, unpaired t-test). See the source data for the exact P values. Source data are provided as a Source Data file.
Fig. 5
Fig. 5. TCAF1 promotes the dissociation of STING from TRPV2 in response to cytosolic DNA or direct STING activation.
A Left panel: Representative images of PLA signal of TRPV2-Flag and STING-HA in control-knockdown or TCAF1-knockdown HeLa cells transfected with plasmid DNA (2 μg/ml, 7 h) (scale bar, 25 μm), transfected DNA are marked by arrows. Right panel: Quantified PLA signal of 150 cells of the samples depicted in the left panel. Black bars represent the mean. n = 3, ****, p ≤ 0.0001 (two-tailed, unpaired t-test). See the source data for the exact P values. B Left panel: Representative images of PLA signal of TRPV2-Flag and STING-HA in control-knockdown or TCAF1-knockdown HeLa cells transfected with cGAMP (5 µg/ml, 7 h) (scale bar, 25 μm). Right panel: Quantified PLA signal of 150 cells of the samples depicted in the left panel. Black bars represent the mean. n = 3, ****, p ≤ 0.0001. **, p ≤ 0.01 (two-tailed, unpaired t-test). See the source data for the exact P values. C Effects of TCAF1 knockdown on the dissociation of STING from TRPV2 induced by cytosolic DNA. Left panel: Representative co-IP result for TRPV2-Flag and STING-HA in control- or TCAF1-knockdown HeLa cells after plasmid DNA transfection (2 µg/ml, 7 h). *, nonspecific bands. Right panel: Quantified IP/Input ratios for STING-HA. Data represent mean ± S.D., n = 3 **, p ≤ 0.01. *, p ≤ 0.05 (two-tailed, unpaired t-test). See the source data for the exact P values. D Result of co-IP for Flag-TCAF1 and STING-HA (left panel) and for Flag-TCAF1 and TRPV2-mCherry (right panel) in 293 T cells. E Result of co-IP on the effects of STING knockdown on the association between TCAF1 and TRPV2 in 293 T cells. F Result of co-IP on the effects of TRPV2 knockdown on the association between TCAF1 and STING in 293 T cells. G Left panel: Representative co-IP result for the association of Flag-TCAF1 with STING(WT)-HA or STING(FTW/AAS)-HA in 293 T cells. Right Panel: Quantified IP/Input ratios for STING-HA from three independent experiments. Data represent mean ± S.D., n = 3, **, p ≤ 0.01 (two-tailed, unpaired t-test). See the source data for the exact P values. H Effects of DNA transfection on the association between Flag-TCAF1 and STING-HA. Left panel: Representative images of PLA signal of Flag-TCAF1 and STING-HA in HeLa cells transfected with or without plasmid DNA (2 µg/ml, 7 h) (scale bar, 25 μm), transfected DNA are marked by arrows. Right panel: Quantified PLA signal of 150 cells of the samples depicted in the left panel. Black bars represent the mean. n = 3, ****, p ≤ 0.0001 (two-tailed, unpaired t-test). See the source data for the exact P values. I Effects of DNA transfection on the association between Flag-TCAF1 and TRPV2-HA. Left panel: Representative images of PLA signal of Flag-TCAF1 and TRPV2-HA in HeLa cells transfected with plasmid DNA (2 µg/ml, 7 h) (scale bar, 25 μm), transfected DNA are marked by arrows. Right panel: Quantified PLA signal of 150 cells of the samples depicted in the left panel. Black bars represent the mean. n = 3. n.s., not significant. See the source data for the exact P values.
Fig. 6
Fig. 6. TCAF1 promotes fork protection by facilitating STING-TRPV2 dissociation and subsequent Ca2+ release in response to cytosolic DNA induced by replication stress.
A model for the role of TCAF1 in the cytosolic DNA-triggered, TRPV2/Ca2+-dependent replication fork protection pathway (see text for details). Figure 6 was created with BioRender.com released under a Creative Commons Attribution-NonCommercial-NoDerivs 4.0 International license.

References

    1. Zeman MK, Cimprich KA. Causes and consequences of replication stress. Nat. Cell Biol. 2014;16:2–9. doi: 10.1038/ncb2897. - DOI - PMC - PubMed
    1. Tubbs A, Nussenzweig A. Endogenous DNA Damage as a Source of Genomic Instability in Cancer. Cell. 2017;168:644–656. doi: 10.1016/j.cell.2017.01.002. - DOI - PMC - PubMed
    1. Cybulla E, Vindigni A. Leveraging the replication stress response to optimize cancer therapy. Nat. Rev. Cancer. 2023;23:6–24. doi: 10.1038/s41568-022-00518-6. - DOI - PMC - PubMed
    1. Berti M, Cortez D, Lopes M. The plasticity of DNA replication forks in response to clinically relevant genotoxic stress. Nat. Rev. Mol. Cell Biol. 2020;21:633–651. doi: 10.1038/s41580-020-0257-5. - DOI - PubMed
    1. Thakar T, Moldovan GL. The emerging determinants of replication fork stability. Nucleic Acids Res. 2021;49:7224–7238. doi: 10.1093/nar/gkab344. - DOI - PMC - PubMed