. 2024 Jul;25(7):2974-3007.
doi: 10.1038/s44319-024-00164-z. Epub 2024 May 30.

Targeting ATP2B1 impairs PI3K/Akt/FOXO signaling and reduces SARS-COV-2 infection and replication

Affiliations

Targeting ATP2B1 impairs PI3K/Akt/FOXO signaling and reduces SARS-COV-2 infection and replication

Pasqualino de Antonellis et al. EMBO Rep. 2024 Jul.

Abstract

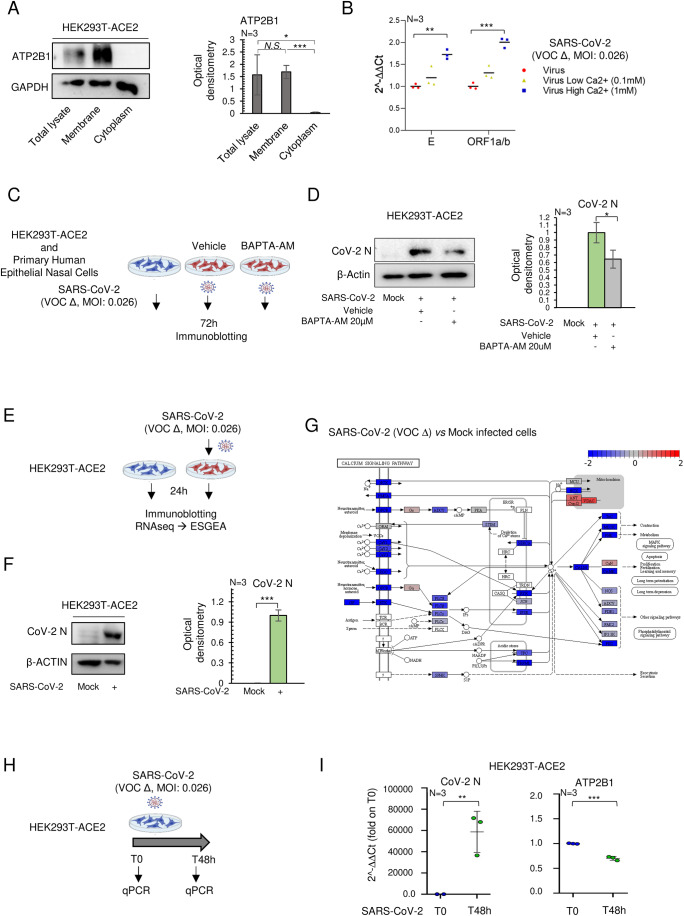
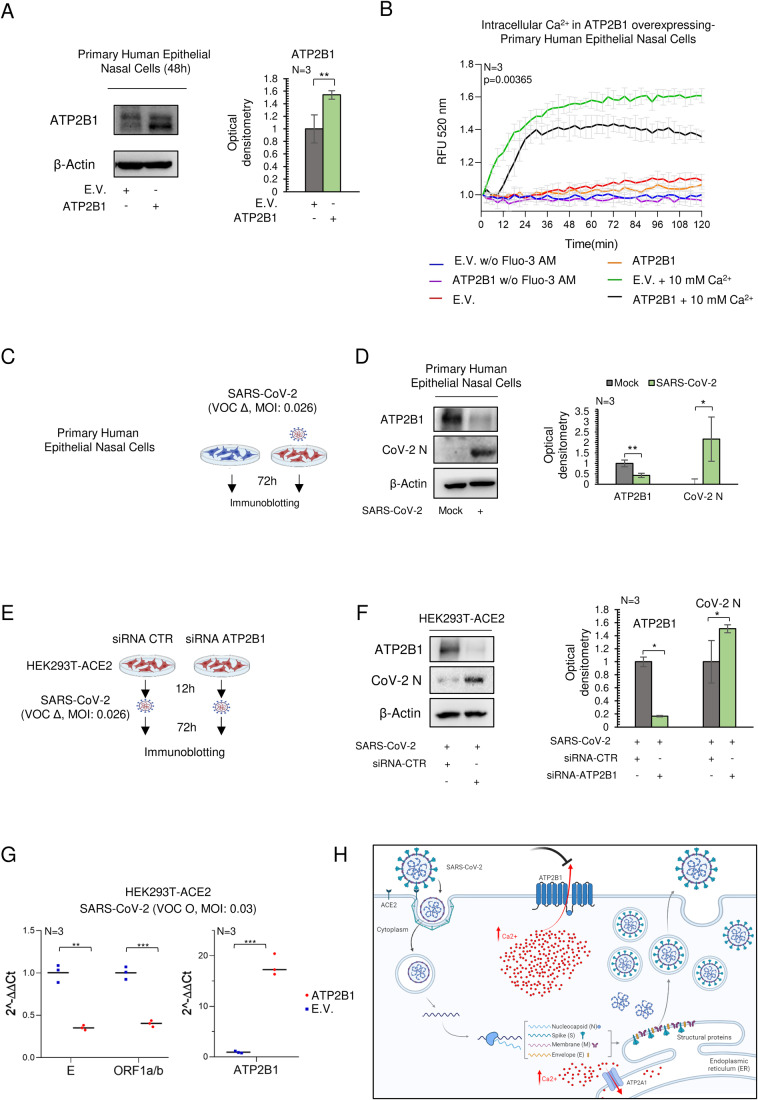
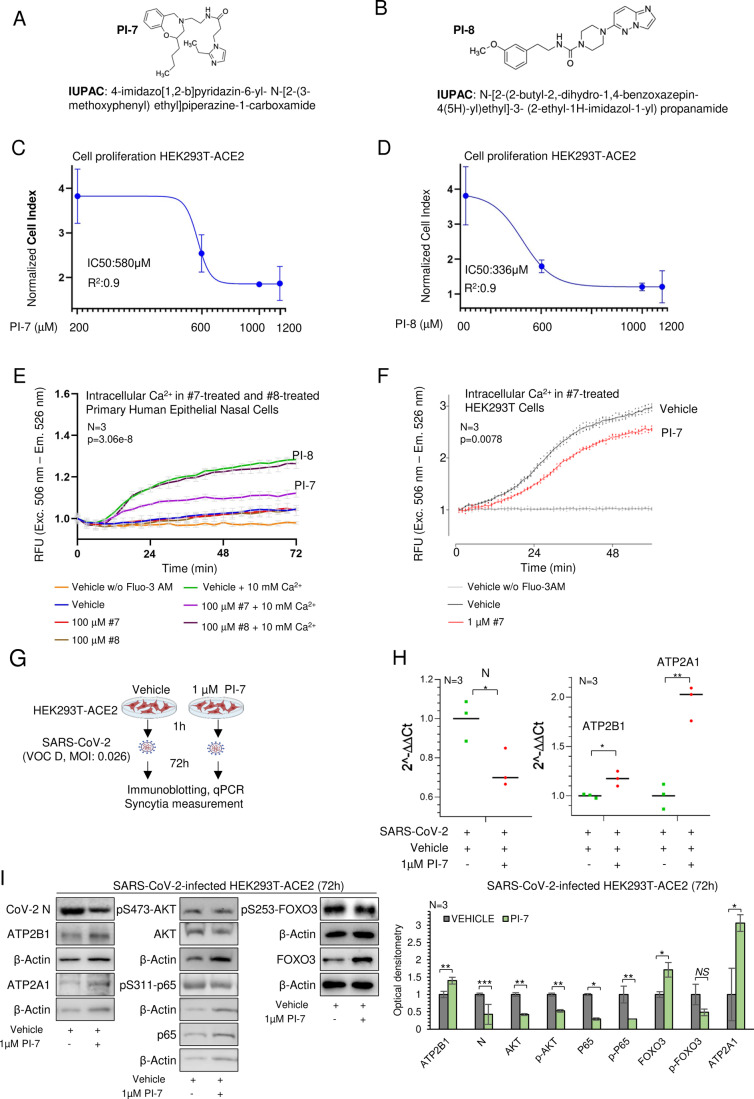
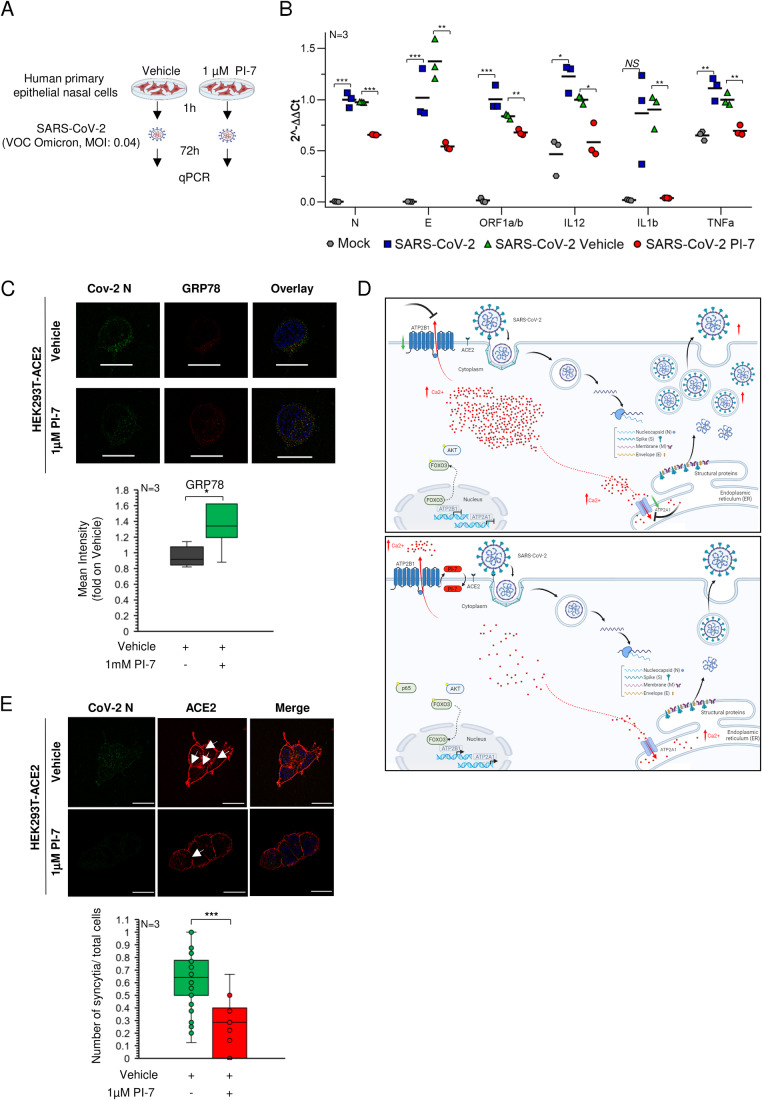
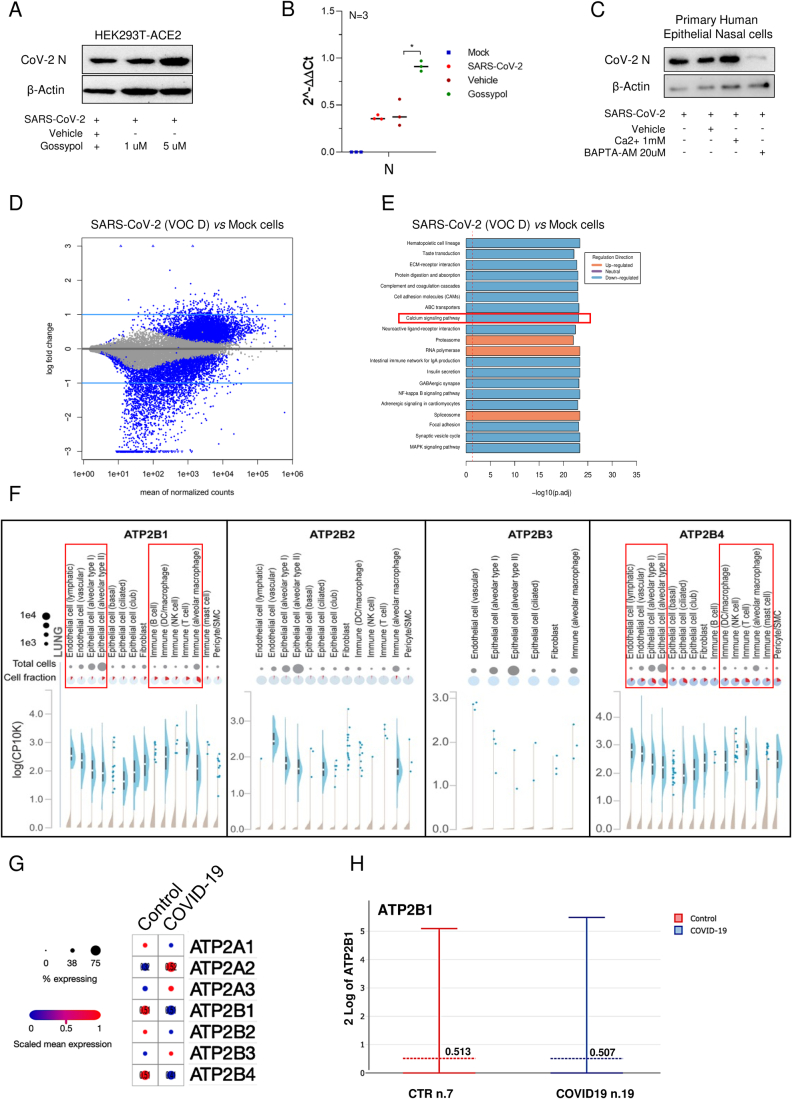
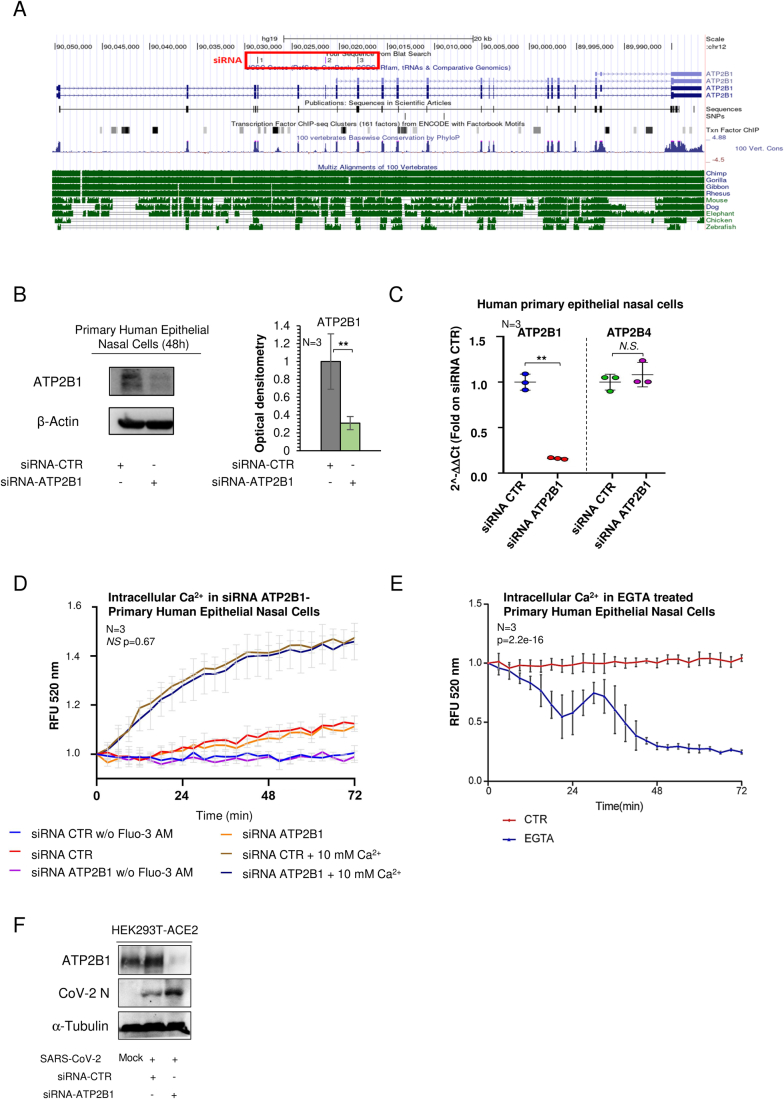
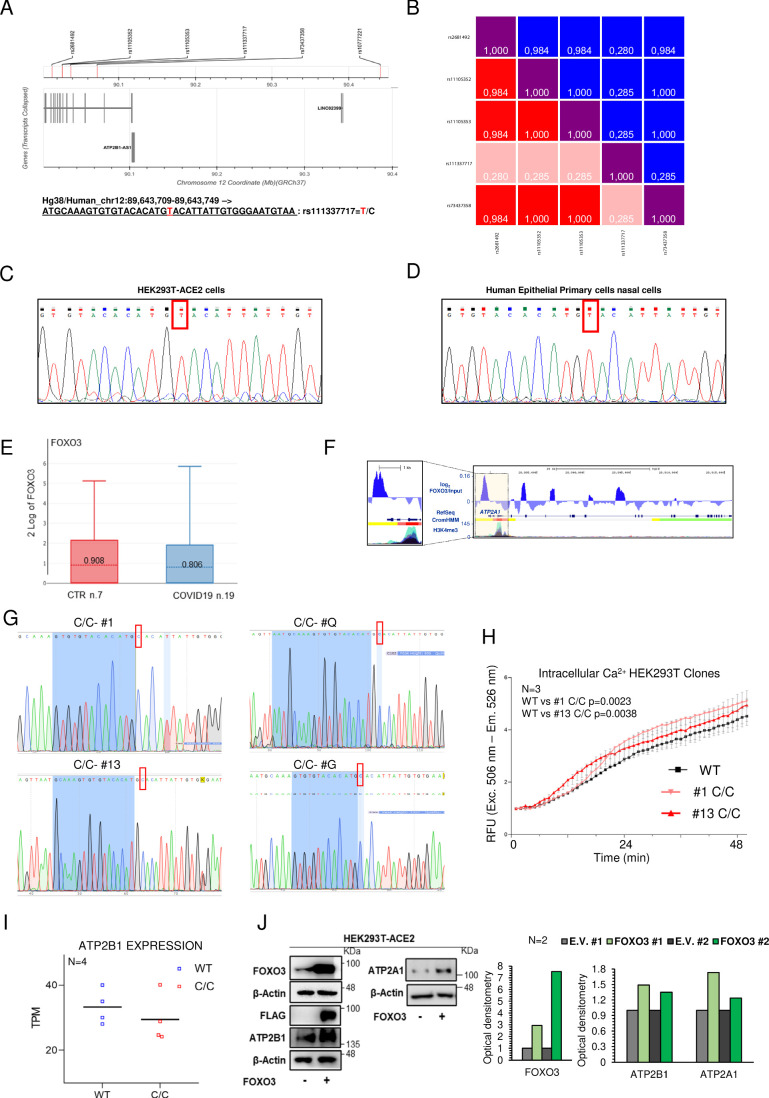
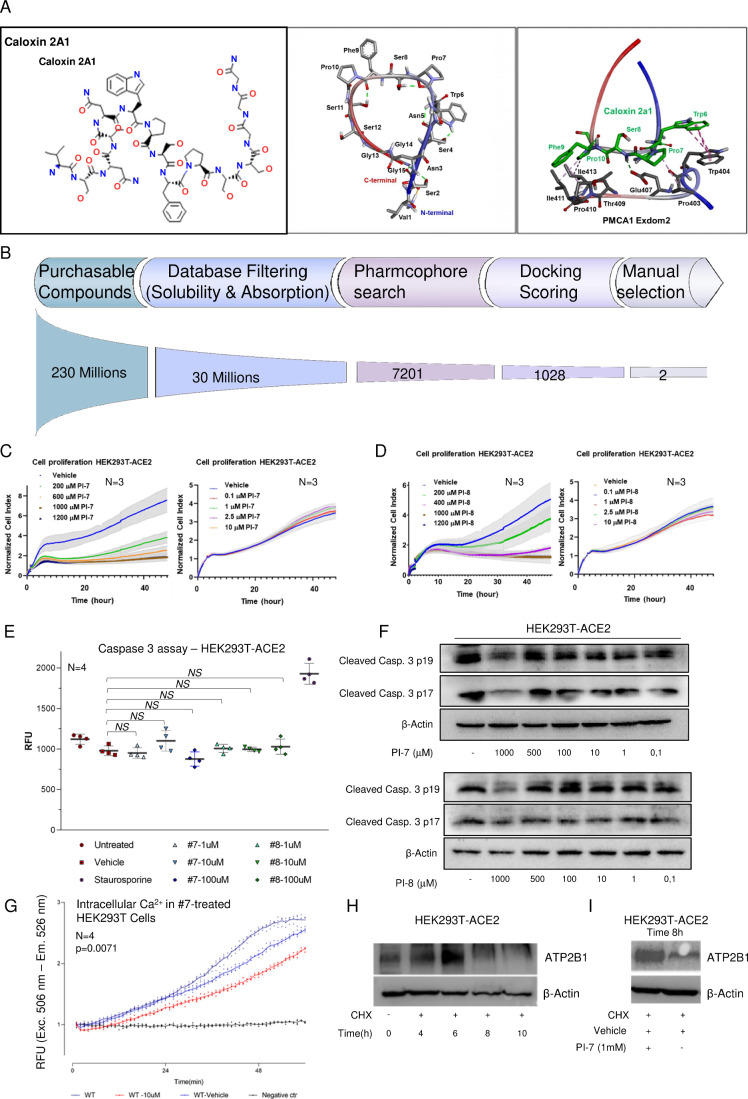
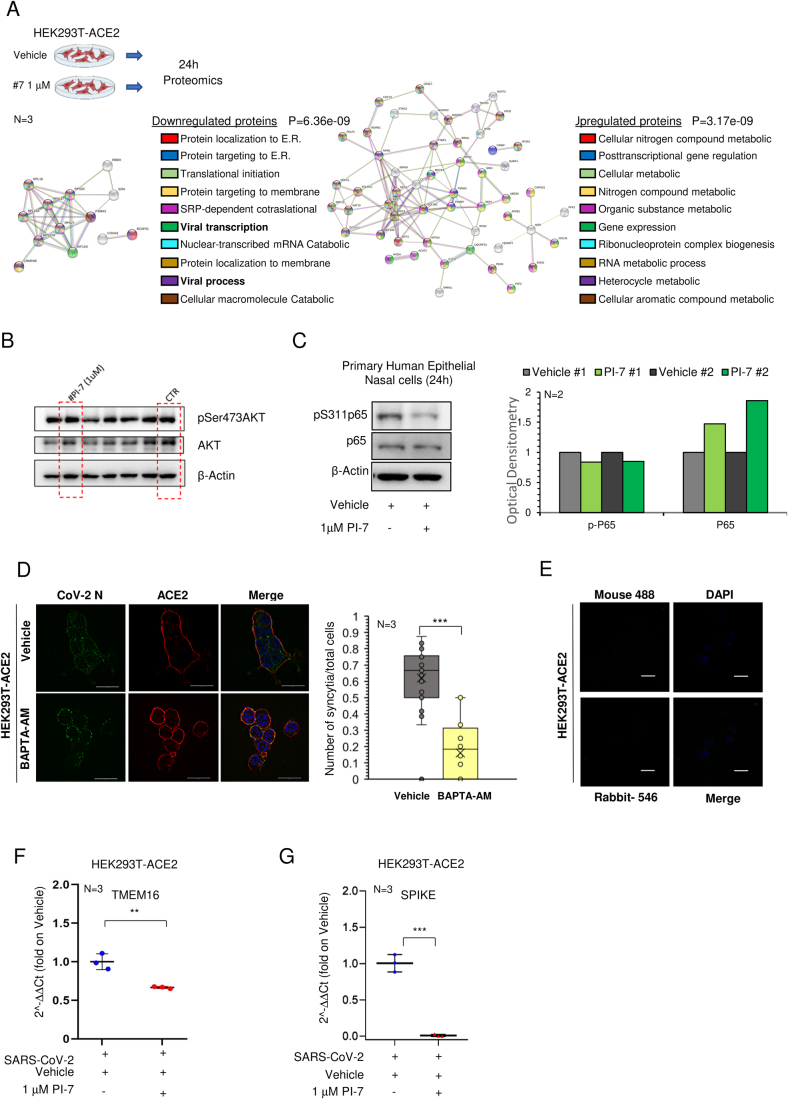
ATP2B1 is a known regulator of calcium (Ca2+) cellular export and homeostasis. Diminished levels of intracellular Ca2+ content have been suggested to impair SARS-CoV-2 replication. Here, we demonstrate that a nontoxic caloxin-derivative compound (PI-7) reduces intracellular Ca2+ levels and impairs SARS-CoV-2 infection. Furthermore, a rare homozygous intronic variant of ATP2B1 is shown to be associated with the severity of COVID-19. The mechanism of action during SARS-CoV-2 infection involves the PI3K/Akt signaling pathway activation, inactivation of FOXO3 transcription factor function, and subsequent transcriptional inhibition of the membrane and reticulum Ca2+ pumps ATP2B1 and ATP2A1, respectively. The pharmacological action of compound PI-7 on sustaining both ATP2B1 and ATP2A1 expression reduces the intracellular cytoplasmic Ca2+ pool and thus negatively influences SARS-CoV-2 replication and propagation. As compound PI-7 lacks toxicity in vitro, its prophylactic use as a therapeutic agent against COVID-19 is envisioned here.

Keywords: ATP2B1; Ca2+; PI3K/Akt/FOXO; SARS-CoV-2; Transcription.


Conflict of interest statement

The authors declare no competing interests.

Figures

Figure 1
Figure 1. Dysregulated expression of Ca2+ pumps during SARS-CoV- 2 infection, including ATP2B1.
(A) Left: Representative immunoblotting analysis of cytosolic, membrane, and total protein lysate fractions obtained from HEK293T-ACE2 cells, using antibodies against the ATP2B1 protein. GAPDH is used as the loading control. Right: Densitometric analysis of ATP2B1 band intensities. Data are means ± SD of N = 3 biological replicates. Unpaired two‐tailed T Student tests, *P < 0.05; ***P < 0.001, NS not significant. (B) Quantification of mRNA abundance in the presence of increasing amount of Ca2+ (2−ΔΔCt) for the viral CoV-2 E and ORF1a/b genes. qPCR analysis of RNA extracted from HEK293T-ACE2 cells infected with SARS-CoV-2 VOC Delta for 24 h. Scattered plots show individual value and mean as indicated by the horizonal black lines of N = 3 biological replicates. Unpaired two‐tailed T Student tests with Bonferroni correction, **P < 0.01; ***P < 0.001. (C) Experimental design for the HEK293T-ACE2 cells treated with 20 μM BAPTA-AM and infected with SARS-CoV-2 (VOC Delta at 0.026 MOI) for 72 h. Mock-infected cells are used as control. (D) Left: A representative immunoblotting analysis using antibodies against COV-2-Nucleoprotein (CoV-2 N) on total protein lysates obtained from cells treated with BAPTA-AM at 20 μM concentration. Vehicle-treated cells are used as control. β‐Actin is used as the loading control. Right: Densitometric analysis of the CoV-2 N band intensities. Data are represented as means ± SD of N = 3 biological replicates. Unpaired two‐tailed T Student tests with Bonferroni correction, *P < 0.05. (E) Experimental design showing analyses of HEK293T-ACE2 cells infected with SARS-CoV-2 (VOC Delta at 0.026 MOI) for 24 h; mock-treated cells were used as negative control. Total RNA and protein extracted for RNA-seq (Explorative experiment) with ESGEA analyses and immunoblotting. (F) Left: Representative immunoblotting analysis of the CoV-2 N protein in cells treated as in (E). β‐Actin is used as the loading control. Right: Densitometric analysis of CoV-2 N. Data are means ± SD of N = 3 biological replicates. Unpaired two‐tailed T Student tests, ***P < 0.001. NS not significant. (G) The “Ca2+ signaling by reactome pathway” through RNA-seq analyses from the differentially expressed genes in HEK293T-ACE2 cells treated as in (E). Blue, downregulated (blue) and upregulated (red) genes upon SARS-CoV-2 infection are shown. Red circle indicates PMCA family Ca2+ pumps (or ATP2Bs). (H) Experimental design of HEK293T-ACE2 cells infected with SARS-CoV-2 (VOC Delta at 0.026 MOI) for 48 h, RNA extracted at T0 and T48 for qPCR analyses. (I) Quantification of mRNA abundance relative to T0 and T48 (2−ΔΔCt) for the ATP2B1 and CoV-2 N genes in cells treated as in (H). Data are means ± SD of N = 3 biological replicates. Unpaired two‐tailed T Student tests, **P < 0.01, ***P < 0.001. Source data are available online for this figure.
Figure 2
Figure 2. Reduced ATP2B1 protein levels promote SARS-CoV-2 replication via increasing intracellular Ca2+.
(A) Representative immunoblotting analysis using antibodies against ATP2B1 in human primary epithelial nasal cells transiently overexpressing ATP2B1 human gene (48 h). Cells overexpressing the empty vector (E.V.) were used as negative controls. β‐Actin is used as the loading control. Right: Densitometric analysis of ATP2B1. Data are means ± SD of N = 3 biological replicates. Unpaired two‐tailed T Student tests, **P < 0.01. (B) Fluorescence changes relative quantification of intracellular Ca2+ by Fluo3-AM for up to 72 min in human primary epithelial nasal cells overexpressing ATP2B1 (48 h after transfection). Cells overexpressing the empty vector [E.V.] used as negative control. Results are expressed as means ± SEM of N = 3 biological replicates. Fd ANOVA global P = 0.0365, see ATP2B1-overexpressing cell (black line) vs. E.V. (green line) in the presence of 10 mM Ca2+. (C) Experimental design showing primary human epithelial nasal cells infected with SARS-CoV-2 (VOC Delta at 0.026 MOI), mock-infected cells used as negative control. After 72 h proteins extracted for immunoblotting. (D) Left: a representative immunoblotting analysis using antibodies against ATP2B1, CoV-2 N in cells as treated in (C). β‐Actin is used as the loading control. Right: densitometric analysis of ATP2B1 and CoV-2 N. Data are means ± SD of N = 3 biological replicates. Unpaired two‐tailed T Student tests, *P < 0.05, **P < 0.01. (E) Experimental design showing HEK293T-ACE2 cells treated with siRNA against ATP2B1 (or scrambled, CTR) for 12 h, and then infected with SARS-CoV-2 (VOC Delta at 0.026 MOI) for 72 h. (F) A representative immunoblotting analysis using antibodies against ATP2B1 and CoV-2 N from cells treated as in (E). β‐Actin is used as the loading control. Right: Densitometric analysis of ATP2B1 and Cov-2 N. Data are means ± SD of N = 3 biological replicates. Unpaired two‐tailed T Student tests, *P < 0.05. (G) Quantification of RNA level measured by qPCR of viral ORF1a/b and E and human ATP2B1 in HEK293-ACE2 transiently transfected with ATP2B1 gene or empty vector E.V. and infected with SARS-COV-2 VOC Omicron (72 h). Data are means ± SD of N = 3 biological replicates. Unpaired two‐tailed T Student tests, **P < 0.01, ***P < 0.001. (H) Cartoon representation to illustrate our hypothesis about the role of ATP2B1 during SARS-CoV-2 infection. Downregulation of ATP2B1 increased the intracellular Ca2+ levels as observed by the blockage sign (colored black, on top) and resulting on stimulation of SARS-CoV-2 replication with an increased expression of the viral structural genes as represented by enhanced expression of SARS-CoV-2 N protein. Source data are available online for this figure.
Figure 3
Figure 3. The homozygous intronic ATP2B1 variant rs111337717 is responsible for increased SARS-CoV-2 replication in COVID-19 patients via transcriptional regulation of FOXO3.
(A) In silico analysis pipeline identifying the presence of noncoding variants in the ATP2B1 locus acting as expression quantitative traits (eQTLs) and located in putative elements responsible for transcriptional regulation. EQTLs”, GWAVA, and linkage disequilibrium analyses (LD) are used to identify the rs111337717 SNP in the ATP2B1 locus. GTex database (eQTLs): (P < 1 × 10−6) (CIS-eQTL mapping for statistical tools, see (Consortium, 2020); COVID-19 severity vs. asymptomatic patients Fisher test, P = 0.0004. (B) Alignment of the sequence genomic region flanking rs111337717 SNP (NC_000012.12: g.89643729 T > C) SNP [(CACATG(T/C)ACATTAT)] shows the conservation through different species sequences through evolution (C) Identification of FOXOs family transcriptional factors (D) CromHMM state segmentation and the H3K4me3 signal (ENCODE), along the ATP2B1 gene in human cells epigenetically analyzed by Genome browser showing accumulation of normalized FOXO3 signal: bright red, promoter; orange and yellow, enhancer; green, transcriptional transition; red arrow, polymorphism- containing region. The expanded view of the highlighted region (left) shows FOXO3 peaks over the ATP2B1 promoter and enhancer regions, as marked by H3K4me3 and CromHMM (red and orange regions), respectively. (E) Luciferase reporter assay for the rs111337717 for both T/T (WT) and C/C (MUT) sequences in ATP2B1 gene as described in Methods section. Data are expressed as means ± SEM of N = 36 (n.12 biological replicates with N = 3 technical measurements). Unpaired or paired T Student test, *P < 0.05. (F) Luciferase reporter assay for the RS111337717 for both “T/T” and “C/C” sequences in HEK293T cells transiently transfected with FOXO3 or Empty Vector (E.V.) for 60 h. Results are expressed as means ± SEM of N = 18 (N = 6 biological replicates with N = 3 technical measurements). One-way ANOVA test in multiple groups comparisons, **P < 0.01, ***P < 0.001. Statistical details: WT T/T vs. WT T/T FOXO3 P < 0.0001; C/C vs. C/C FOXO3 P = 0.0053; WT T/T FOXO3 vs. C/C FOXO3 P < 0.0001. (G) Right: Cartoon representation to illustrate our hypothesis of the “C/C” sequence in the ATP2B1 intronic region and its transcriptional regulation. (H) Schematic illustration for target T to C genome editing by CRISPR/Cas9 in the rs111337717 region. N. 2 guides (A, B) are used to analyze n.53-edited clones (see “Methods”). (I) Heatmap of top differentially expressed (DE) genes comparing HEK293T (WT T/T) and isogenic generated clones (C/C). Colors represent (green, black, and red) as low, intermediate and high gene expression, respectively. Fold change value +/−2. Statistical Mobin Wald test, P < 0.005 Bonferroni corrected of N = 4 different isogenic (T/T and C/C) generated clones. N = 4 biological replicates. (J) A cartoon showing CRISPR/Cas9 genome editing clones (T/T and C/C) transfected with ACE2 carrying plasmid and infected by SARS-CoV-2. Below: qPCR of viral structural genes (ORF1a/b and E) and ACE2 expression in those ACE2 transiently expressing clones infected by SARS-CoV-2 Omicron 5 (see “Methods”). Scattered plots show individual value and mean as indicated by the horizonal black lines of N = 4 biological replicates. Unpaired two‐tailed T Student tests, *P < 0.05; **P < 0.004. Statistical details: CC vs. TT clones: C/C #1; C/C#13, C/C #G; C/C #Q red color vs. T/T WT and T/T #A, T/T #AA, T/T#U green color parental cells. (K) Top: Representative immunoblotting analysis using antibodies against the indicated proteins (ATP2B1, Cov-2 N, FOXO3, pS253-FOXO3, pS473-AKT, ATP2A1) in HEK293T- ACE2 cells infected with SARS-CoV-2 VOC Delta at 0.026 MOI for 72 h. β‐Actin is used as the loading control. Mock-infected cells were used as a negative control. Bottom: densitometric analysis of the proteins as above. Data are means ± SD of N = 3 biological replicates. Unpaired two‐tailed T Student tests, *P < 0.05, NS not significant. (L) Cartoon representation to illustrate our hypothesis for downregulation of ATP2B1 during SARS-CoV-2 infection via FOXO3 transcriptional factor. During SARS-CoV-2 infection, while ATP2B1 is downregulated, (see block sign on top) the PI3K/Akt pathway is activated and enhances the phosphorylation of FOXO3, thus excluding its protein entrance in the nucleus (see dashed lines). As a consequence, the expression of the FOXO3 targets, including ATP2B1 and ATP2A1, are also found downregulated, thus increasing the intracellular Ca2+ levels and further promoting SARS-CoV-2 replication. Source data are available online for this figure.
Figure 4
Figure 4. ATP2B1 impairment using a caloxin derivative (compound PI-7) impairs SARS-CoV-2 infection by affecting intracellular Ca2+ levels.
(A, B) Molecular structures and IUPAC names of compounds PI-7 (A) and PI-8 (B) selected from the screening. (C, D) Real-time cell proliferation analyses in HEK293T-ACE2 cells (Cell Index; i.e., cell-sensor impedance expressed every 2 min). IC50 values are calculated through nonlinear regression analysis, RTCA software vs.1.2.1 (XCELLIGENCE ACEA System application) using the Sigmoidal dose–response (Variable slope) for PI-7 (C) and PI-8 (D). See “Methods” for technical cells handling. Graph generated using Graph Pad Prism 9, with the IC50 values given (PI-7: 580 µM, R2 0.9; PI-8: 336 µM, R2 0.9). Data are means ± SD of N = 3 biological replicates. (E) Quantification of relative fluorescence changes of Fluo3-AM as a measure of intracellular Ca2+ levels. Vehicle-treated cells were used as a negative control. Results are expressed as means ± SEM of N = 3 biological replicates. One-way ANOVA and KS test, P = 3.06E-08. (F) Quantification of relative fluorescence changes of Fluo3-AM as a measure of intracellular Ca2+ levels. Vehicle-treated cells were used as negative control for up to 48 min in HEK293T-ACE2 cells treated with 1 µM of PI-7, vehicle-treated cells were used as negative control. Results are expressed as means ± SEM of N = 3 biological replicates. One-way ANOVA and KS test, P = 0.0007873. (G) Experimental design showing HEK293T-ACE2 cells treated with PI-7 or Vehicle for 1 h and then infected with SARS-CoV-2 (VOC Delta at 0.026 MOI). After 72 h the cells are lysed or fixed for immunoblotting, qPCR, or immunofluorescence (syncytia measurements), respectively. (H) Quantification of viral Cov-2 N, human ATP2B1 and ATP2A1 gene expression level by qPCR (2 − ΔΔCt) in cells treated as in (G). Scattered plots show the individual values ad mean as indicated by the horizontal black lines of N = 3 biological replicates. Unpaired two‐tailed T Student tests, *P < 0.05, **P < 0.01. (I) Representative immunoblotting analysis using antibodies against the proteins (Cov-2 N, ATP2B1, ATP2A1, pS473-AKT, AKT, pS311–p65, p65, pS253-FOXO3, FOXO3) in cells treated as in (G). On the right. Densitometric analysis of the indicated proteins. Data are means ± SD of N = 3 biological replicates. Unpaired two‐tailed T Student tests, *P < 0.05, **P < 0.01, ***P < 0.001, NS not significant. Source data are available online for this figure.
Figure 5
Figure 5. Compound PI-7 diminishes SARS-CoV-2 replication by affecting syncytia formation and cytokine storm.
(A) Experimental plan for human primary epithelial cells treated with 1 µM PI-7 or vehicle as control. After 1 h, the cells were infected with SARS-CoV-2 viral particles of VOC Omicron 2 at 0.04 MOI for 72 h. The cells were then used for qPCR analysis. (B) Quantification of viral RNA (N, E, ORF1a/b,) and mRNA for the indicated cytokines (2−ΔΔCt) in cells treated as in (A). The scattered plot shows the individual value and mean as indicated by the horizontal black lines of N = 3 biological replicates. Uninfected cells are used as a negative control. Unpaired two‐tailed T Student tests and Bonferroni corrected, *P < 0.05, *P < 0.01, ***P < 0.001, NS not significant. (C) On the top: Immunofluorescence staining (IF) with antibodies against viral CoV-2 N (green) and human GRP78 (red) in cells treated ad in Fig. 4G. On the bottom: The graph shows the intensity of fluorescence. SIM2 images are acquired with Zeiss Elyra 7 and processed with Zeiss ZEN software (blue edition). Magnification, ×63. Scale bar, 20 µm. Data are means ± SD of N = 3 biological replicates. Data measurements values: vehicle-treated: min=0.820, max=1.143, center=0.915, 1.076 and whiskers=none, bounds of box=0.846–1.076 and percentiles=0.822 (K = 0.01) − 1.139 (K = 0.99); PI-7 treated: min=0.879 max=1.623, center=1.342 bounds of box=1.193–1.623, whiskers=none, and percentiles= 0.9 (K = 0.01) − 2.356(K = 0.99). Unpaired two‐tailed T Student tests, *P < 0.05. (D) Cartoon representation to illustrate our hypothesis for the role of ATP2B1 during SARS-CoV-2 infection upon treatment with compound PI-7. (E) Representative IF with antibodies against the CoV-2 viral N protein (green) and human ACE2 (red) in cells treated as in Fig. 4G. White arrows indicate the absence of membranes and syncytia formation. Quantification of the relative proportions of syncytia in >300 cells per condition. The SIM2 image are acquired with Elyra 7 and processed with Zeiss ZEN software (blue edition). Magnification, ×63. Scale bar, 20 µm. Data are means ± SD of N = 3 biological replicates. Data measurements values: vehicle-treated min=0.125, max=1, center=0.641, bounds of box=0.5–0.778 and whiskers= 0–1.25, percentiles= 0.064 (K = 0.01) − 1.122 (K = 0.99); PI-7 treated: min=0.0, max=0.667, center=0.286, bounds of box= 0–0.4, whiskers=none, percentiles= 0 (K = 0.01) − 1.653 (K = 0.99). Unpaired two-tailed T Student test, ***P < 0.001. Source data are available online for this figure.
Figure EV1
Figure EV1. Deregulated Ca2+ pumps during SARS-CoV-2 infection, including ATP2B1. Related to Fig. 1.
(A) A representative immunoblotting analysis using antibodies against the CoV-2 N protein from cells treated with escalating concentration of “gossypol-pubChem CID 3503” at 1 and 5 μM and vehicle as control in SARS-CoV-2 (VOC Δ) infected HEK293T-ACE2 cells. β‐Actin was used as the loading control. (B) Quantification of Cov-2 N gene (2−ΔΔCt) in gossypol-treated HEK293T-ACE2 (5 μM—48 h) and infected as in (A). Cells treated with vehicle were used as negative control. Scattered plot shows the individual value and mean as indicated by the horizontal black lines of N = 3 biological replicates. Unpaired two‐tailed T Student tests Bonferroni corrected. *p < 0.05 (vehicle vs. gossypol); the other comparisons are not statistically significant, as expected. (C) A representative immunoblotting analysis using antibodies against the Cov-2 N protein on total protein lysates obtained from human primary epithelial nasal cells treated with BAPTA at 20 μM concentration. Vehicle-treated cells were used as control. β‐Actin is used as the loading control. (D) RNA Sequencing (RNA-seq) analyses was performed in HEK293T-ACE2 cells treated as in Fig. 2E. (E) The Gene Set Enrichment Analysis (see GSEA project on https://doi.org/10.1073/pnas.0506580102) is applied for the identification of deregulated key genes and pathways. KEGG pathways analyses by statistical KS global test, P < 0.05. KEGG pathway enrichment analysis indicates those significant deregulated genes were highly clustered in calcium signaling pathway (red box). P adj: adjusted P values. (F) In silico analysis of publicly available datasets of single-cell RNA sequencing (https://singlecell.broadinstitute.org) for the expression of the plasma membrane calcium ATPases members (PMCAs or ATP2B1-4) of the large family of type Ca2+ion pumps in multiple cell type in the lung parenchyma (including alveolar macrophages and in the alveolar epithelial cells type I and type II). (G) Literature public search on available datasets obtained from a single-nuclei RNA-seq (snRNA-seq) on >116,000 nuclei from n.19 COVID-19 autopsy lungs and n.7 pre-pandemic controls (Melms et al, 2021); to verify expression of PMCAs and SERCAs pumps (ATP2B1-4 and ATP2A1-3 genes, respectively). The numbers within the dots are the median percentage level of expression between the two populations tested. (H) Expression levels of ATP2B1 in single-nuclei RNA-seq database (snRNA-seq) as described above in (G). Source data are available online for this figure.
Figure EV2
Figure EV2. Reduced ATP2B1 protein levels promote SARS-CoV-2 replication. Related to Fig. 2.
(A) Representation of human ATP2B1 region recognized by siRNA as reported in the UCSC Genome Browser on Human Dec. 2013 (GRCh38/hg38) Assembly (https://genome.ucsc.edu/). At the bottom, the alignment of this genomic region among different species is shown. (B) Left: representative immunoblotting analysis using antibodies against the ATP2B1 protein on human primary epithelial nasal cells transiently treated with siRNA against ATP2B1 (siRNA-ATP2B1) for 48 h. Cells treated with a pool of three unrelated siRNAs (siRNA- CTR) were used as negative controls. β‐Actin is used as the loading control. Right: Densitometric analysis of the ATP2B1 band intensities in blots. Data are means ± SD of N = 3 biological replicates. Unpaired two‐tailed T Student tests, **P < 0.01. (C) Quantification of mRNA abundance for ATP2B1 and ATP2B4 (2−ΔΔCt) in cells as treated as in (B). Data are means ± SD of N = 3 biological replicates. Unpaired two‐tailed T Student t test, **P < 0.01; NS not significant. (D) Quantification of relative fluorescence changes of Fluo3-AM as a measure of intracellular Ca2+ levels in cells treated as in (B) for up to 72 min. Results are expressed as means ± SEM of N = 3 biological replicates. One-way ANOVA and KS test, P = 0.6748; NS = not significant between siRNA control (brown) and siRNA-ATP2B1 (dark blue) in presence of 10 mM Ca2+. (E) Quantification of relative fluorescence changes of Fluo3-AM as a measure of intracellular Ca2+ levels for up to 72 min in human primary epithelial nasal cells treated with EGTA 1 mM. Results are expressed as means ± SEM of N = 3 biological replicates. One-way ANOVA and KS tests, P = 2.2e-16. (F) A representative immunoblotting analysis using antibodies against the ATP2B1 protein for total protein lysates obtained from cells treated as described in Fig. 2E. α-Tubulin is used as loading control. Mock-infected cells are used as control. Source data are available online for this figure
Figure EV3
Figure EV3. The homozygous intronic ATP2B1 variant rs11337717 is responsible for increased SARS-CoV-2 replication in COVID-19 patients by transcriptional regulation of FOXO3. Related to Fig. 3.
(A, B) Linkage disequilibrium (LD) analyses on the top n.5 SNPs (rs11105352; rs11105353; rs73437358; rs111337717; rs2681492) in order to select those which are independent. The SNP rs10777221 is excluded from these analyses because located at most 5’ region in extragenic ATP2B1 locus region (A). The graph in (B) shows the only SNP not in LD is rs111337717 (black boxes). (C) Sanger DNA sequencing of the genomic region of ATP2B1 locus (chr12:89,643,709-89,643,749) in HEK293T-ACE2 cells to exclude the presence of intronic variance potentially responsible for altered transcriptional levels of ATP2B1 gene. The red box indicates the nucleotide wild type allele “T” for the SNP here studied. (D) Sanger DNA sequencing of the genomic region of ATP2B1 locus (chr12:89,643,709-89,643,749) in human primary epithelial nasal cells to exclude the presence of intronic variants potentially responsible for altered transcriptional levels of ATP2B1 gene. (E) FOXO3 Expression in UMAP by disease ontology labels single-nuclei RNA-seq (snRNA-seq) analyses performed on >116,000 nuclei from n.19 COVID-19 autopsy lungs and n.7 pre-pandemic controls. Data measurements values of Log2 FOX3 mRNA expression: in CTR donors n.7: max=5.856, center= 0.806, min=0; in COVID-19 n.19 affected patients: max=5.128, center=0.908, min=0. (F) Genome browser screenshots showing accumulation of normalized FOXO3 signal, together with CromHMM state segmentation and H3K4me3 signal (ENCODE), along the ATP2A1 gene in human cells. ForCromHMM state segmentation colors indicate: Bright Red—Promoter; Orange and yellow—enhancer; Green— Transcriptional transition. The expanded view of the highlighted region, on the left, shows FOXO3 peaks over ATP2A1 enhancer regions, as marked by yellow region of CromHMM. (G) Sanger DNA sequencing of the genomic region of ATP2B1 locus (chr12:89,643,709-89,643,749) in HEK293T-ACE2 relative to the CRISPR/Cas9 edited clones to show the presence of intronic homozygous variant (C/C) responsible for altered transcriptional levels of ATP2B1 gene. The red box indicates the nucleotide edited for the SNP here studied. (H) Quantification of relative fluorescence changes of Fluo3-AM as a measure of intracellular Ca2+ levels for up to 48 min in HEK293T isogenic clones. Results are expressed as means ± SEM of N = 3 biological replicates. One-way ANOVA and KS test. In details: WT vs. CC P = 0.0023; WT vs. CC P = 0.0038. (I) Quantification of ATP2B1 mRNA abundance in HEK293T (N = 4 homozygous C/C) isogenic clones compared to (N = 4 WT T/T) unedited clones. mRNA levels measured by RNA-seq were plotted using transcript per million (TPM). Scattered plots show individual value and mean as indicated by the horizonal black lines of N = 4 biological replicates. Fold change value +/−2. Statistical Mobin Wald test NS not significant. (J) Left: representative immunoblotting analysis using antibodies against FOXO3, ATP2B1, ATP2A1 as indicated proteins on total protein lysates obtained from HEK293T-ACE2 cells transiently transfected with the human FOXO3-encoding plasmid (FLAG antibody positive) for 48 h. Empty vector transfected cells were used as negative control. β‐Actin is used as the loading control. On the right: Densitometric analysis of FOXO3, ATP2B1 and ATP2A1 from N = 2 technical replicates. Source data are available online for this figure
Figure EV4
Figure EV4. ATP2B1 impairment using a nontoxic “caloxin derivative” (compound PI-7) impairs intracellular Ca2+ levels. Related to Fig. 4.
(A) On the left: The sequence of caloxin 2a1 sequence, as peptide, is shown. On the right: The molecular modeling of ATP2B1-caloxin 2a1 structure by docking and energy minimization modeling via artificial intelligence as a drug design computational tool is shown. The pharmacophore model by using the structures ATP2B1–exodom-2 and caloxin 2a1 is also shown. Five pharmacophore features were produced. (B) Pipeline of the drug discovery is shown as described in the manuscript. (C, D) Real-time cell proliferation analyses for the Cell Index (i.e., the cell-sensor impedance was expressed every two minutes as a unit called “Cell Index”). Results are expressed as means ± SEM of N = 3 biological replicates. HEK293T-ACE2 treatment described in the Methods are treated with escalating doses of PI-7 (C) or PI-8 (D); with vehicle-treated cells were the negative control. Impedance was measured every 2 min over 48 h. The graphs showing “normalized cell index” were generated using Graph Pad Prism 9. (E) Caspase-3 activity measured in HEK293T-ACE2 cells with increasing concentrations of compound PI-7 and PI-8 for 18 h. Vehicle-treated cells and cells treated with 10 µM staurosporine are used as negative and positive controls, respectively. Data are presented as relative fluorescent units (RFUs; excitation: 380 nm; emission: 460 nm). Results are expressed as means ± SEM of N = 3 biological replicates. NS not significant. One-way ANOVA test among multiple groups, Untreated vs. Vehicle P = 0.1596, Vehicle vs. PI-7-1 µM p = 0.9993, Vehicle vs. PI-7-10 µM P = 0.3039, Vehicle vs. PI-7-100 µM P = 0.5176, Vehicle vs. PI-8-1 µM P = 0.9992, Vehicle vs. PI-8-10 µM P > 0.9999, Vehicle vs. PI-8-100 µM P = 0.9732), NS not significant. (F) A representative immunoblotting analyses on total protein lysates obtained from HEK293T-ACE2 treated with escalating doses of PI-7 (top) and PI-8 (bottom) molecules using antibodies against Cleaved Caspase-3 fragments (17–19 kDa). β‐Actin is used as the loading control. Vehicle-treated cells are used as a negative control of the experiment. (G) Quantification of relative fluorescence changes of Fluo3-AM as a measure of intracellular Ca2+ levels for up to 48 min in HEK293T cells treated with 10 µM of PI-7, vehicle-treated cells were used as negative control. Results are expressed as means ± SEM of N = 4 biological replicates. Fd ANOVA global - CH test, P = 0.007. (H) A cycloheximide (CHX) chase assay, representative immunoblotting analyses on total protein lysates obtained from HEK293T-ACE2 treated with CHX at different time point (from T = 0 to T = 10 h) using antibodies against ATP2B1 and β‐Actin used as the loading control. Vehicle-treated cells (i.e., 0.001% DMSO) are used as negative control of the experiment. (I) A Representative immunoblotting analyses on total protein lysates obtained from HEK293T-ACE2 treated with CHX and PI-7 for 8 h, using antibodies against ATP2B1. β‐Actin is used as loading control. Vehicle-treated cells are used as negative control. Source data are available online for this figure
Figure EV5
Figure EV5. Compound PI-7 diminishes SARS-CoV-2 replication by affecting viral processes, syncytia formation and inflammatory pathways. Data related to Fig. 5.
(A) Top panel: a proteomic assay based on LC-MS/MS approach performed on HEK293T-ACE2 cells treated with PI-7 molecule (1 µM) for 24 h, N = 3 biological replicates. Bottom left: A protein interaction network was generated using the Search Tool for the Retrieval of Interacting Genes/ Proteins (STRING) database (https://string-db.org), using only those proteins that were downregulated in PI-7- treated cells within “viral process” and “viral transcription” category functions, in bold (i.e., n.18 downregulated proteins, Appendix 7). One-way ANOVA, P = 6.36 e09. N = 3 biological replicates. Bottom right: A protein interaction network was generated using STRING database (https://string-db.org) by using only those proteins found upregulated in PI-7-treated cells (i.e., n.66 upregulated protein, with different category functions, Appendix 8). One-way ANOVA test, P = 3.17e09. (B) A representative immunoblotting analysis on uninfected cells using antibodies against the pSer-473AKT and AKT proteins on total protein lysates obtained from HEK293T-ACE2 treated with compound PI-7 (1 µM-dashed lines) or vehicle-treated (CTR dashed lines) for 24 h. β‐Actin is used as the loading control. (C) A representative immunoblotting analysis using antibodies against the pS311–p65 and p65 proteins on total protein lysates obtained from human primary epithelial nasal cells treated with compound PI-7 (1 µM) for 24 h. β‐Actin is used as the loading control. Densitometric analysis from N = 2 technical replicates. (D) IF with an antibody against viral CoV-2 N (green) and human ACE2 (red) proteins in HEK293T-ACE2 cells treated with BAPTA-AM (20 μM) and infected with SARS-CoV-2 for 72 h (i.e., treated as in Fig. 4G). Right: The graph showing the intensity of fluorescence is shown on the left. Data are means ± SD of N = 3 biological replicates. Unpaired two-tailed T Student test, ***P < 0.001. Data measurements values: vehicle-treated min=0.333, max=0.875, center=0.667, bounds of box= 0.5–0.757 and whiskers = 0, percentiles= 0.064 (K = 0.01) − 1.122 (K = 0.99); BAPTA-AM treated: min=0.0, max=0.5, center=0.183, bounds of box=0–0.312, whiskers=none, percentiles= 0 (K = 0.01) − 0.5 (K = 0.99). The SIM2 image are acquired with Elyra 7 (Zeiss) and processed with Zeiss ZEN software (blue edition). Magnification, ×63. Scale bar, 20 µm. (E) A representative IF staining with secondary antibodies anti-rabbit Alexa Fluor 546 (1:200; #A10040, Thermo Fisher Scientific) or anti-mouse Alexa Fluor 488 (1:200, ab150113, Abcam) on HEK293T-ACE2 cells. DAPI is used for nuclear staining (blue). The image was acquired with Elyra 7 (Zeiss). Magnification: 40×; Scale bar, 20 μm. (F) QPCR of mRNA abundance relative to that in control (CTR) cells (2−ΔΔCt) for human TMEM16 gene. RNA extracted from HEK293T-ACE2 cells treated as in Fig. 4G). Scattered plots show the individual values ad mean as indicated by the horizontal black lines of N = 3 biological replicates. Unpaired two‐tailed T Student test and Bonferroni corrected **P < 0.01. (G) QPCR of mRNA abundance relative to that in control (CTR) cells (2−ΔΔCt) for SARS-CoV-2 SPIKE gene from HEK293T-ACE2 cells treated as in Fig. 4G. Scattered plots show the individual values ad mean as indicated by the horizontal black lines of N = 3 biological replicates. Unpaired two‐tailed T Student test ***P < 0.001. Source data are available online for this figure

References

    1. Acheampong KK, Schaff DL, Emert BL, Lake J, Reffsin S, Shea EK, Comar CE, Litzky LA, Khurram NA, Linn RL, et al. Subcellular detection of SARS-CoV-2 RNA in human tissue reveals distinct localization in alveolar type 2 pneumocytes and alveolar macrophages. mBio. 2022;13:e0375121. doi: 10.1128/mbio.03751-21. - DOI - PMC - PubMed
    1. Andersen KG, Rambaut A, Lipkin WI, Holmes EC, Garry RF. The proximal origin of SARS-CoV-2. Nat Med. 2020;26:450–452. doi: 10.1038/s41591-020-0820-9. - DOI - PMC - PubMed
    1. Andolfo I, Russo R, Lasorsa VA, Cantalupo S, Rosato BE, Bonfiglio F, Frisso G, Abete P, Cassese GM, Servillo G, Esposito G, Gentile I, Piscopo C, Villani R, Fiorentino G, Cerino P, Buonerba C, Pierri B, Zollo M, Iolascon A, Capasso M (2021) Common variants at 21q22.3 locus influence MX1 and TMPRSS2 gene expression and susceptibility to severe COVID-19. iScience 24:102322 - PMC - PubMed
    1. Baggen J, Vanstreels E, Jansen S, Daelemans D. Cellular host factors for SARS-CoV-2 infection. Nat Microbiol. 2021;6:1219–1232. doi: 10.1038/s41564-021-00958-0. - DOI - PubMed
    1. Berlansky S, Sallinger M, Grabmayr H, Humer C, Bernhard A, Fahrner M, Frischauf I. Calcium signals during SARS-CoV-2 infection: assessing the potential of emerging therapies. Cells. 2022;11:253. doi: 10.3390/cells11020253. - DOI - PMC - PubMed

MeSH terms