. 2024 Jul;25(7):2950-2973.
doi: 10.1038/s44319-024-00167-w. Epub 2024 May 30.

Structural basis for the bi-specificity of USP25 and USP28 inhibitors

Affiliations

Structural basis for the bi-specificity of USP25 and USP28 inhibitors

Jonathan Vincent Patzke et al. EMBO Rep. 2024 Jul.

Abstract

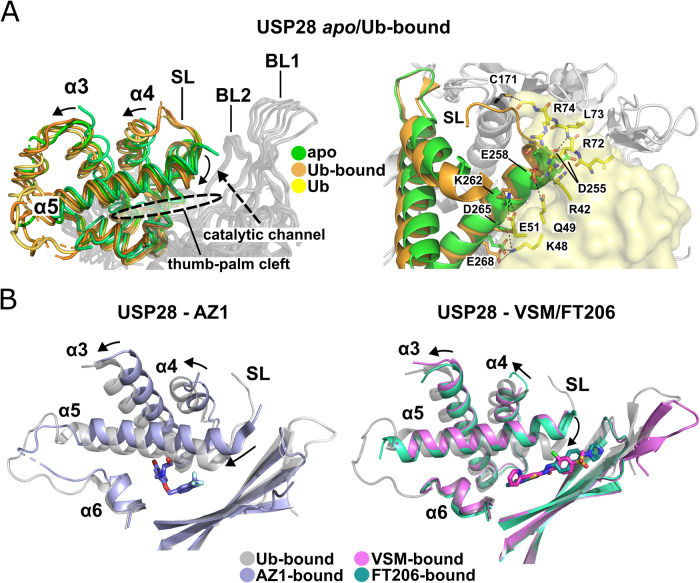
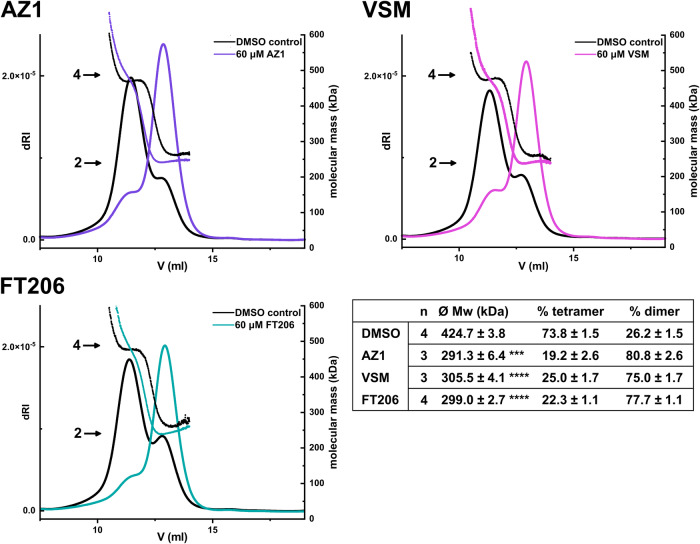
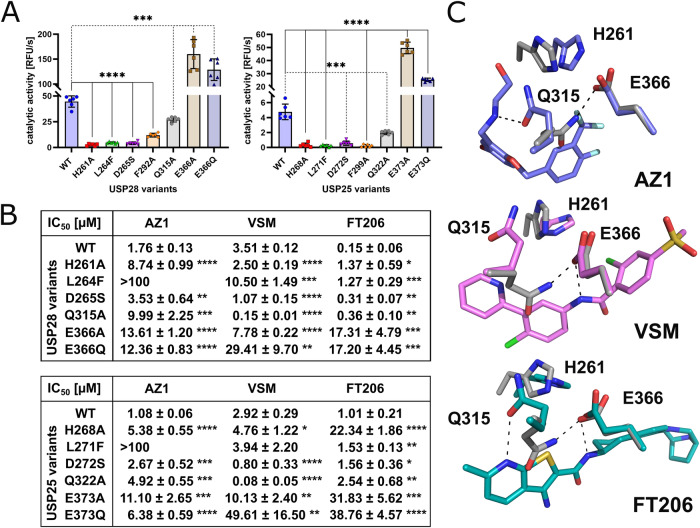
The development of cancer therapeutics is often hindered by the fact that specific oncogenes cannot be directly pharmaceutically addressed. Targeting deubiquitylases that stabilize these oncogenes provides a promising alternative. USP28 and USP25 have been identified as such target deubiquitylases, and several small-molecule inhibitors indiscriminately inhibiting both enzymes have been developed. To obtain insights into their mode of inhibition, we structurally and functionally characterized USP28 in the presence of the three different inhibitors AZ1, Vismodegib and FT206. The compounds bind into a common pocket acting as a molecular sink. Our analysis provides an explanation why the two enzymes are inhibited with similar potency while other deubiquitylases are not affected. Furthermore, a key glutamate residue at position 366/373 in USP28/USP25 plays a central structural role for pocket stability and thereby for inhibition and activity. Obstructing the inhibitor-binding pocket by mutation of this glutamate may provide a tool to accelerate future drug development efforts for selective inhibitors of either USP28 or USP25 targeting distinct binding pockets.

Keywords: Cancer; DUB; Inhibitor; USP25; USP28.


Conflict of interest statement

The authors declare no competing interests.

Figures

Figure 1
Figure 1. Crystal structures of USP28-inhibitor complexes.
(A) Top panel: Structural formulae of AZ1 (left), VSM (center) and FT206 (right). Middle panel: The inhibitor binding cleft in USP28. AZ1 (left, blue), VSM (center, magenta) and FT206 (right, teal) bind at different positions of the same binding cleft, formed by the USP28 palm (β8, β12, β13, and β16) and thumb-helices (α1, α2, α5, and α6). The AZ1 binding site is located at the center of the S1-site, while the binding sites for VSM and FT206 are positioned further towards the Ub-tail binding channel. Bottom left: For comparison, the structure of USP28ΔUCID (PDB 6HEI; gray, cartoon) in complex with Ub-PA bound to the S1-site (orange, Cα-trace) is shown (Gersch et al, ; Data ref: Gersch and Komander, (2019a). Subdomains and regulatory elements of the catalytic/Ub-tail binding channel (cat: catalytic triad C171, H600, N617; SL: switching loop; BL1/BL2: blocking loops 1/2) are marked. Note that α1 is hardly visible and therefore not labeled. Its N-terminus is marked by the position of the catalytic cysteine. Bottom right: Crystal structure of the auto-inhibited USP25 catalytic domain (PDB 6H4J) (Sauer et al, ; Data ref: Klemm et al, 2019a). The same cleft accommodates the auto-inhibitory tip in the USP28 homolog USP25. Cleft-binding residues of the USP25-tip (I518–Q524) are shown as green sticks. (B) Closeup view of the inhibitor-binding sites. The side chains of residues involved in hydrogen bond formation with the inhibitors, L264 and F292, which move apart to facilitate the binding of AZ1 via π-stacking, and H261 and E366, which close the binding site towards the protein surface, are depicted as sticks. Hydrogen bonds between the inhibitors and USP28 and between H261 and E366, as well as multipolar contacts of the trifluoro-methyl group of AZ1 with adjacent residues are shown as dashed lines. Source data are available online for this figure.
Figure 2
Figure 2. Mechanism of inhibition.
(A) Transition of the USP28 thumb from the apo- to the Ub-bound state. Left panel: Structural alignment of different USP28 apo- (green: USP28cat wt, molecules A/B, (PDB 6HEJ; Gersch et al, ; Data ref: Gersch and Komander, (2019b) and USP28ΔUCID, this work) and Ub-bound structures (orange: USP28cat wt–Ub, molecules A/B, PDB 6HEK and USP28ΔUCID–Ub, (PDB 6HEI) (Gersch et al, ; Data ref: Gersch and Komander, (2019c); Data ref: Gersch and Komander, (2019a). Structural changes in the thumb-core helices α3, α4 and α5 upon Ub-binding are indicated with arrows. Elements of the catalytic channel (switching loop: SL, blocking loops: BL1/2) are marked. Right panel: The USP28 helix α5–Ub interface. Structural alignment of USP28ΔUCID apo- (green: USP28ΔUCID) and Ub-bound structures (orange: USP28ΔUCID—Ub, PDB 6HEI) (Gersch et al, ; Data ref: Gersch and Komander, 2019a). Residues along helix α5 involved in hydrogen bond and salt-bridge formation with Ub are shown as sticks and hydrogen bonds as dashed lines. (B) Inhibitory mechanism: Structural alignments of USP28 Ub-bound (gray: USP28ΔUCID, PDB 6HEI) (Gersch et al, ; Data ref: Gersch and Komander, 2019a) and inhibitor-bound structures (blue: USP28Δtip P280H–AZ1 (left panel), pink: USP28ΔUCID wt–VSM and teal: USP28Δtip wt–FT206 (right panel)). Movement of helices α3, α4 and α5 required to reach the Ub-binding competent state from an inhibitor stabilized state are indicated with arrows. Source data are available online for this figure.
Figure 3
Figure 3. Inhibitor-induced dissociation of USP25 tetramers.
SEC-MALS analysis of 20 µM USP25fl after 45 min incubation with 60 µM AZ1 (purple), 60 µM VSM (pink) or 60 µM FT206 (teal). One representative SEC-MALS experiment is shown for each inhibitor and plotted against a control experiment (DMSO, black). Continuous lines represent the protein concentration signal (refractive index, RI). Dots show the molecular mass calculated from RI and light scattering. Arrows mark the theoretical molecular mass of tetrameric (4) or dimeric (2) USP25fl. Fractions of dimers and tetramers calculated from the average molecular masses of the entire peak fraction are given in the Table as averages of ≥3 independent experiments ± SD. Significances of differences of average molecular masses compared to the DMSO control were calculated using unpaired Student’s t tests. Data Information: DMSO vs. AZ1: P = 1.4*10−4; DMSO vs. VSM: P = 4.4*10−6; DMSO vs. FT206: P = 2.7*10−8. Source data are available online for this figure.
Figure 4
Figure 4. Conservation of the USP inhibitor-binding region.
(A) Sequence conservation between the USP28 and USP25 catalytic domains. Surface map of the USP28Δtip P280H–AZ1 complex structure. Residues identical in USP25 and USP28 are shown in green, type-conserved residues in yellow and non-conserved residues in gray, respectively. The AZ1 molecule in the thumb-palm cleft is shown as sticks and residues of USP28 forming hydrogen bonding or π-stacking interactions with the inhibitor as well as H261 and E366 are highlighted in red. (B) Sequence similarity between human USPs. Sequence alignment of all human USP segments representing the four secondary structures α5 (H261/H268 and D265/D272), α6 (F292/F299), β5 (Q315/Q322) and β8 (E366/E373). Residues identical to those forming bonds with the inhibitors in USP28 as well as H261/268 are highlighted in red. Other residues identical to those in USP28 are highlighted in gray. Source data are available online for this figure.
Figure 5
Figure 5. Biochemical characterization of inhibition by AZ1, VSM and FT206.
(A) Catalytic activity of USP28 and USP25 variants. Bar diagrams representing the Ub-Rh110 cleavage activity of USP28Δtip (left panel) and USP25Δtip (right panel) variants (n ≥ 5, with two biological replicates). Corresponding variants of both DUBs are depicted in the same colors. (B) Inhibitory potencies of AZ1, VSM and FT206. The IC50 values determined in dose–response assays with USP28Δtip and USP25Δtip variants for each inhibitor (n ≥ 5, with two biological replicates) are summarized in the Table. (C) Displacement of the Q315 side chain upon inhibitor binding. Comparison of the positions of the three side chains (H261, Q315 and E366) by superposition of USP28ΔUCID apo (gray) and the inhibitor-bound structures (USP28Δtip P280H–AZ1 (blue), USP28ΔUCID wt–VSM (pink) and USP28Δtip wt–FT206 (teal)), from top to bottom, respectively. Hydrogen bonds between Q315 and E366 or the inhibitors are shown as dashed lines. Binding of the three inhibitors induces similar displacement of the Q315 side chain compared to its position in the apo form which requires the break of a hydrogen bond between Q315 and E366. A new bond is formed between Q315 and AZ1/FT206 but not with VSM. Data Information: Data in (A, B) are presented as average ±SD. All the statistics show the results of unpaired Student’s t tests, with P values (*≤0.05; **≤0.01; ***≤0.001; ****≤0.0001). Source data are available online for this figure.
Figure 6
Figure 6. Role of glutamate 366/373 for α5-mobility.
(A) Closeup view on helices α5. The hydrogen bonding network of E366/E373 of the representative snapshots from cluster 1 of the MD simulations of USP28 and USP25 is shown. The left panel displays superpositions of USP28ΔUCID (green) and the representative snapshot of cluster 1 from USP28ΔUCID (blue) while the right displays the snapshot of USP25ΔUCID (pink). The hydrogen bond network of E366/E373 is highlighted. Corresponding residues are shown as sticks, hydrogen bonds as black dashed lines and sodium ions as purple spheres. Secondary structure elements containing residues mediating bonds with inhibitor (α5, α6, and β8) are marked. (B) E366/E373 influences the mobility of α5. Histograms representing the distances between the Cα of E366/E373 and the geometrical center of the proximal N-terminal turn of helix α5 (residues V256/V263 to F259/F266). The distance measurements are based on the MD simulations conducted with wt (light-) and E366A/E373A (dark-colored) ΔUCID variants of USP28 (left) and USP25 (right panel), respectively. The histogram shows maxima at ~7.5 Å and ~9 Å, which were clustered as clusters 1 and 2, respectively, for consecutive analysis. Source data are available online for this figure.
Figure EV1
Figure EV1. USP28 and USP7-inhibitor complex structures (corresponds to main Fig. 1).
(A) USP28-inhibitor-bound structures. Superposition of the complex structures of USP28 with AZ1 (blue), VSM (magenta) and FT206 (teal) and closeup view on the inhibitor-binding site. Helices α5 are highlighted in the same colors as the inhibitors. (B) USP7-inhibitor complex structures. Superposition of structures of USP7 apo (PDB 1NB8) (Hu et al, ; Data ref: Hu et al, 2003a), Ub-bound (PDB 1NBF) (Hu et al, ; Data ref: Hu et al, 2003b) and in complex with the thumb-palm cleft binding inhibitors Cpd2 (PDB 5WHC; bright green) (Di Lello et al, ; Data ref: Murray et al, 2017a), GNE6776 (Kategaya et al, ; Data ref: Murray et al, b) and the catalytic channel binding inhibitors ALM2 (PDB 5N9R; dark green) (Gavory et al, ; Data ref: Harrison et al, 2017) and FT827 (PDB 5NGF; cyan) (Turnbull et al, ; Data ref: Krajewski et al, 2017). Helices corresponding to USP28 α4, α5 and α6 are colored in light red (apo), yellow (Ub-bound) or gray (inhibitor-bound), respectively. The thumb-palm cleft, the catalytic channel as well as the catalytic cysteine (C223) of USP7 are marked. The USP7 helix corresponding to the USP28 α5 moves upon Ub-binding towards the catalytic channel. This movement is blocked by the displayed inhibitors binding to the thumb-palm cleft or the catalytic channel. (C) Detailed views of the inhibitor-binding sites. AZ1 (left; blue), VSM (center; magenta) and FT206 (right; teal) are shown with the electron density maps of the inhibitors (at 1 σ). Residues of the thumb-palm cleft binding site are shown as sticks. Hydrogen bonds between the inhibitors and USP28 are displayed as dashed lines.
Figure EV2
Figure EV2. Inhibitory mechanism (corresponds to main Fig. 2).
(A) Comparison of USP28 apo, Ub- and inhibitor-bound states. Top panel: Surface view of the USP28ΔUCID apo (this work) and Ub-bound (PDB 6HEI) (Gersch et al, ; Data ref: Gersch and Komander, 2019a) states. Transition from the apo- to the Ub-bound state is accompanied by the reshaping of the S1-site involving closure of the partially open thumb-palm cleft and a widening of the catalytic channel by movement of helix α5 (marked in the apo state). Most residues forming hydrogen bonds and salt bridges with Ub in the S1-site (marked yellow) cluster around the thumb-palm cleft and the catalytic channel. The catalytic cysteine (C171) is highlighted in blue. Bottom panel: Surface view on the inhibitor-bound states. Binding of AZ1, VSM and FT206 in the thumb-palm cleft locks the domain in an apo-like state, where the cleft cannot be closed. Side chains of H261 and E366 which lock the inhibitor-binding sites to the solvent, are highlighted in red. Note that in the apo- and inhibitor-bound states, some mobile elements of the catalytic channel (BL1, SL) are not completely modeled. It therefore appears to be more narrow in the Ub-bound state. (B) Closeup view on helix α5 of inhibitor-bound USP28. USP28Δtip P280H—AZ1 (blue, left panel), USP28ΔUCID wt—VSM (pink, right panel) and USP28Δtip wt— FT206 (teal, right panel) superimposed with Ub-bound USP28ΔUCID (PDB 6HEI) (Gersch et al, ; Data ref: Gersch and Komander, 2019a). Residues of helix α5 involved in hydrogen bonds and salt-bridge formation with Ub and corresponding positions in the inhibitor-bound state are shown as sticks and hydrogen bonds with Ub as dashed lines.
Figure EV3
Figure EV3. Inhibitor concentration-dependent dissociation of USP25 tetramers (corresponds to main Fig. 3).
SEC-MALS analysis of 10 µM USP25fl after 45 min incubation with DMSO (black) or 5 µM (red), 10 µM (blue) and 20 µM (green) of AZ1, VSM or FT206 are displayed in the left panels from top to bottom, respectively. Continuous lines represent the protein concentration signal (refractive index, RI). Dots show the molecular mass calculated from RI and light scattering. Fractions of dimers and tetramers calculated from the average molecular mass of the entire peak fraction, each from a single experiment are represented in the bar diagram on the corresponding right panels. Source data are available online for this figure.
Figure EV4
Figure EV4. (corresponds to main Fig. 5).
(A) Catalytic activity of wt and hyperactive USP28 and USP25 variants. Representative Ub-Rh110 cleavage assay of USP28Δtip (left panel) or USP25Δtip (right panel) variants (wt (blue), E366A/E373A (brown) and E366Q/E373Q (dark blue). The fluorescence signal (RFU*103) is plotted against the time [s]. (B) Inhibitory potencies of AZ1, VSM and FT206. Non-linear regression of the dose–response assay for the different USP28 (left) and USP25 (right panels) Δtip variants with AZ1, VSM and FT206, from top to bottom, respectively. Dots represent the mean ± SD (n ≥ 5, with two biological replicates) at corresponding inhibitor concentrations. The calculated IC50 values are depicted in Fig. 4C. Source data are available online for this figure.
Figure EV5
Figure EV5. (corresponds to main Fig. 6).
(A) Superposition of the representative snapshots of cluster 1 for USP25ΔUCID (pink) and USP28ΔUCID (blue) with the corresponding crystal structure of apo USP28ΔUCID (PDB 6HEJ; green) (Gersch et al, ; Data ref: Gersch and Komander, 2019b). Secondary structure elements containing residues mediating bonds with inhibitor (α5, α6 and β8) are marked. (B) Superposition of the crystal structure of apo USP28ΔUCID (PDB 6HEJ; green) (Gersch et al, ; Data ref: Gersch and Komander, 2019b) and Ub-bound (PDB 6HEI; gray) (Gersch et al, ; Data ref: Gersch and Komander, 2019a) with representative snapshots of cluster 2 for USP28ΔUCID E366A (blue) and USP25ΔUCID E373A (red). Secondary structure elements containing residues mediating bonds with inhibitor (α5, α6, β5 and β8) are marked. (C) Two-dimensional principal subspace displaying the differences between wt and E366A/E373A of USP28 (left) and USP25 ΔUCID variants (right panel). For the initial PCA one frame every 100 ps was utilized for the MD trajectories of USP28ΔUCID E366A and the eigenvectors were constructed based on the ten N-terminal backbone atoms of helix α5 and an alignment onto two adjacent β-strands (L363-F370 and Y643-N649). The first two principal components PC1 and PC2 together capture about 74% of the variance within these coordinates (red). All further PCA calculations, both for USP28 wt (green), USP25 wt (yellow) and E373A (blue) were performed utilizing the same alignment and atom selection as described above. The coordinates were expressed in terms of PC1 and PC2 of USP28 E366A to ensure direct comparability between both wt and E366A/E373A as well as USP25 and USP28. Source data are available online for this figure.

References

    1. Adams PD, Afonine PV, Bunkóczi G, Chen VB, Davis IW, Echols N, Headd JJ, Hung L-W, Kapral GJ, Grosse-Kunstleve RW, et al. PHENIX: a comprehensive Python-based system for macromolecular structure solution. Acta Crystallogr D Biol Crystallogr. 2010;66:213–221. doi: 10.1107/S0907444909052925. - DOI - PMC - PubMed
    1. Aleo E, Henderson CJ, Fontanini A, Solazzo B, Brancolini C. Identification of new compounds that trigger apoptosome-independent caspase activation and apoptosis. Cancer Res. 2006;66:9235–9244. doi: 10.1158/0008-5472.CAN-06-0702. - DOI - PubMed
    1. Alexandrov LB, Nik-Zainal S, Wedge DC, Aparicio SAJR, Behjati S, Biankin AV, Bignell GR, Bolli N, Borg A, Børresen-Dale A-L, et al. Signatures of mutational processes in human cancer. Nature. 2013;500:415–421. doi: 10.1038/nature12477. - DOI - PMC - PubMed
    1. Altun, Kramer M, Willems HB, McDermott LI, Leach JL, Goldenberg CA, Kumar KGS SJ, Konietzny R, Fischer R, Kogan E, et al. Activity-based chemical proteomics accelerates inhibitor development for deubiquitylating enzymes. Chem Biol. 2011;18:1401–1412. doi: 10.1016/j.chembiol.2011.08.018. - DOI - PubMed
    1. Báez-Santos YM, Barraza SJ, Wilson MW, Agius MP, Mielech AM, Davis NM, Baker SC, Larsen SD, Mesecar AD. X-ray structural and biological evaluation of a series of potent and highly selective inhibitors of human coronavirus papain-like proteases. J Med Chem. 2014;57:2393–2412. doi: 10.1021/jm401712t. - DOI - PMC - PubMed

MeSH terms

LinkOut - more resources