. 2024 Jul;4(7):926-938.
doi: 10.1038/s43587-024-00642-y. Epub 2024 May 30.

SGLT2 inhibition eliminates senescent cells and alleviates pathological aging

Affiliations

SGLT2 inhibition eliminates senescent cells and alleviates pathological aging

Goro Katsuumi et al. Nat Aging. 2024 Jul.

Abstract

It has been reported that accumulation of senescent cells in various tissues contributes to pathological aging and that elimination of senescent cells (senolysis) improves age-associated pathologies. Here, we demonstrate that inhibition of sodium-glucose co-transporter 2 (SGLT2) enhances clearance of senescent cells, thereby ameliorating age-associated phenotypic changes. In a mouse model of dietary obesity, short-term treatment with the SGLT2 inhibitor canagliflozin reduced the senescence load in visceral adipose tissue and improved adipose tissue inflammation and metabolic dysfunction, but normalization of plasma glucose by insulin treatment had no effect on senescent cells. Canagliflozin extended the lifespan of mice with premature aging even when treatment was started in middle age. Metabolomic analyses revealed that short-term treatment with canagliflozin upregulated 5-aminoimidazole-4-carboxamide-1-β-D-ribofuranoside, enhancing immune-mediated clearance of senescent cells by downregulating expression of programmed cell death-ligand 1. These findings suggest that inhibition of SGLT2 has an indirect senolytic effect by enhancing endogenous immunosurveillance of senescent cells.


Conflict of interest statement

T.M. discloses research funds and remuneration for lectures from Mitsubishi Tanabe Pharma Corporation. Canagliflozin was provided by Mitsubishi Tanabe Pharma Corporation. The funder of the study had no role in the design and conduct of the study, the collection, management, analysis and interpretation of the data, the preparation, review or approval of the manuscript, and the decision to submit the manuscript for publication. The other authors declare no competing interests.

Figures

Fig. 1
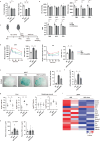
Fig. 1. Effects of SGLT2 inhibition on senescent cells in visceral adipose tissue.
a, Protocol of the experiments to test the senolytic effects of short-term treatment with canagliflozin (Cana). b, Body weight and gWAT weight of mice fed NC or HFD with or without canagliflozin (n = 25 each). c, GTT (n = 5, 6) and ITT (n = 12 each) of mice as prepared in b. GTT and ITT were performed from day 4 to day 7 after starting canagliflozin administration. d, SA-β-gal activity in gWAT of mice as prepared in b (n = 22, 23, 23). e, Western blot analysis for p53 in gWAT of mice as prepared in b (n = 8 each, from three gels/blots processed in parallel). f, qPCR analysis for Cdkn1a, Cdkn2a, Tnf and Ccl2 in gWAT of mice as prepared in b (n = 15, 16, 16). g, Hematoxylin-eosin (HE) staining and dihydroethidium (DHE) assay in gWAT of mice as prepared in b (n = 6 each). h, p19Arf-dependent luciferase activity of mice on HFD after short-term administration of canagliflozin with or without DT treatment (n = 6, 10, 6, 8). i, SA-β-gal activity in gWAT of mice as prepared in h (n = 6, 8, 6, 8). Data were analyzed by two-way ANOVA followed by Tukey’s multiple comparison test (for equal variance) or Dunnett’s multiple comparison test (for unequal variance) (b,di), repeated measures analysis (c) or two-tailed unpaired Student’s t-test (c). *P < 0.05; **P < 0.01; NS, not significant. Exact P values: NC versus HFD <0.0001 (body weight and gWAT weight), NC versus HFD + Cana <0.0001 (body weight and gWAT weight), HFD versus HFD + Cana 0.0553 (body weight) and 0.8961 (gWAT weight) (b); HFD versus HFD + Cana 0.0003 (GTT-trend), 0.0015 (GTT-AUC), 0.0127 (ITT-trend) and 0.2013 (ITT-AUC) (c); NC versus HFD <0.0001, HFD versus HFD + Cana 0.0267 (d); NC versus HFD 0.0308, HFD versus HFD + Cana 0.0443 (e); NC versus HFD: 0.0272 (Cdkn1a), 0.0036 (Cdkn2a), <0.0001 (Tnf) and 0.0003 (Ccl2), HFD versus HFD + Cana 0.0353 (Cdkn1a), 0.0472 (Cdkn2a), 0.0219 (Tnf) and 0.1097 (Ccl2) (f); NC versus HFD 0.0038 (crown-like structure count) and 0.007 (DHE); HFD versus HFD + Cana 0.0255 (crown-like structure count) and 0.0042 (DHE) (g); HFD versus HFD + DT <0.0001, HFD versus HFD + Cana <0.0001, HFD versus HFD + DT + Cana <0.0001 (h); HFD versus HFD + DT <0.0001, HFD versus HFD + DT + Cana <0.0001 and HFD versus HFD + Cana 0.0002 (i). Data are shown as the mean ± s.e. in plots of all individual data (bi) or as the mean ± s.e. in the spaghetti plot shown in Supplementary Fig. 1 (c). MW, molecular weight; WO, weeks old; AUC, area under the curve. Source data
Fig. 2
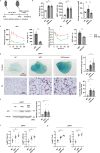
Fig. 2. Potential mechanism of the senolytic effects of SGLT2 inhibition.
a, Plasma AICAR level of mice fed NC or HFD with or without canagliflozin (n = 4 each). C3d, canagliflozin treatment for 3 days; C7d, canagliflozin treatment for 7 days. b, Western blot analysis for p-AMPK, AMPK and tubulin in gWAT of mice as prepared in a (n = 4 each from 2 gels/blots processed in parallel). c, Protocol of the experiments to test the senolytic effects of short-term treatment with AICAR. d, Body weight, gWAT weight and fasting blood glucose of mice fed NC or HFD with or without AICAR (n = 9, 11, 11). e, SA-β-gal activity in gWAT of mice as prepared in d (n = 9, 11, 11). f, Protocol of the experiments to test the effects of Compound C (Comp. C) on canagliflozin treatment. g, Body weight, gWAT weight and fasting blood glucose of HFD-fed mice after canagliflozin treatment with or without Comp. C (n = 15, 15, 16). h, SA-β-gal activity in gWAT of mice as prepared in g (n = 15, 15, 16). The data were analyzed by two-way ANOVA followed by Tukey’s multiple comparison test (for equal variance) or Dunnett’s multiple comparison test (for unequal variance) (a,b,d,e,g,h). *P < 0.05, **P < 0.01. Exact P values: NC versus HFD + C3d 0.0317, NC versus HFD + C7d 0.0371, HFD versus HFD + C3d 0.0322, HFD versus HFD + C7d 0.0443 (a); HFD versus HFD + C3d 0.038 (p-AMPK/AMPK) (b); NC versus HFD <0.0001 (body weight and gWAT weight) and 0.0007 (fasting blood glucose), NC versus HFD + AICAR <0.0001 (body weight, gWAT weight and fasting blood glucose), HFD versus HFD + Cana 0.0457 (fasting blood glucose) (d); NC versus HFD <0.0001, NC versus HFD + AICAR 0.0014, HFD versus HFD + Cana 0.0076 (e); HFD versus HFD + Cana <0.0001 (fasting blood glucose), HFD versus HFD + Cana + Comp. C <0.0001 (fasting blood glucose) (g); HFD versus HFD + Cana 0.0002, and HFD + Cana versus HFD + Cana + Comp. C 0.0346 (h). Data are shown as the mean ± s.e. in plots of all individual data (a,b,d,e,g,h). t-AMPK, total AMPK. Source data
Fig. 3
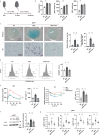
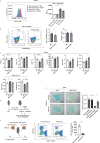
Fig. 3. Effects of SGLT2 inhibition on PD-L1 expression by senescent cells.
a, FACS analysis for PD-L1+SPiDER-βGal+ cells in stromal vascular fraction (SVF) obtained from gWAT of mice fed NC or HFD with or without canagliflozin (Cana) (n = 3, 5, 5) on day 7. b, FACS analysis for immune cells in gWAT of mice as prepared in a (n = 8, 9, 8) on day 7. c, FACS analysis for PD-L1+SPiDER-βGal+ cells in SVF from gWAT of mice fed NC or HFD with or without AICAR (n = 4, 5, 5) on day 7. d, FACS analysis for PD-L1+SPiDER-βGal+ cells in SVF from gWAT of HFD-fed mice after canagliflozin treatment with or without Compound C (Comp. C) (n = 5 each) on day 7. e, Matrigel transplantation model containing senescent cells (n = 4 each). Data were analyzed by two-way ANOVA followed by Tukey’s multiple comparison test (for equal variance) or Dunnett’s multiple comparison test (for unequal variance) (ae). *P < 0.05, **P < 0.01. Exact P values: NC versus HFD 0.0003 (PD-L1+SPiDER+ cells) and <0.0001 (SPiDER+ cells), HFD versus HFD + Cana 0.0396 (PD-L1+SPiDER+ cells) and 0.0127 (SPiDER+ cells) (a); NC versus HFD 0.0002 (Macrophage), 0.048 (NK cell), 0.0267 (CD8+ T cell) and 0.0034 (CD69+CD8+ T cell), HFD versus HFD + Cana 0.0022 (macrophage), 0.0098 (NK cell), 0.0164 (CD8+ T cell) and 0.0177 (CD69+CD8+ T cell) (b); NC versus HFD 0.0082 (PD-L1+SPiDER+ cells) and <0.0001 (SPiDER+ cells), HFD versus HFD + AICAR 0.0463 (PD-L1+SPiDER+ cells) and 0.001 (SPiDER+ cells) (c); HFD versus HFD + Cana 0.0029 (PD-L1+SPiDER+ cells) and <0.0001 (SPiDER+ cells), HFD + Cana versus HFD + Cana + Comp. C 0.0011 (PD-L1+SPiDER+ cells) and <0.0001 (SPiDER+ cells) (d); sh-Cont versus Cana + sh-Cont 0.0291 (relative tdTomato intensity) and 0.0444 (tdTomato+ senescent cells count), Cana + sh-Cont versus Cana +sh-Prkaa1 0.0273 (relative tdTomato intensity) and 0.0269 (tdTomato+ senescent cells count) (e). Data are shown as the mean ± s.e. in plots of all individual data (ae). Gating strategy in FACS analysis was shown in Supplementary Fig. 3a (a,c,d), 3b (b) and 3c (e). Source data
Fig. 4
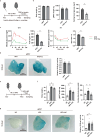
Fig. 4. Effects of SGLT2 inhibitor on aging phenotypes.
a,b, ApoE-KO mice were fed WD for 12 weeks and then treated with canagliflozin (Cana) for 2 weeks (WD + Cana). Body weight (n = 15, 13) (a), fasting blood glucose level and the lipid profile (n = 8 each) (b) were examined. c, SA-β-gal activity in the aorta of mice as prepared in a (n = 4 each). d, Oil Red O staining in the aorta of mice as prepared in a (n = 12 each). e, qPCR analysis for Cdkn1a, Icam1 and Tnf in the aorta of mice as prepared in a (n = 13, 12). f, FACS analysis for SPiDER-βGal+ cells in the aorta of mice as prepared in a (n = 5, 4). g, Lifespan of Zmpste24 KO mice treated with canagliflozin (Cana) or vehicle (Cont) from 12 weeks of age (n = 46, 44 for males; n = 44, 38 for females). h, Middle-aged mice were treated with Cana or vehicle (Cont) from the age of 50 weeks and examined for physical activity at 70 weeks of age (n = 14, 12). i, SA-β-gal activity in gWAT of mice as prepared in h (n = 4, 5). Data were analyzed by two-tailed unpaired Student’s t-test (af,h,i). *P < 0.05, **P < 0.01. Exact P values: WD versus WD + Cana 0.0417 (c); WD versus WD + Cana 0.0085 (d); WD versus WD + Cana 0.0071 (Cdkn1a), 0.0258 (Icam1) and 0.0536 (Tnf) (e); WD versus WD + Cana 0.0438 (f); Cont versus Cana 0.0244 (male), 0.0446 (female) and 0.0038 (all) (g); Cont versus Cana 0.0279 (grip strength) and 0.0074 (rotarod running time) (h); Cont versus Cana 0.0408 (i). Data are shown as the mean ± s.e. in plots of all individual data (af,h,i). Survival curves were generated using the Kaplan–Meier method and compared with the log-rank test. In all analyses, P < 0.05 was considered to indicate statistical significance (g). Gating strategy in FACS analysis was shown in Supplementary Fig. 3d (f). FFA, free fatty acid; HDL-C, high-density lipoprotein cholesterol; LDL-C, low-density lipoprotein cholesterol; TC, total cholesterol; TG, triglyceride. Source data
Extended Data Fig. 1
Extended Data Fig. 1. Effects of SGLT2 inhibition on senescent cells in visceral adipose tissue.
a, Food intake of mice prepared according to the experimental protocol shown in Fig. 1a (n = 6 each). b, Oxygen consumption (VO2), CO2 emission (VCO2), and respiratory exchange ratio (RER) of mice as prepared in Extended Data Fig. 1a (n = 5, 6, 5). c, Protocol for performing the glucose tolerance test (GTT) and insulin tolerance test (ITT) after 1 week of canagliflozin administration followed by 1 week of no canagliflozin administration. NC, normal chow; HFD, high-fat diet. d, Glucose tolerance test (GTT) and insulin tolerance test (ITT) of mice as prepared in Extended Data Fig. 1c (n = 5 each). WO, wash out. e, SA-β-gal activity in gonadal white adipose tissue (gWAT) of mice as prepared in Extended Data Fig. 1c (n = 5 each). f, Immunostaining for p53 in gWAT as prepared in Extended Data Fig. 1a (n = 4, 3, 4). g, qPCR analysis for Cdkn1a and Cdkn2a in multiple organs of mice as prepared in Extended Data Fig. 1a (Liver, n = 6 each; Muscle, n = 5 each). h, ELISA for CCL2 (n = 11, 12, 11) and TNFα (n = 10, 12, 12) in the blood of mice as prepared in Extended Data Fig. 1a. i, RNA-sequence analysis for inflammatory molecules in gWAT of mice as prepared in Extended Data Fig. 1a (n = 2 each). Data were analyzed by two-way ANOVA followed by Tukey’s multiple comparison test (for equal variance) or Dunnett’s multiple comparison test (for unequal variance) (a, b, d–h). *P < 0.05, **P < 0.01. Exact P-value: NC versus HFD: 0.0003 (Food intake) and < 0.0001 (Water intake), NC versus HFD+Cana: < 0.0001 (Food intake and Water intake), HFD versus HFD+Cana: 0.008 (Water intake) (a); NC versus HFD: 0.0003 (VCO2-light and VCO2-24 hr), 0.0004 (VCO2-dark), 0.0006 (RER-light and RER-dark) and 0.0005 (RER-24 hr), NC versus HFD+Cana: 0.0003 (VCO2-light), 0.0007 (VCO2-dark), 0.0001 (VCO2-24 hr), < 0.0001 (RER-light, RER-dark and RER-24 hr) (b); NC versus HFD: < 0.0001 (GTT-trend, GTT-AUC, ITT-trend and ITT-AUC), HFD versus HFD+Cana(WO): 0.0086 (GTT-trend), 0.0029 (GTT-AUC), < 0.0001 (ITT-trend), 0.0004 (ITT-AUC) (d); NC versus HFD: < 0.0001, HFD versus HFD+Cana(WO): 0.0035 (e); NC versus HFD: 0.003, HFD versus HFD+Cana(WO): 0.0291 (f); NC versus HFD: 0.0122 (Liver-Cdkn2a) and 0.0017 (Liver-Cdkn1a), HFD versus HFD+Cana: 0.0097 (Liver-Cdkn2a) and 0.0003 (Liver-Cdkn1a) (g); NC versus HFD: 0.0009 (CCL2), HFD versus HFD+Cana: 0.0575 (CCL2) (h). Data are shown as the mean ± SE in plots of all individual data (a, b, d–h) or as the mean ± SE in the spaghetti plot shown in Supplementary Fig. 1 (d). Source data
Extended Data Fig. 2
Extended Data Fig. 2. Effects of longer SGLT2 inhibition on senescent cells in visceral adipose tissue.
a, Protocol of the experiments to test the senolytic effects of 4 weeks of treatment with canagliflozin (Cana). NC, normal chow; HFD, high-fat diet. b, Body weight and weight of gonadal white adipose tissue (gWAT) and inguinal WAT (iWAT) in mice fed NC or HFD with or without canagliflozin (n = 5 each). c, SA-β-gal activity (n = 9 each) and hematoxylin and eosin (HE) staining (n = 3 each) in gWAT of mice as prepared in Extended Data Fig. 2b. d, FACS analysis for SPiDERβ-gal + cells in gWAT of mice as prepared in Extended Data Fig. 2b (n = 4, 5, 6). e, Glucose tolerance test (n = 6 each) and insulin tolerance test (n = 5, 5, 6) of mice as prepared in Extended Data Fig. 2b. f, Western blot analysis for p53 in gWAT of mice as prepared in Extended Data Fig. 2b (n = 9, 9, 8 from 3 gels/blots processed in parallel). g, qPCR analysis for Cdkn1a, Cdkn2a, Tnf, and Ccl2 in gWAT of mice as prepared in Extended Data Fig. 2b (n = 13,15,15). Data were analyzed by two-way ANOVA followed by Tukey’s multiple comparison test (for equal variance) or Dunnett’s multiple comparison test (for unequal variance) (b–g) or repeated measures analysis (e). *P < 0.05, **P < 0.01. Exact P-value: NC versus HFD: 0.0003 (Body weight), 0.0053 (gWAT weight) and < 0.0001 (iWAT weight), NC versus HFD+Cana: 0.001 (Body weight), 0.0002 (gWAT weight) and < 0.0001 (iWAT weight) (b); NC versus HFD: 0.0016 (SA-β-gal activity) and 0.0004 (Crown-like structure count), HFD versus HFD+Cana: 0.0071 (SA-β-gal activity) and 0.0031 (Crown-like structure count) (c); NC versus HFD: 0.0219, HFD versus HFD+Cana: 0.0119 (d); NC versus HFD: < 0.0001 (GTT-trend, ITT-trend, and ITT-AUC) and 0.0002 (GTT-AUC), HFD versus HFD+Cana: < 0.0001 (GTT-trend), 0.0002 (GTT-AUC), 0.0013 (ITT-trend) and 0.0228 (ITT-AUC) (e); NC versus HFD: < 0.0001, HFD versus HFD+Cana: 0.039 (f); NC versus HFD: 0.0228(Cdkn1a) and < 0.0001 (Cdkn2a, Ccl2, and Tnf), HFD versus HFD+Cana: 0.0122 (Cdkn1a), 0.0075 (Cdkn2a), < 0.0001 (Ccl2) and 0.013 (Tnf) (g). Data are shown as the mean ± SE in plots of all individual data (b–g) or as the mean ± SE in the spaghetti plot shown in Supplementary Fig. 1 (e). Gating strategy in FACS analysis was shown in Supplementary Fig. 3c (d). Source data
Extended Data Fig. 3
Extended Data Fig. 3. Effects of insulin treatment on senescent cells in visceral adipose tissue.
a, Protocol of the experiments to test the senolytic effects of short-term treatment with insulin. NC, normal chow; HFD, high-fat diet. b, Body weight and gonadal white adipose tissue (gWAT) weight of mice fed NC or HFD with or without insulin (Ins) (n = 12 each). c, Glucose tolerance test and insulin tolerance test of mice as prepared in Extended Data Fig. 3b (n = 6 each). d, SA-β-gal activity (n = 12 each) and hematoxylin and eosin (HE) staining (n = 6 each) in gWAT of mice as prepared in Extended Data Fig. 3b. e, Western blot analysis for p53 in gWAT of mice as prepared in Extended Data Fig. 3b (n = 12 each from 4 gels/blots processed in parallel). f, qPCR analysis for Cdkn1a and Cdkn2a in gWAT of mice as prepared in Extended Data Fig. 3b (n = 12 each). g, qPCR analysis for Ccl2 and Tnf in gWAT of mice as prepared in Extended Data Fig. 3b (n = 12 each). Data were analyzed by two-way ANOVA followed by Tukey’s multiple comparison test (for equal variance) or Dunnett’s multiple comparison test (for unequal variance) (b, d–g), repeated measures analysis (c), or two-tailed unpaired Student’s t-test (c). *P < 0.05, **P < 0.01. Exact P-value: NC versus HFD: < 0.0001 (Body weight and gWAT weight) and 0.0011 (Fasting blood glucose), NC versus HFD+Ins: < 0.0001 (Body weight and gWAT weight), HFD versus HFD+Ins: 0.0001 (Fasting blood glucose) (b); HFD versus HFD+Ins: < 0.0001 (GTT-trend and ITT-trend), 0.0029 (GTT-AUC) and 0.0044 (ITT-AUC) (c); NC versus HFD: 0.0001 (SA-β-gal activity) and 0.0262 (Crown-like structure count), NC versus HFD+Ins: 0.0003 (SA-β-gal activity) and 0.0022 (Crown-like structure count) (d); NC versus HFD: 0.0152, NC versus HFD+Ins: 0.033 (e); NC versus HFD: 0.0092 (Cdkn1a) and 0.0003 (Cdkn2a), NC versus HFD+Ins: 0.0001 (Cdkn1a) and < 0.0001 (Cdkn2a) (f); NC versus HFD: < 0.0001 (Ccl2 and Tnf), and NC versus HFD+Ins: < 0.0001 (Ccl2 and Tnf) (g). Data are shown as the mean ± SE in plots of all individual data (b–g) or as the mean ± SE in the spaghetti plot shown in Supplementary Fig. 1 (c). Source data
Extended Data Fig. 4
Extended Data Fig. 4. Effects of normalization of glucose metabolism on senescent cells in visceral adipose tissue.
a, Protocol of the experiments to test the senolytic effects of 4 weeks of treatment with insulin. NC, normal chow; HFD, high-fat diet. b, Body weight, gonadal white adipose tissue (gWAT) weight, and fasting blood glucose of mice fed NC or HFD with or without insulin (Ins) (n = 5 each). c, Glucose tolerance test and insulin tolerance test in mice as prepared in Extended Data Fig. 4b (n = 5 each). d, SA-β-gal activity in gWAT of mice as prepared in Extended Data Fig. 4b (n = 5 each). e, Protocol of the experiments to test the senolytic effects of returning to NC after receiving HFD. NC, normal chow; HFD, high-fat diet. f, Body weight, gWAT weight, and fasting blood glucose of mice prepared according to the protocol shown in Extended Data Fig. 4e (n = 9 each). g, SA-β-gal activity in gWAT of mice as prepared in Extended Data Fig. 4f (n = 9 each). Data were analyzed by two-tailed unpaired Student’s t-test (b–d) or two-way ANOVA followed by Tukey’s multiple comparison test (for equal variance) or Dunnett’s multiple comparison test (for unequal variance) (f, g) or repeated measures analysis (c). *P < 0.05, **P < 0.01. Exact P-value: HFD versus HFD+Ins: 0.0005 (Fasting blood glucose) (b); HFD versus HFD+Ins: < 0.0001 (GTT-trend), 0.0029 (GTT-AUC), 0.0009 (ITT-trend) and 0.0058 (ITT-AUC) (c); NC versus HFD: < 0.0001 (Body weight and gWAT weight) and 0.0002 (Fasting blood glucose), NC versus HFD- > NC: <0.0001 (Body weight and gWAT weight), HFD versus HFD- > NC: 0.0073 (Body weight) and < 0.0001 (Fasting blood glucose) (f); NC versus HFD: 0.0001, and NC versus HFD- > NC: 0.0002 (g). Data are shown as the mean ± SE in plots of all individual data (b–d, f, g) or as the mean ± SE in the spaghetti plot shown in Supplementary Fig. 1 (c). Source data
Extended Data Fig. 5
Extended Data Fig. 5. Potential mechanism of the senolytic effects of SGLT2 inhibition.
a, MTT assay in human umbilical vein endothelial cells (HUVEC, young vs. replicative senescent cells, n = 3 each) or human fibroblasts (IMR90, young vs. irradiation-induced senescent cells, n = 6 each) treated with canagliflozin (Cana) for 48 hours. b, Western blot analysis for phospho-AMP-activated protein kinase (p-AMPK), AMPK, and tubulin in multiple organs of mice as prepared in Fig. 2a (Liver, n = 4, 4, 6 from 2 gels/blots processed in parallel; Muscle, n = 4, 3, 5 from 2 gels/blots processed in parallel). c, Body weight, gonadal white adipose tissue (gWAT) weight, and SA-β-gal activity in gWAT of HFD-fed mice after treatment with or without Comp C (n = 3, 4). Data were analyzed by two-way ANOVA followed by Tukey’s multiple comparison test (a, b) or two-tailed unpaired Student’s t-test (c). *P < 0.05; **P < 0.01; ns, not significant. Exact P-value: Young HUVEC: 0.0058 (0 μM versus 10 μM) and < 0.0001 (0 μM versus 50 μM), Senescent HUVEC: 0.0032 (0 μM versus 10 μM) and < 0.0001 (0 μM versus 50 μM), Young IMR90: < 0.0001 (0 μM versus 50 μM), and Senescent IMR90: 0.035 (0 μM versus 1 μM) and < 0.0001 (0 μM versus 50 μM) (a); HFD versus HFD+C3d: 0.0408 (Liver-pAMPK/tAMPK) (b); HFD versus HFD+Comp.C: 0.5899 (Body weight) and 0.3911 (gWAT weight) (c). Data are shown as the mean ± SE in plots of all individual data (a–c). Source data
Extended Data Fig. 6
Extended Data Fig. 6. SGLT2 inhibition affects PD-L1 expression by senescent cells.
a, FACS analysis for PD-L1 expression in irradiation-induced senescent HUVEC after 6 hours of AICAR treatment (n = 3 each). b, FACS analysis for PD-L1+ SPiDERβ-gal+ cells in stromal vascular fraction (SVF) obtained from gonadal white adipose tissue (gWAT) of high-fat diet (HFD) with or without canagliflozin (Cana) (n = 5, 7) on day 3. c, FACS analysis for immune cells in spleen and bone marrow of mice as prepared in Fig. 3a (n = 5 each). d, Protocol of the experiments to test the effects of CD3-neutralizung antibody on the senolytic effects of canagliflozin. NC, normal chow; HFD, high-fat diet. e, SA-β-gal activity in gWAT of mice as prepared in Extended Data Fig. 6d (n = 5, 4, 6, 5). f, FACS analysis of Matrigel transplantation model containing senescent fibroblasts (IR+) or non-senescent fibroblasts (IR–) (n = 5 each). IR, irradiation. Data were analyzed by two-way ANOVA followed by Tukey’s multiple comparison test (a, c, e) or two-tailed unpaired Student’s t-test (b, f). *P < 0.05, **P < 0.01. Exact P-value: Non-senescent+PBS versus Senescent+PBS: 0.0001, Senescent+PBS versus Senescent+AICAR: 0.0223 (a); HFD versus HFD+Cana3d: 0.0462 (PD-L1+ SPiDER+ cell) (b); NC versus HFD: 0.1075 (Spleen-T cell), 0.0503 (Spleen-CD8+ T cell), 0.0039 (BM-Myeloid) and 0.002 (BM-Lymphoid), HFD versus HFD+Cana: 0.0219 (T cell), 0.0345 (CD8+ T cell), 0.0328 (CD69+CD8+ T cell), 0.0433 (BM-Myeloid) and 0.062 (BM-Lymphoid) (c); HFD+contIgG versus HFD+Cana+contIgG: 0.0024, HFD+Cana+contIgG versus HFD+Cana+CD3εAb: 0.0405 (e); and Non-senescent versus Senescent: < 0.0001 (f). Data are shown as the mean ± SE in plots of all individual data (a–c, e, f). Gating strategy in FACS analysis was shown in Supplementary Fig. 3a (b), d (f), e (a), f (c), and g (c). Source data

References

    1. Minamino T, Komuro I. Vascular aging: insights from studies on cellular senescence, stem cell aging, and progeroid syndromes. Nat. Clin. Pract. Cardiovasc. Med. 2008;5:637–648. doi: 10.1038/ncpcardio1324. - DOI - PubMed
    1. Lopez-Otin C, Blasco MA, Partridge L, Serrano M, Kroemer G. Hallmarks of aging: an expanding universe. Cell. 2023;186:243–278. doi: 10.1016/j.cell.2022.11.001. - DOI - PubMed
    1. Munoz-Espin D, Serrano M. Cellular senescence: from physiology to pathology. Nat. Rev. Mol. Cell Biol. 2014;15:482–496. doi: 10.1038/nrm3823. - DOI - PubMed
    1. Minamino T, et al. Endothelial cell senescence in human atherosclerosis: role of telomere in endothelial dysfunction. Circulation. 2002;105:1541–1544. doi: 10.1161/01.CIR.0000013836.85741.17. - DOI - PubMed
    1. Yokoyama M, et al. p53 plays a crucial role in endothelial dysfunction associated with hyperglycemia and ischemia. J. Mol. Cell. Cardiol. 2019;129:105–117. doi: 10.1016/j.yjmcc.2019.02.010. - DOI - PubMed

Substances

LinkOut - more resources