. 2024 Jul;4(7):998-1013.
doi: 10.1038/s43587-024-00631-1. Epub 2024 May 30.

Aging atlas reveals cell-type-specific effects of pro-longevity strategies

Affiliations

Aging atlas reveals cell-type-specific effects of pro-longevity strategies

Shihong Max Gao et al. Nat Aging. 2024 Jul.

Abstract

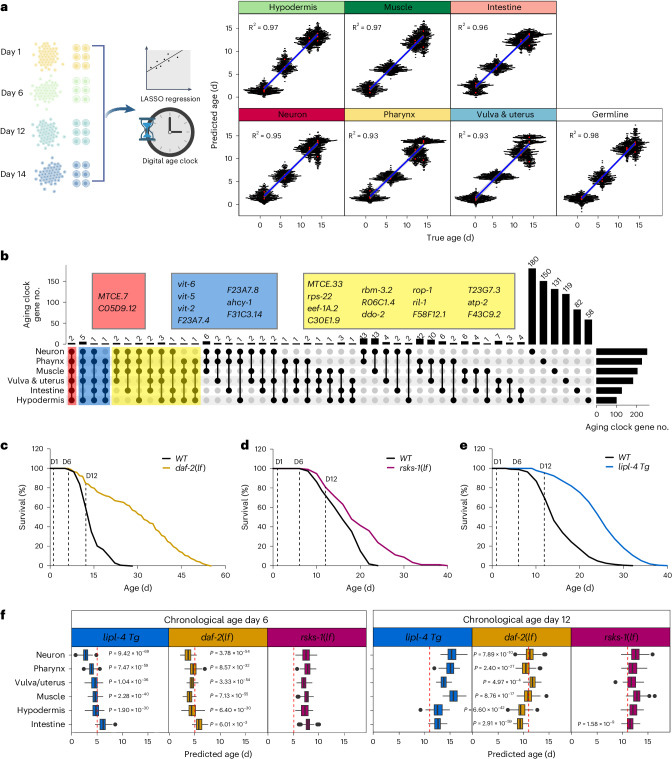
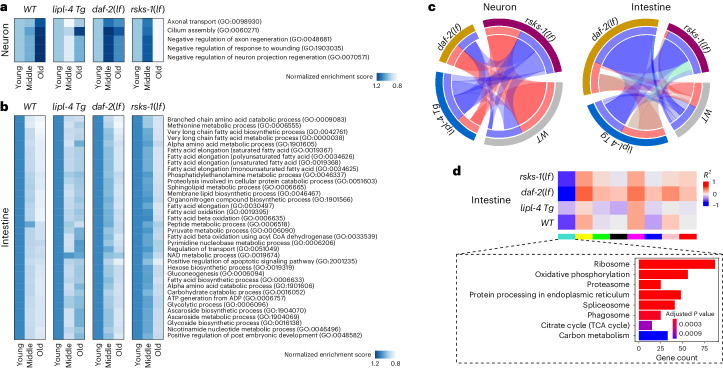
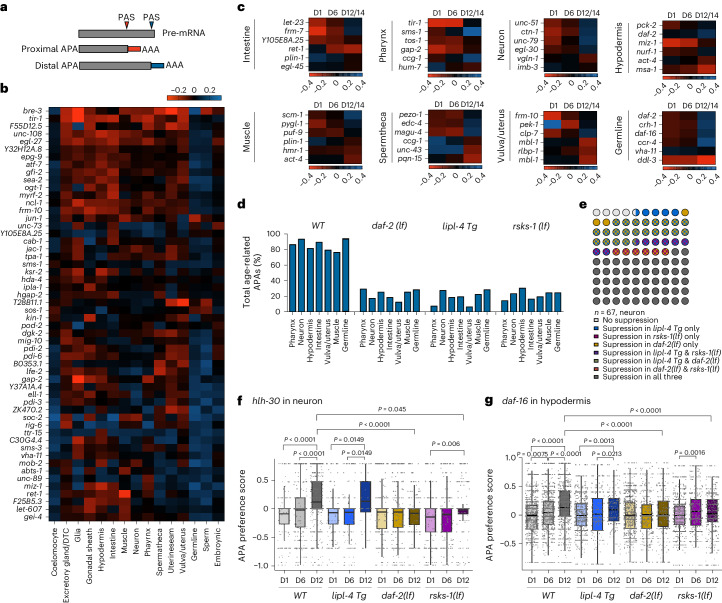
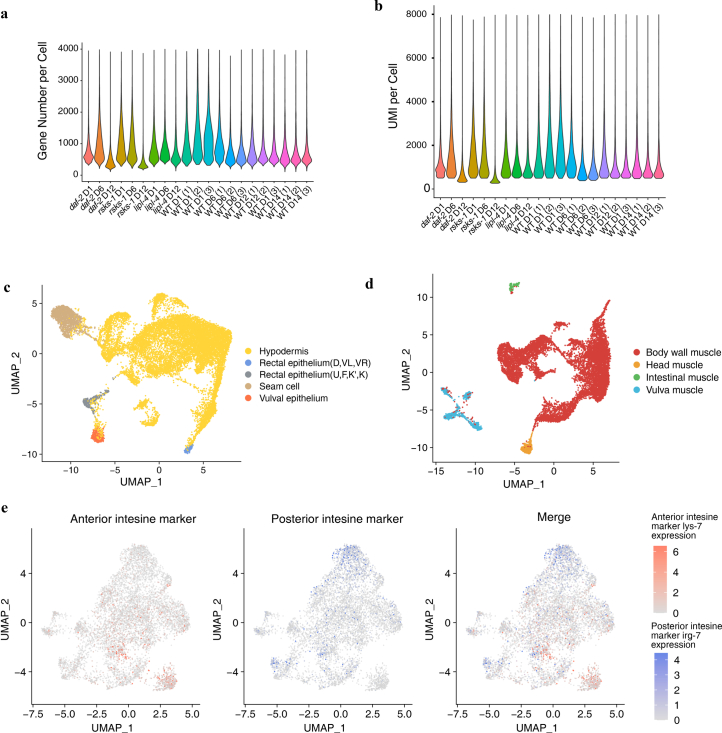
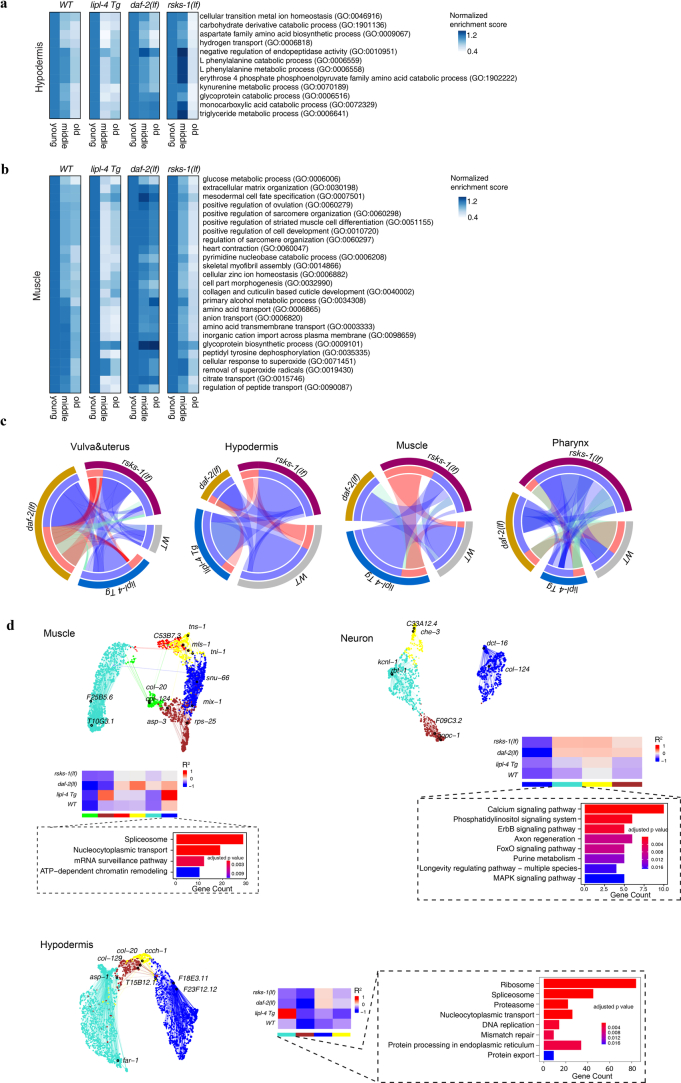
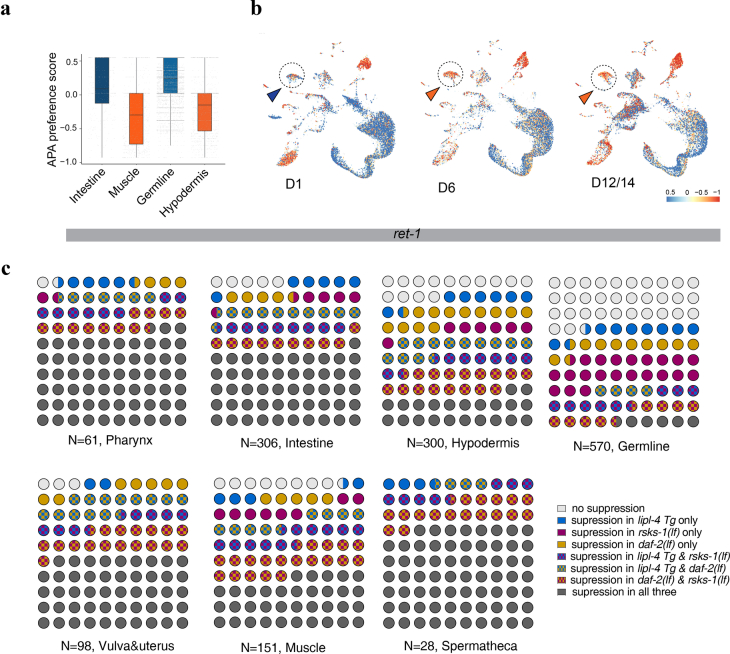
Organismal aging involves functional declines in both somatic and reproductive tissues. Multiple strategies have been discovered to extend lifespan across species. However, how age-related molecular changes differ among various tissues and how those lifespan-extending strategies slow tissue aging in distinct manners remain unclear. Here we generated the transcriptomic Cell Atlas of Worm Aging (CAWA, http://mengwanglab.org/atlas ) of wild-type and long-lived strains. We discovered cell-specific, age-related molecular and functional signatures across all somatic and germ cell types. We developed transcriptomic aging clocks for different tissues and quantitatively determined how three different pro-longevity strategies slow tissue aging distinctively. Furthermore, through genome-wide profiling of alternative polyadenylation (APA) events in different tissues, we discovered cell-type-specific APA changes during aging and revealed how these changes are differentially affected by the pro-longevity strategies. Together, this study offers fundamental molecular insights into both somatic and reproductive aging and provides a valuable resource for in-depth understanding of the diversity of pro-longevity mechanisms.


Conflict of interest statement

The authors declare no competing interests.

Figures

Fig. 1
Fig. 1. Adult C. elegans cell atlas at single-cell resolution.
a, Schematics of single-cell transcriptome profiling pipeline in adult C. elegans. The process begins with harvesting and homogenizing approximately 2,000 worms to isolate nuclei. These nuclei are subsequently stained with Hoechst dye and sorted through FACS to select for positively stained nuclei. FACS gating graphs based on Hoechst staining intensity show a clear separation between intact nuclei and debris, ensuring the quality of subsequent snRNA-seq analyses. The selected nuclei are then used to build an snRNA library to conduct next-generation sequencing. b, Anatomical illustration of an adult C. elegans, detailing major tissues. c,d, UMAP plot visualization of 241,969 single nuclei from adult C. elegans cell atlas. Colored clusters correspond to 15 major tissues and ARSC. The numbers in parentheses are the numbers of nuclei in each tissue. DTC, distal tip cells. Tissues marked with * can be further subclustered. Seventy-seven subsets of neurons are shown in d and others in Extended Data Fig. 1.
Fig. 2
Fig. 2. Systemic view of cell-type-specific transcriptional and functional landscape.
a, Dot plot visualizing the cell-type-specific expression pattern of housekeeping genes (blue) and known (red) and newly identified (black) gene markers for each major tissue. Housekeeping genes rpl-32 and pmp-3 show pan-cell expression. Dot size corresponds to the percentage of cells within a specific tissue expressing the marker gene, and the color intensity indicates the average expression level of the gene across the tissue. b, Heatmaps showing the expression levels of the tissue-specific TFs (right) with the corresponding enrichment scores of their target genes (left) in each tissue. c,d, Heatmaps of tissue-specific functional modalities selected based on the enrichment scores using InterPro (c) and KEGG (d) pathway analyses. cNMP-bd_dom, cyclic nucleotide-binding domain; CNNM, cyclic nucleotide-binding domain; F-box_dom, F-box domain; Histone_H2A_C, histone H2A, C-terminal domain; Neur_chan_lig-bd, neurotransmitter-gated ion-channel ligand-binding domain; SAM, sterile alpha motif domain; SSD, sterol-sensing domain; T_SNARE_dom, target SNARE coiled-coil homology domain; ThiF_NAD_FAD-bd, THIF-type NAD/FAD binding fold; Znf_CCHC, zinc finger, CCHC type.
Fig. 3
Fig. 3. Aging cell atlas under physiological conditions.
a, Schematic of aging sample preparation under physiological conditions without interrupting worm reproduction and the survival curve of worm samples used for nuclei collection at four timepoints to build the aging cell atlas. b, Cell atlases from four age groups shown by UMAP, three replicates per age group with total nuclei numbers. c, The percentage of various somatic cell types in total captured cells does not change much between four ages, except for spermatheca and neurons. Not significant (NS) P > 0.05. P values by one-way ANOVA test with Benjamini–Hochberg correction. n = 3 biologically independent samples for each timepoint. Data are presented as mean ± s.d. d, Numbers of germ nuclei decreased from day 1 and day 6 to day 12 and day 14. NS P > 0.05. P values by one-way ANOVA test with Benjamini–Hochberg correction. n = 3 biologically independent samples for each timepoint. Data are presented as mean ± s.d. e, Box plots displaying maximum mean discrepancy between age groups across different tissues in WT worms. NS P > 0.05. P values by one-way ANOVA test with Benjamini–Hochberg correction. n = 300 independent iterations. The box plot’s box spans the interquartile range (IQR), with the bottom and top representing the 25th and 75th percentiles, respectively, and the median value at the middle. Whiskers extend to the smallest and largest values within 1.5 times the IQR from the quartiles. D, day.
Fig. 4
Fig. 4. Germline trajectory mapping age-related changes.
a, Trajectory pseudotime clusters germ nuclei into different cell identities. b, Germ cell trajectory PAGA map showing cell fate commitment from GSCs to mature oocytes. c, Density plots showing the numbers of germ nuclei distributed along the pseudotime at different ages. d, Strip chart showing the numbers of germ nuclei in different regions of the germline at different ages. P values by one-way ANOVA with Benjamini–Hochberg correction. n = 3 biologically independent samples for each timepoint. Data are presented as mean ± s.d. e, Heatmaps showing gene expression levels along the distal-proximal axis of the germline. Ribosomal, lysosomal and mitochondrial genes with distal-restricted expression on day 1 undergo age-related changes in different patterns.
Fig. 5
Fig. 5. Aging clocks reveal tissue-specific anti-aging effects of different pro-longevity strategies.
a, The schematic outlines the development of machine-learning-based tissue-specific transcriptomic aging clocks, which can predict the biological age of each tissue based on sn-RNAseq data from four timepoints (left). The performance of tissue-specific aging clocks validated with leave-one-batch-out cross-validation. Red dots represent median prediction for the test dataset, the blue line represents the fitted linear model through the prediction points, and the light gray area indicates the 95% confidence interval. The square of Pearson’s correlation coefficients is shown (right). b, UpSet plot showing the intersection sets of aging clock genes identified across tissues. Genes shared among six, five or four of the tissue-specific aging clocks are listed in red, blue or yellow boxes, respectively. ce, Lifespans of daf-2 loss-of-function mutant (daf-2(lf)) (c), rsks-1 loss-of-function mutant (rsks-1(lf)) (d) and lipl-4 transgenic strain (lipl-4 Tg) (e) compared to WT. f, Box plots showing the predicted biological ages of different tissues in 3 long-lived strains at the chronological ages of day 6 and day 12, as determined by tissue-specific aging clocks. Day 5 and day 11 indicated by red dashed lines present the cutoff for slowing down the clocks. One-sample t-test, one-sided, n = 100 BootstrapCells cells. P values are shown in the figure. For box plots, the center is the median; the lower and upper bounds correspond to the first and third quartiles, the whiskers extend up to 1.5 times the IQR and the minima and maxima are the observed minima and maxima. The box plot’s box spans the IQR, with the bottom and top representing the 25th and 75th percentiles, respectively, and the median value at the middle. Whiskers extend to the smallest and largest values within 1.5 times the IQR from the quartiles.
Fig. 6
Fig. 6. Effects of different pro-longevity strategies on tissue-specific age-related features.
a,b, Tissue-specific age-related GO terms for neurons (a) and intestine (b) exhibit distinct patterns of changes in the three long-lived strains. The enrichment scores for each GO term were normalized to the young group. c, Circos plots showing conserved co-expression modules (Fisher’s exact test, P < 0.01) that were significantly correlated with aging (Pearson’s correlation, P < 0.001 and R2 > 0.2) in neurons (left) and the intestine (right) between different genotypes. Blue ribbons connect conserved models that were both negatively correlated with aging in different genotypes, red ribbons connect conserved models that were both positively correlated with aging and green ribbons connect conserved models that were oppositely correlated with aging in different genotypes. d, Correlations between consensus co-expression modules and aging in the intestine. Gene modules demonstrating significant correlation with aging (Pearson’s correlation, P < 0.001 and R2 > 0.2) in at least one genotype are shown. Bar graphs enclosed in dashed boxes represent KEGG pathways that were significantly enriched (Fisher’s exact test, Benjamini–Hochberg-adjusted P < 0.01) for the turquoise module in the intestine.
Fig. 7
Fig. 7. APA site usage preference across tissues and ages.
a, Schematics of APA site preference toward the proximal or distal polyadenylation site (PAS). b, Heatmaps showing 55 newly identified genes with tissue-specific preference for APA sites. c, For each tissue, six examples of genes exhibiting age-related changes in APA site usage are shown. d, Percentage of genes showing an age-related shift toward the distal APA usage is decreased in different long-lived strains. e, Waffle plots showing how age-related APA changes in neurons are differently affected in the three long-lived strains. Total gene number = 67. f, APA site preference shifts of hlh-30 in neurons from day 1 to day 12 are suppressed in the rsks-1(lf) and daf-2(lf) but not the lipl-4 Tg long-lived strains. ****P < 0.0001, ***P < 0.001 and NS P > 0.05 by two-sided Wilcoxon rank-sum test with Dunn–Sidak correction. g, APA site preference shifts of daf-16 in the hypodermis from day 1 to day 12 are completely suppressed in the daf-2(lf) mutant and partially in the rsks-1(lf) mutant. NS P > 0.05; P value by two-sided Wilcoxon rank-sum test with Dunn–Sidak correction. For f and g, the box plot’s box spans the IQR, with the bottom and top representing the 25th and 75th percentiles, respectively, and the mean value at the middle in this case. Whiskers extend to the smallest and largest values within 1.5 times the IQR from the quartiles.
Extended Data Fig. 1
Extended Data Fig. 1. Details of snRNA-seq workflow and tissue sub-clustering.
a and b, Gene numbers and unique molecular identifiers (UMI) per cell are consistent between experiments. c, UMAP visualization of hypodermis sub-clustering showing seam cell, rectal epithelium, and vulva epithelium. d, UMAP visualization of muscle sub-clustering into body wall muscle, intestinal muscle, head muscle, and vulva muscle. e, UMAP visualization of intestine sub-clustering showing marker gene expression separation of the anterior (lys-7) and posterior (irg-7) region.
Extended Data Fig. 2
Extended Data Fig. 2. External validation of cell-type-specific molecular and functional features.
a, Heatmaps showing the expression level of transcription factors (right) with the corresponding enrichment score of their target genes (left) enriched explicitly in tissues shown, based on the scRNA-seq dataset from the Roux et al study. b and c, Heatmaps showing tissue-specific functional modalities based on Roux et al.’s scRNA-seq data, represented by the enrichment score based on KEGG (b) and InterPro (c) pathway terms. The InterPro term ‘F-box_dom’ is represented in gray, indicating no expression for all seven genes in this term in the Roux et al. data.
Extended Data Fig. 3
Extended Data Fig. 3. Age-related germ cell changes.
a, Percentage of germ nuclei per worm decreases from day 1 and day 6 to day 12 and day 14. n.s. P > 0.05. P value by one-way ANOVA test with Benjamini–Hochberg correction. n = 3 biologically independent samples for each time point. Data are presented as mean values +/− SD.
Extended Data Fig. 4
Extended Data Fig. 4. Germline trajectory mapping to identify age-related changes.
a, Velocity projection graph in UMAP embedding and Velocity pseudotime. b, UMAP graph highlighting predicted root and endpoints that correlated with germline stem cells and oocytes, respectively. c, Strip chart showing the percentage of germ nuclei in different regions of the germline at different ages. * P <0.05, one-way ANOVA test with Benjamini–Hochberg correction. n = 3 biologically independent samples for each time point. Data are presented as mean values +/− SD. d, Heatmaps showing that gene expression temporal patterns along the developmental progression of germ cells are disrupted with aging. e, Heatmaps showing gene expression levels along the distal-proximal axis of the germline. Genes related to DNA synthesis, chromatin assembly, protein folding and degradation, and mRNA processing show age-related decrease in the proximal end of the germline.
Extended Data Fig. 5
Extended Data Fig. 5. Functional enrichment and validation for tissue-specific age clocks.
a, KEGG pathway enrichment analysis for aging-clock genes of muscle and neuron. b, WormCat gene ontology enrichment for ageing-clock genes of major tissues. c, Tissue-specific transcriptomic aging clocks validation with sc-RNAeq data from Roux et al. Jitter plots showing the correlation between the chronological age of the published scRNAseq data from germ free worms and predicted age with the corresponding tissue-specific aging clocks trained on WT worms. Red dots represent median prediction for the test dataset, blue line represents the fitted linear model through the prediction points, with light gray area indicating the 95% confidence interval. The square of Pearson’s correlations coefficients is shown.
Extended Data Fig. 6
Extended Data Fig. 6. Age-related molecular regulations of tissue-specific aging by different pro-longevity mechanisms.
a and b, Heatmaps show that tissue-specific significant age-related Gene Ontology (GO) terms for hypodermis (a) and muscle (b) exhibit distinct patterns of changes in the three long-lived strains. The enrichment scores for each term were normalized to the young group. c, Circos plots showing conserved co-expression modules (Fisher’s exact test, P < 0.01) that are significantly correlated with aging (Pearson’s correlation, P < 0.001 and R2 > 0.2) in vulva and uterus, hypodermis, muscle, and pharynx between different genotypes. Blue ribbons connected conserved models that were both negatively correlated with aging in different genotypes, red ribbons connected conserved models that were both positively correlated with aging, and green ribbons connected conserved models that were oppositely correlated with aging in different genotypes. d, UMAP visualization of the consensus co-expression network for aging-related modules (Pearson’s correlation, P < 0.001 and R2 > 0.2) in muscle, neurons and hypodermis. Dots represented genes and are colored by the module they belonged to. Edges represent co-expression between genes (upper). Lower panel are heatmaps representing correlations between consensus co-expression modules and aging. Gene modules demonstrating significant correlation with aging (Pearson’s correlation, P < 0.001 and R2 > 0.2) in at least one genotype are shown. Bar graphs enclosed in dashed boxes represent KEGG pathways that are significantly enriched (Fisher’s exact test, Benjamini–Hochberg adjusted P < 0.01) for the blue module in the muscle, turquoise module in neurons, and turquoise module in the hypodermis.
Extended Data Fig. 7
Extended Data Fig. 7. Effects of different pro-longevity strategies on age-related APA changes.
a, The APA preference of ret-1 across four tissues. The boxplot’s box spans the interquartile range (IQR), with the bottom and top representing the 25th and 75th percentiles, respectively, and the mean value at the middle in this case. Whiskers extend to the smallest and largest values within 1.5 times the IQR from the quartiles. b, UMAPs showing APA site preference of ret-1 among all cell types at different ages. Age-related APA changes in the intestine cluster (circle) are highlighted with arrowheads (red for proximal; blue for distal). c, Waffle plots showing how age-related APA changes are affected by different pro-longevity mechanisms in different tissues.

Update of

References

    1. Apfeld J, Kenyon C. Cell nonautonomy of C. elegans daf-2 function in the regulation of diapause and life span. Cell. 1998;95:199–210. doi: 10.1016/S0092-8674(00)81751-1. - DOI - PubMed
    1. Blüher M, Kahn BB, Kahn CR. Extended longevity in mice lacking the insulin receptor in adipose tissue. Science. 2003;299:572–574. doi: 10.1126/science.1078223. - DOI - PubMed
    1. Papadopoli D, et al. mTOR as a central regulator of lifespan and aging. F1000Res. 2019;8:F1000 Faculty Rev-998. doi: 10.12688/f1000research.17196.1. - DOI - PMC - PubMed
    1. Murphy CT, et al. Genes that act downstream of DAF-16 to influence the lifespan of Caenorhabditis elegans. Nature. 2003;424:277–283. doi: 10.1038/nature01789. - DOI - PubMed
    1. Zhang Y-P, et al. Intestine-specific removal of DAF-2 nearly doubles lifespan in Caenorhabditis elegans with little fitness cost. Nat. Commun. 2022;13:6339. doi: 10.1038/s41467-022-33850-4. - DOI - PMC - PubMed