. 2024 Jun;30(6):1564-1573.
doi: 10.1038/s41591-024-02987-8. Epub 2024 May 30.

Three-year outcomes of post-acute sequelae of COVID-19

Affiliations

Three-year outcomes of post-acute sequelae of COVID-19

Miao Cai et al. Nat Med. 2024 Jun.

Abstract

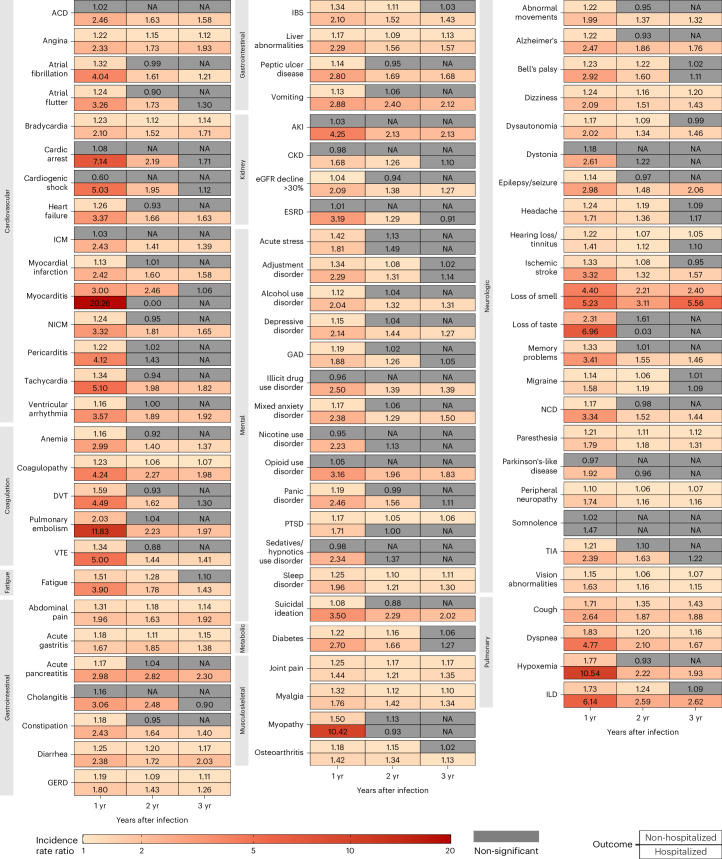
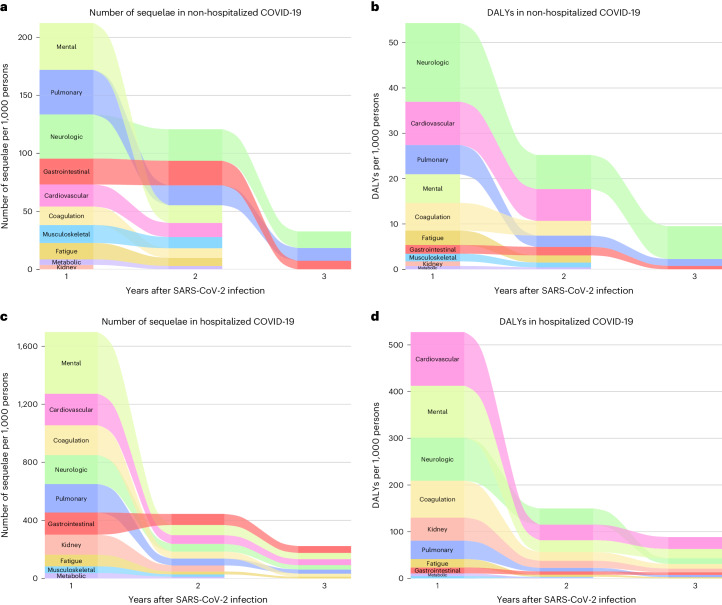
Severe acute respiratory syndrome coronavirus 2 (SARS-CoV-2) infection causes post-acute sequelae of coronavirus disease 2019 (COVID-19) (PASC) in many organ systems. Risks of these sequelae have been characterized up to 2 years after infection, but longer-term follow-up is limited. Here we built a cohort of 135,161 people with SARS-CoV-2 infection and 5,206,835 controls from the US Department of Veterans Affairs who were followed for 3 years to estimate risks of death and PASC. Among non-hospitalized individuals, the increased risk of death was no longer present after the first year of infection, and risk of incident PASC declined over the 3 years but still contributed 9.6 (95% confidence interval (CI): 0.4-18.7) disability-adjusted life years (DALYs) per 1,000 persons in the third year. Among hospitalized individuals, risk of death declined but remained significantly elevated in the third year after infection (incidence rate ratio: 1.29 (95% CI: 1.19-1.40)). Risk of incident PASC declined over the 3 years, but substantial residual risk remained in the third year, leading to 90.0 (95% CI: 55.2-124.8) DALYs per 1,000 persons. Altogether, our findings show reduction of risks over time, but the burden of mortality and health loss remains in the third year among hospitalized individuals.


Conflict of interest statement

Z.A.-A. reports receiving consultation fees from Gilead Sciences. Y.X. reports consulting for Guidepoint. Z.A.-A. and Y.X. report consulting (uncompensated) for Pfizer. The other authors declare no competing interests.

Figures

Fig. 1
Fig. 1. Cumulative excess death rate and incidence rate ratio of PASC in COVID-19 groups by care setting of the acute phase.
a, The solid lines at the center of shaded bands were adjusted cumulative excess death rate per 1,000 persons in non-hospitalized COVID-19 (n = 114,864) and hospitalized COVID-19 (n = 20,297) groups compared to the control group without infection (n = 5,206,835), and the shaded bands present the 95% CIs for cumulative excess rates. The number at risk, weighted IRR and weighted excess rate per 1,000 persons in the COVID-19 groups by care setting of the acute phase compared to the control group without infection are also presented in the lower panel. b, IRR of overall PASC and by organ system in non-hospitalized COVID-19 group (n = 114,864) compared to the control group without infection (n = 5,206,835). The dots at the center of error bars in both panels represent the adjusted IRRs estimated using the number of post-acute sequelae, and the error bars correspond to the 95% CIs. c, IRR of overall PASC and by organ system in hospitalized COVID-19 group (n = 20,297) compared to the control group without infection (n = 5,206,835). Outcomes are ordered from top to bottom by largest cumulative number of post-acute sequelae at 3 years after infection in the non-hospitalized COVID-19 group. The dots at the center of error bars in both panels represent the adjusted IRRs estimated using the number of post-acute sequelae, and the error bars correspond to the 95% CIs.
Fig. 2
Fig. 2. IRR of PASC up to 3 years after SARS-CoV-2 infection by care setting of the acute phase.
Heatmaps include non-hospitalized COVID-19 (n = 114,864; top rows) and hospitalized COVID-19 (n = 20,297; bottom rows) groups. IRRs were estimated in comparison to a control group without infection (n = 5,206,835). ACD, acute coronary disease; AKI, acute kidney injury; CKD, chronic kidney disease; DVT, deep vein thrombosis; ESRD, end-stage renal disease; GAD, general anxiety disorder; GERD, gastroesophageal reflux disease; IBS, irritable bowel syndrome; ICM, ischemic cardiomyopathy; ILD, interstitial lung disease; NA, not applicable; NCD, neurocognitive decline; NICM, non-ischemic cardiomyopathy; PTSD, post-traumatic stress disorder; TIA, transient ischemic attack; VTE, venous thromboembolism. If potential risk horizon (non-significant (NS) cell with a numeric IRR estimate) for an outcome was reached in a previous period, the IRRs for that outcome in all subsequent periods will not be estimated and are indicated by gray cells with NAs (not applicable) inside. yr, year.
Fig. 3
Fig. 3. Number of sequelae due to SARS-CoV-2 infection for overall PASC and by organ system and relative percentage for overall PASC in the first, second and third year after SARS-CoV-2 infection by care setting of the acute phase compared to the control group without infection.
a, Number of post-acute sequelae overall and by organ system per 1,000 persons in the first, second and third year after SARS-CoV-2 infection by care setting of acute phase. b, Relative percentage of number of post-acute sequelae overall in the first, second and third year after SARS-CoV-2 infection by care setting of acute phase. Number of post-acute sequelae for COVID-19 not significantly different from the control group without infection in a year is marked by gray bars. The left column represents numbers of post-acute sequelae for the non-hospitalized COVID-19 group (n = 114,864), and the right column represents the numbers for the hospitalized COVID-19 group (n = 20,297), compared to the control group without infection (n = 5,206,835). Outcomes are ordered from top to bottom by cumulative number of post-acute sequelae at 3 years after infection.
Fig. 4
Fig. 4. DALYs due to SARS-CoV-2 infection for overall PASC and by organ system and relative percentage for overall PASC in the first, second and third year after SARS-CoV-2 infection by care setting of the acute phase compared to the control group without infection.
a, DALYs of overall PASC and by organ system per 1,000 persons in the first, second and third year after SARS-CoV-2 infection by care setting of acute phase. b, Relative percentage of DALYs of overall PASC in the first, second and third year after SARS-CoV-2 infection by care setting of acute phase. DALYs for COVID-19 not significantly different from the control group without infection in a year are marked by gray bars. The left panels of a and b represent the DALYs of post-acute sequelae for the non-hospitalized COVID-19 group (n = 114,864), and the right panels of a and b represent the number for the hospitalized COVID-19 group (n = 20,297), compared to the control group without infection (n = 5,206,835). Outcomes are ordered from top to bottom by cumulative DALYs of post-acute sequelae at 3 years after infection.
Fig. 5
Fig. 5. Sanky plot of changes of number of sequelae or DALYs of PASC by organ system in the first, second and third year after SARS-CoV-2 infection by care setting of the acute phase compared to the control group without infection.
a, Changes of number of post-acute sequelae by organ system in 3 years after SARS-CoV-2 infection in the non-hospitalized COVID-19 group (n = 114,864). b, Changes of DALYs of post-acute sequelae by organ system in 3 years after SARS-CoV-2 infection in the non-hospitalized COVID-19 group (n = 114,864). c, Changes of number of post-acute sequelae by organ system in 3 years after SARS-CoV-2 infection in the hospitalized COVID-19 group (n = 20,297). d, Changes of DALYs of post-acute sequelae by organ system in 3 years after SARS-CoV-2 infection in the hospitalized COVID-19 group (n = 20,297). The height of each box represents the number of sequelae or DALYs in COVID-19 groups that are significantly different from the control group without infection in each year after SARS-CoV-2 infection. Outcomes are ordered from top to bottom by number/DALYs of post-acute sequelae per 1,000 persons in each year after SARS-CoV-2 infection in the COVID-19 group.
Fig. 6
Fig. 6. Comparison of overall PASC and at organ system level between hospitalized and non-hospitalized COVID-19 groups over 3 years of follow-up.
a, IRRs (95% CIs) of number of sequelae for hospitalized (n = 114,864) and non-hospitalized (n = 20,297) COVID-19 groups by year. IRRs were estimated in comparison to a control group without infection (n = 5,206,835). The dots at the center of error bars represent the adjusted IRRs estimated using the number of post-acute sequelae, and the error bars correspond to the 95% CIs. b, Number of sequelae per 1,000 persons due to SARS-CoV-2 infection in hospitalized and non-hospitalized COVID-19 groups by year. c, DALYs per 1,000 persons due to SARS-CoV-2 infection in hospitalized and non-hospitalized COVID-19 groups by year. d, Cumulative number of sequelae per 1,000 persons due to SARS-CoV-2 infection for hospitalized and non-hospitalized COVID-19 groups at 3 years. e, Cumulative DALYs per 1,000 persons due to SARS-CoV-2 infection for hospitalized and non-hospitalized COVID-19 groups at 3 years. a is ordered by the IRRs among the hospitalized COVID-19 groups in each year. The red and blue dots show the IRRs in hospitalized and non-hospitalized COVID-19 groups significantly larger than 1, and the error bars are the associated CIs. In b, c, d and e, the red dots represent the absolute rates in hospitalized COVID-19 groups significantly higher than those in the control group without infection; the blue dots represent the absolute rates in non-hospitalized COVID-19 groups significantly higher than the control group without infection; and the gray dots represent the absolute rates in hospitalized or non-hospitalized COVID-19 groups that were not significantly higher than those in the control group without infection. The thicker horizontal bars represent the excess rates in the hospitalized COVID-19 group compared to the non-hospitalized COVID-19 group, where the red bars indicate significantly different rates and gray bars indicate no statistical difference. The thinner horizontal bars closer to the y axis represent the absolute rate in the non-hospitalized COVID-19 group compared to the control group without infection. The organ systems in b, c, d and e were sorted based on the statistical significance and magnitude of differences between hospitalized and non-hospitalized COVID-19 groups (the horizontal red/gray bars between two dots).
Extended Data Fig. 1
Extended Data Fig. 1. Standardized mean differences between non-hospitalized, hospitalized, and control groups before and after weighting in analyses of post-acute sequelae (PASC) and sequelae by organ system.
Plots show the standardized mean differences before weighting (left) and after weighting (right). Each row represents a sub-cohort used in analyzing the risks of PASC by organ system that was free of history of the respective outcomes at baseline. All selected variates had a standardized mean difference < 0.1 after weighting.
Extended Data Fig. 2
Extended Data Fig. 2. Summary of risk of post-acute sequelae of COVID-19 (PASC) by years of follow-up and care setting of the acute phase.
The figure presents the summaries of PASC by organ system for non-hospitalized COVID-19, hospitalized COVID-19 in each year of follow-up after SARS-CoV-2 infection. The number in the leftmost column with white background denotes the total number of sequelae examined in each organ system. Within each cell, the top left percent represent the percentage of number of sequelae at increased risk in non-hospitalized/hospitalized COVID-19 compared to the control, while the bottom right number is the number of sequelae in the organ system in that year.
Extended Data Fig. 3
Extended Data Fig. 3. Cumulative number of post-acute sequelae (PASC) overall and by organ system and by care setting of the acute phase.
The solid lines at the centre of shaded bands were adjusted cumulative excess number of PASC per 1000 persons in non-hospitalized (n = 114,864) and hospitalized COVID-19 (n = 20,297) groups compared to the control group without infection (n = 5,206,835), and the shaded bands present the 95% confidence intervals for cumulative rates.
Extended Data Fig. 4
Extended Data Fig. 4. Cumulative disability-adjusted life years (DALYs) of post-acute sequelae (PASC) overall and by organ system and by care setting of the acute phase.
The solid lines at the centre of shaded bands were adjusted cumulative excess DALYs of PASC per 1000 persons in non-hospitalized (n = 114,864) and hospitalized COVID-19 (n = 20,297) groups compared to the control group without infection (n = 5,206,835), and the shaded bands present the 95% confidence intervals for cumulative rates.
Extended Data Fig. 5
Cohort flowchart.
Extended Data Fig. 6
Analytic flowchart.

Similar articles

Cited by

References

    1. Al-Aly Z, Xie Y, Bowe B. High-dimensional characterization of post-acute sequelae of COVID-19. Nature. 2021;594:259–264. doi: 10.1038/s41586-021-03553-9. - DOI - PubMed
    1. Al-Aly Z, Topol E. Solving the puzzle of Long Covid. Science. 2024;383:830–832. doi: 10.1126/science.adl0867. - DOI - PubMed
    1. Davis HE, McCorkell L, Vogel JM, Topol EJ. Long COVID: major findings, mechanisms and recommendations. Nat. Rev. Microbiol. 2023;21:133–146. doi: 10.1038/s41579-022-00846-2. - DOI - PMC - PubMed
    1. Xie Y, Xu E, Bowe B, Al-Aly Z. Long-term cardiovascular outcomes of COVID-19. Nat. Med. 2022;28:583–590. doi: 10.1038/s41591-022-01689-3. - DOI - PMC - PubMed
    1. Xie Y, Xu E, Al-Aly Z. Risks of mental health outcomes in people with covid-19: cohort study. BMJ. 2022;376:e068993. doi: 10.1136/bmj-2021-068993. - DOI - PMC - PubMed