. 2024 Jun;25(6):1083-1096.
doi: 10.1038/s41590-024-01844-7. Epub 2024 May 30.

Affinity gaps among B cells in germinal centers drive the selection of MPER precursors

Affiliations

Affinity gaps among B cells in germinal centers drive the selection of MPER precursors

Rashmi Ray et al. Nat Immunol. 2024 Jun.

Abstract

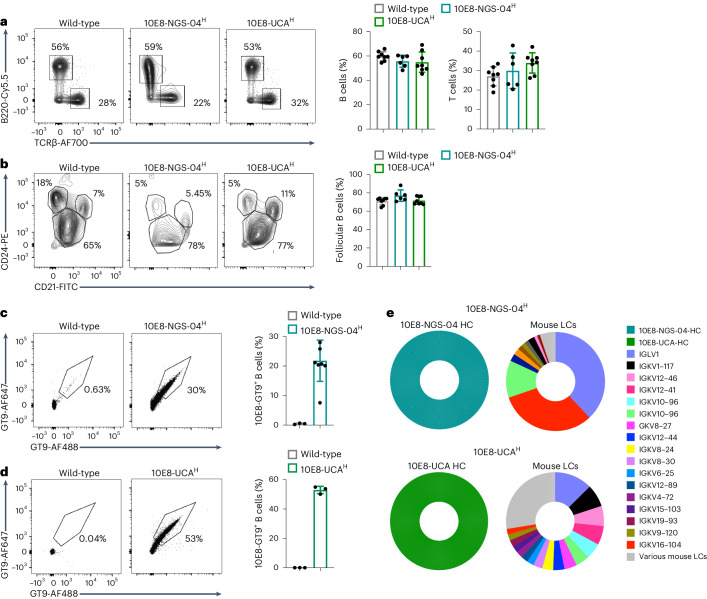
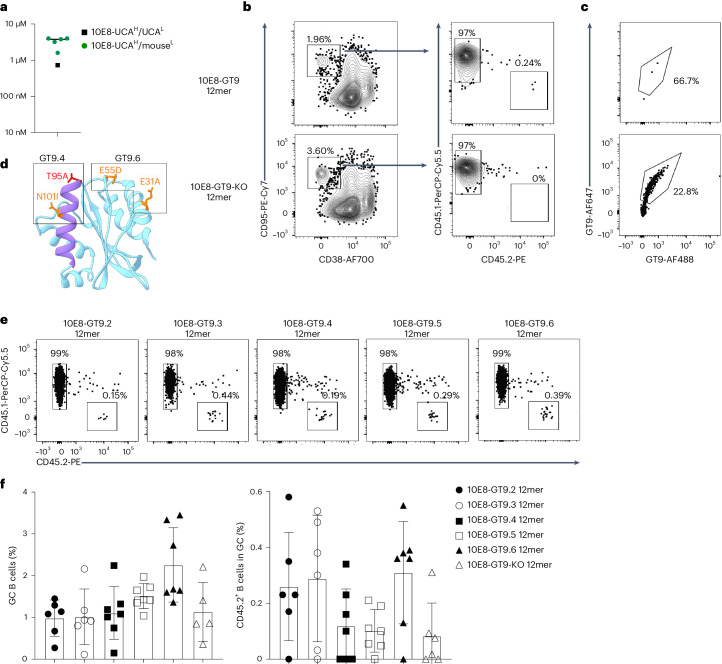
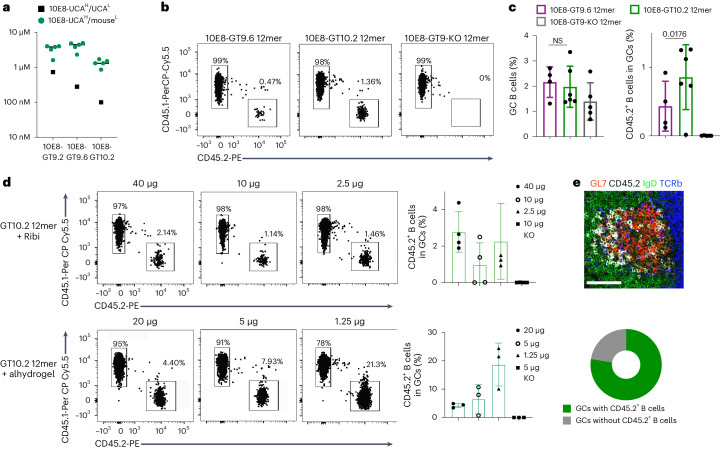
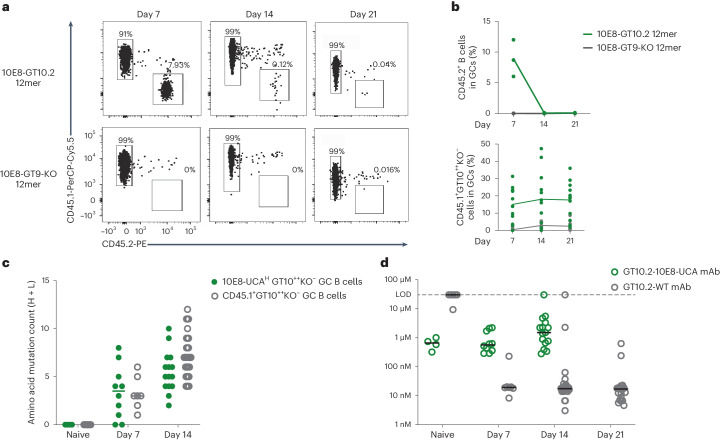
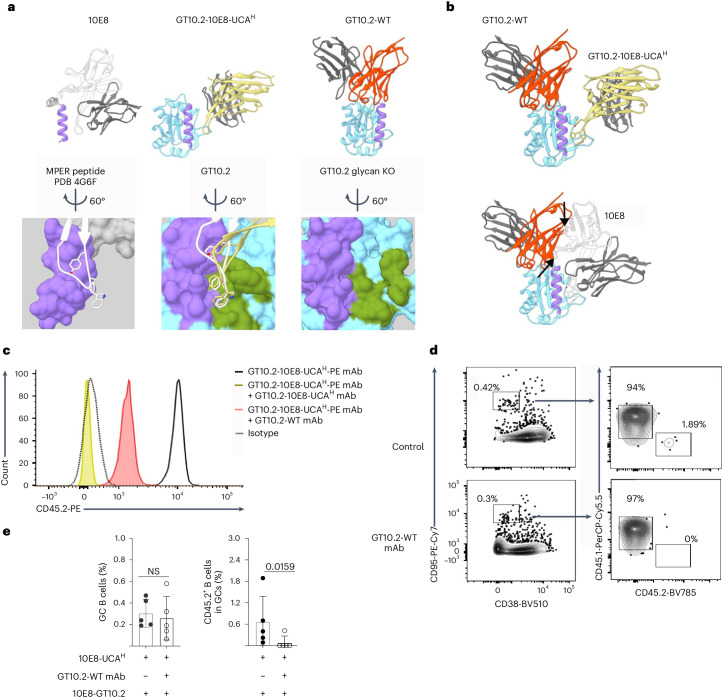
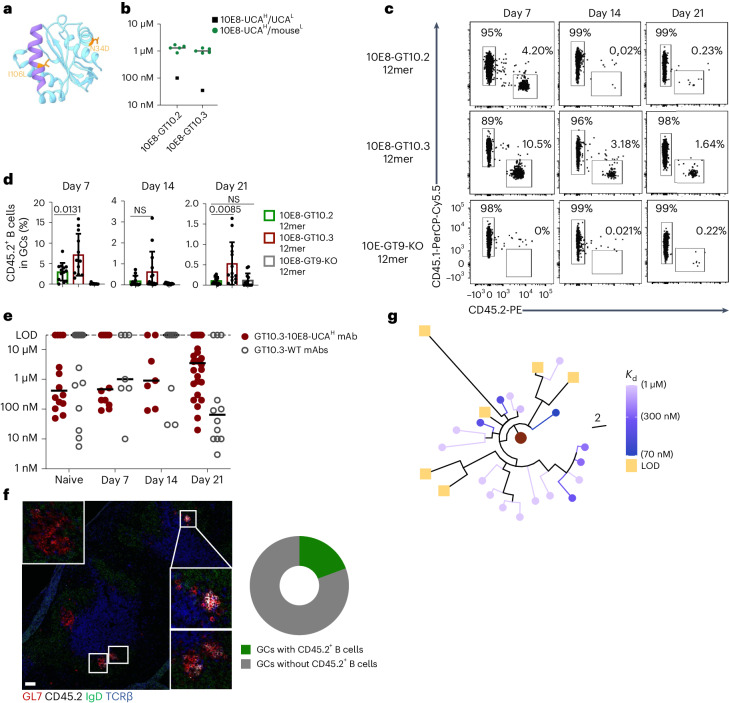
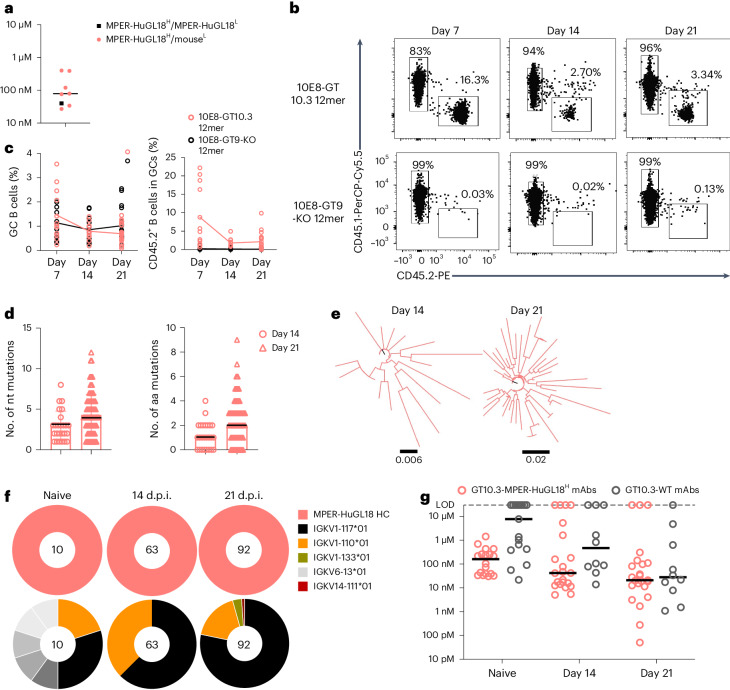
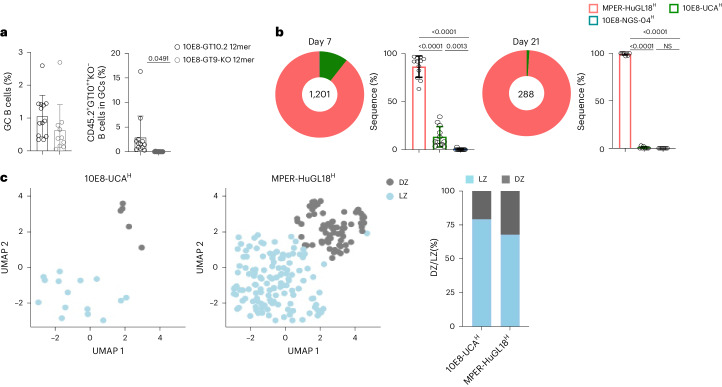
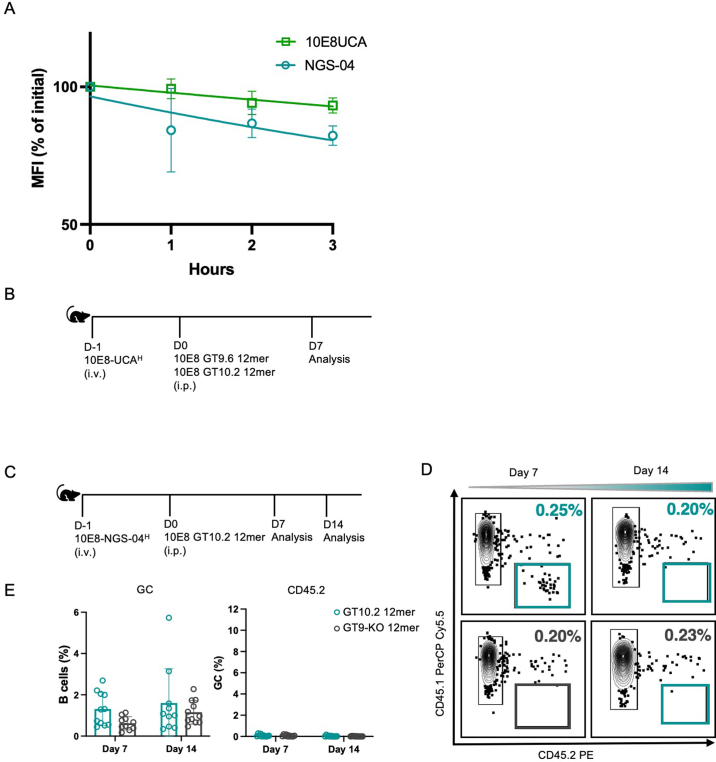
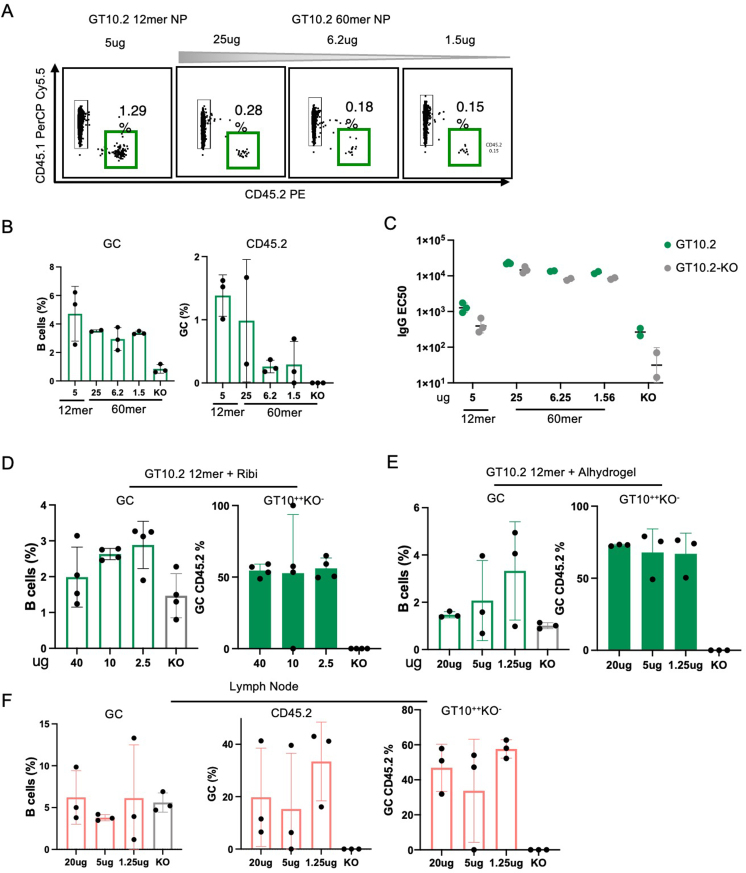
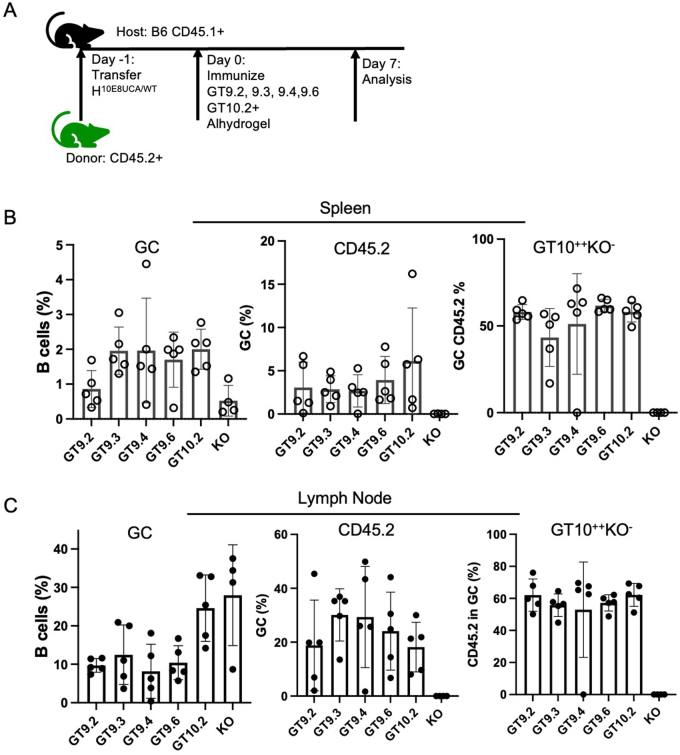
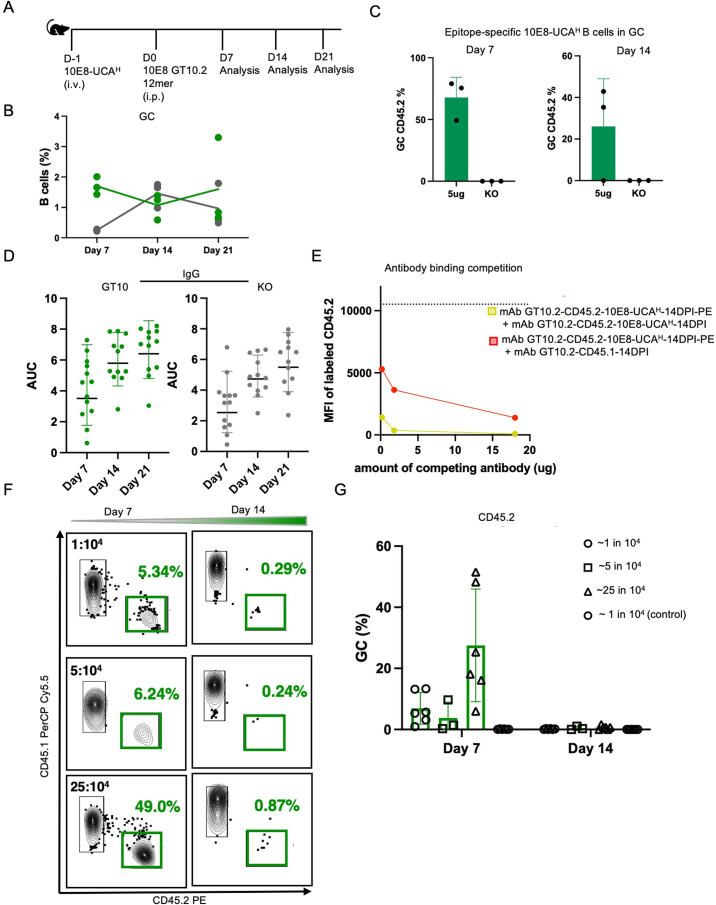
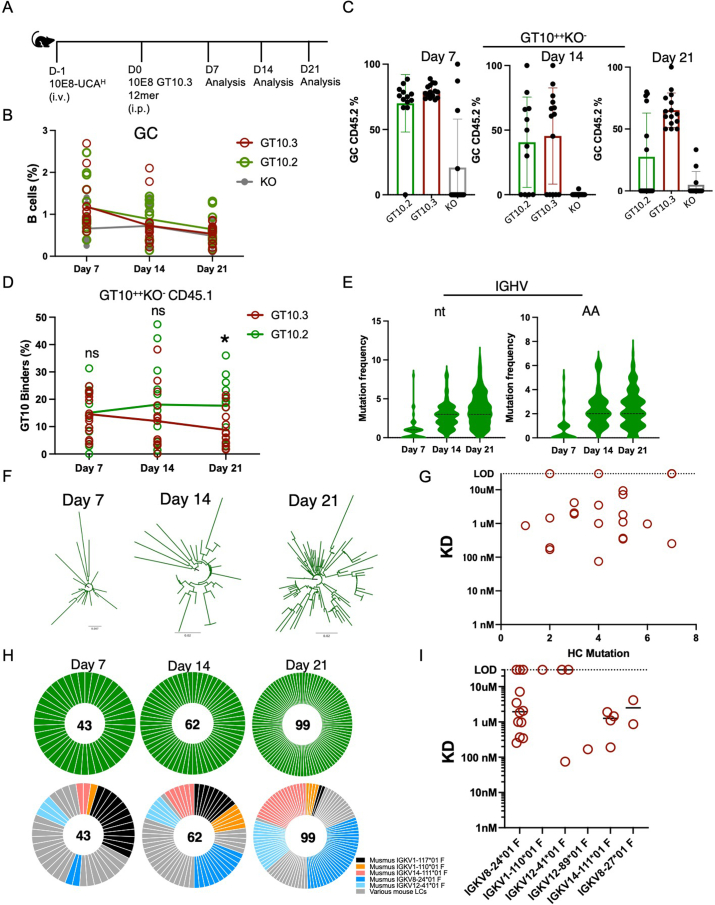
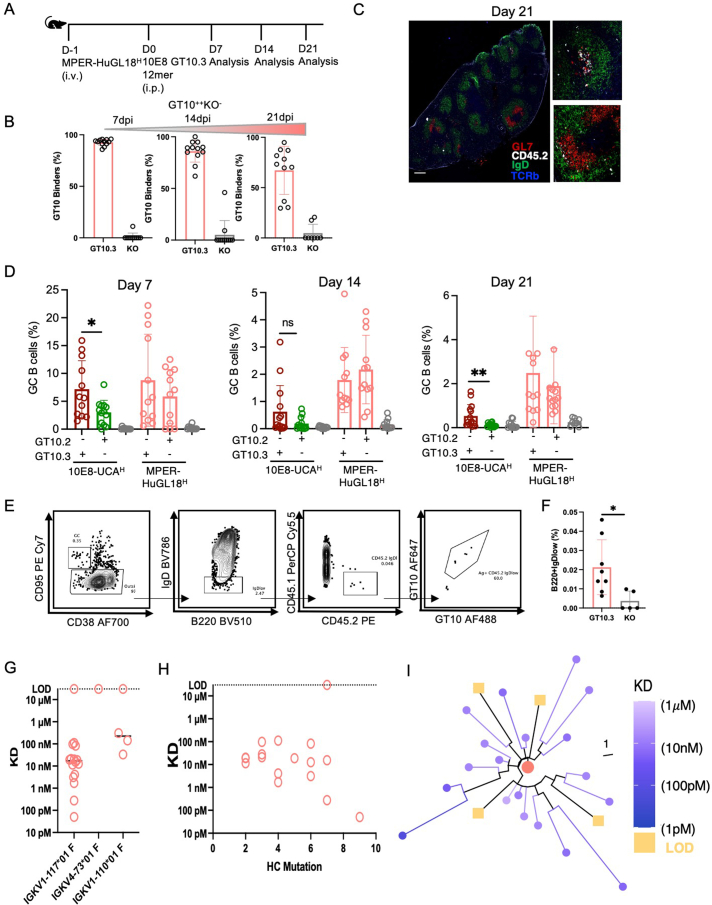
Current prophylactic human immunodeficiency virus 1 (HIV-1) vaccine research aims to elicit broadly neutralizing antibodies (bnAbs). Membrane-proximal external region (MPER)-targeting bnAbs, such as 10E8, provide exceptionally broad neutralization, but some are autoreactive. Here, we generated humanized B cell antigen receptor knock-in mouse models to test whether a series of germline-targeting immunogens could drive MPER-specific precursors toward bnAbs. We found that recruitment of 10E8 precursors to germinal centers (GCs) required a minimum affinity for germline-targeting immunogens, but the GC residency of MPER precursors was brief due to displacement by higher-affinity endogenous B cell competitors. Higher-affinity germline-targeting immunogens extended the GC residency of MPER precursors, but robust long-term GC residency and maturation were only observed for MPER-HuGL18, an MPER precursor clonotype able to close the affinity gap with endogenous B cell competitors in the GC. Thus, germline-targeting immunogens could induce MPER-targeting antibodies, and B cell residency in the GC may be regulated by a precursor-competitor affinity gap.


Conflict of interest statement

T.S., O.S. and W.R.S. are named inventors on patent applications filed by Scripps and IAVI regarding 10E8-GT immunogens and nanoparticles in this manuscript. F.D.B. has consultancy relationships with Adimab, Third Rock Ventures and The EMBO Journal. W.R.S. is an employee of Moderna, Inc. All other authors declare no competing interests.

Figures

Fig. 1
Fig. 1. 10E8 knock-in mice express heavy chains from human 10E8 precursor B cells.
a, Representative flow cytometry plots (left) and quantification (right) of spleen cells from 8- to 10‐week‐old wild-type, 10E8-NGS-04H and 10E8-UCAH mice and gating strategy for the quantification of splenic B220+TCRβ B cells and TCRβ+B220 T cells. Data are pooled from two independent experiments (n = 3–4 mice per independent group). b, Representative flow cytometry plots (left) and quantification (right) of spleen cells from 8- to 10‐week‐old wild-type, 10E8-NGS-04H and 10E8-UCAH mice and gating strategy for the quantification of CD21hiCD24lo follicular B cells, transitional CD21loCD24hi T0/T1 B cells, CD21hiCD24hiCD23+ T2 B cells and CD21hiCD24hiCD23 marginal zone B cells. Data are pooled from two independent experiments (n = 3–4 mice per independent group). Error bars indicate mean ± s.d. from mice in pooled groups. c, Representative flow cytometry (left) and quantification (right) of B220+CD4CD8F4/80Gr-1 naive B cells from peripheral blood binding biotinylated 10E8-GT9 in wild-type or 10E8-NGS-04H mice. Data are pooled from two independent experiments. Error bars indicate mean ± s.d. from mice in each group (n = 3–6). d, Representative flow cytometry (left) and quantification (right) of naive B cells binding to biotinylated 10E8-GT9 in wild-type or 10E8-UCAH mice. Error bars indicate mean ± s.d. from mice in each group (n = 3). Data from a single experiment are presented and are representative of three independent experiments. e, Top, 10x Genomics scBCR-seq data from 10E8-GT10.2-specific naive B cells from 10E8-NGS-04H mice (n = 1,026 pairs amplified) showing human 10E8-NGS-04 IGH-V gene frequency (left) and mouse IGK-V genes (right). Cells from three mice were sequenced, and representative data from one mouse are presented. Bottom, 10x Genomics scBCR-seq data from 10E8-GT10.2-specific naive B cells from 10E8-UCAH mice (n = 1,418 pairs amplified) showing the frequency of the human 10E8-UCA IGH-V gene (left) and mouse IGK-V genes (right). Cells from three mice were sequenced, and representative data from one mouse are presented; HC, heavy chain; LC, light chain.
Fig. 2
Fig. 2. 10E8-UCAH B cells are primed and recruited to GCs.
a, Affinities of human 10E8-UCAH/UCAL or 10E8-UCAH/mouseL Fabs to 10E8-GT9.2 12mer in a nanoparticle SPR assay. Symbols represent individual antibodies, and the line denotes the median 10E8-UCAH/mouseL value. b, Representative flow cytometry plots of CD95hiCD38loB220+ GC B cells and their distribution into CD45.2+ and CD45.1+ B cells at day 7 p.i. in CD45.1 wild-type mice transferred with 50,000 CD45.2+ 10E8-UCAH B cells (to reach a frequency of 4:105 CD45.2+ 10E8-UCAH B cells) 1 day before immunization with 50 µg of 10E8-GT9 12mer or 10E8-GT9-KO and Ribi adjuvant. c, Representative flow cytometry plots showing the percentage of CD45.2+10E8-GT9++ (top) CD45.1+10E8-GT9++ (bottom) GC B cells at day 7 p.i. with 50 µg of 10E8-GT9.2 12mer in recipients as in b. d, Ribbon diagrams showing the modifications in immunogens 10E8-GT9.4 and 10E8-GT9.6 derived through the reduction of off-target effects (10E8-GT9.4) plus the addition of the PADRE T cell help epitope (10E8-GT9.6). Mutation T95A (red) was removed, as candidates containing this mutation failed to express as 12mers. e,f, Representative flow cytometry plots of CD45.2+ GC B cells and CD45.1+ GC B cells (e) and quantification of GC B cells and CD45.2+ GC B cells (f) at day 7 p.i. in CD45.1 wild-type mice transferred with CD45.2+ 10E8-UCAH B cells (frequency of 6:105 CD45.2+ 10E8-UCAH B cells) and immunized 1 day later with 50 µg of 10E8-GT9.2 12mer, 10E8-GT9.3 12mer, 10E8-GT9.4 12mer, 10E8-GT9.5 12mer, 10E8-GT9.6 12mer or 10E8-GT9-KO 12mer with Ribi adjuvant. Error bars indicate mean ± s.d. from mice in each group (n = 6). Data from one representative experiment are presented, and two independent experiments were performed.
Fig. 3
Fig. 3. Antigen formulation significantly enhances epitope-specific 10E8 B cells in GCs.
a, Affinities of 10E8-UCAH/mouseL Fabs or human 10E8-UCAH/UCAL for 10E8-GT9.2, 10E8-GT9.6 and 10E8-GT10.2 12mers in nanoparticle SPR assays. Symbols represent individual antibodies, and lines represent 10E8-UCAH/mouseL median values. b,c, Representative flow cytometry plots of CD45.2+ and CD45.1+ GC B cells (b) and percentage of GC B cells and CD45.2+ GC B cells (c) at day 7 p.i. in the spleens of CD45.1 wild-type mice transferred with CD45.2 10E8-UCAH B cells (frequency of 1:104 CD45.2+ 10E8-UCAH B cells) and immunized 1 day later with 50 µg of 10E8-GT9.6 12mer, 10E8-GT10.2 12mer and 10E8-GT9-KO 12mer with Ribi adjuvant. Error bars indicate mean ± s.d. from mice in each group (n = 4–6). Significance was calculated with a two-tailed, paired t-test. Data shown are from one of two independent experiments; NS, not significant. d, Representative flow cytometry plots (left) and quantifications (right) of 10E8-UCAH CD45.2+ B cells in GC B cells at day 7 p.i. in the spleens of CD45.1 wild-type mice transferred with CD45.2 10E8-UCAH B cells (frequency of 1:104 CD45.2+10E8-UCAH B cells) immunized with 10E8-GT10.2 12mer (40 µg, 10 µg and 2.5 µg) or 10 µg of 10E8-GT9-KO 12mer with Ribi adjuvant (n = 4; top) or with 10E8-GT10.2 12mer (20 µg, 5 µg and 1.25 µg) or 5 µg of 10E8-GT9-KO 12mer with alhydrogel adjuvant (bottom). Error bars indicate mean ± s.d. from mice in each group (n = 3). Alhydrogel data are representative of three independent experiments, and Ribi data are representative of two independent experiments, with one quantified. e, Representative immunohistochemistry image of the spleen (top) and percentage (bottom) of 10E8-UCAH CD45.2+ B cells in GCs in recipients at day 7 p.i., as in d. Scale bar, 50 µm. The image is representative of images obtained from four mice.
Fig. 4
Fig. 4. 10E8 B cells do not persist in GCs.
a, Flow cytometry plots of CD45.2+ GC B and CD45.1+ GC B cells at days 7, 14 and 21 p.i. in the spleens of wild-type CD45.1 mice adoptively transferred (intravenously) with 200,000 CD45.2 10E8-UCAH B cells to establish a frequency of 1:104 10E8-UCAH B precursors and immunized 1 day later with 5 µg of 10E8-GT10.2 12mer (n = 3 mice) or 5 µg of 10E8-GT9-KO 12mer (n = 3) with alhydrogel. Representative data from one of three independent experiments are shown. b, Percentage of CD45.2+ GC B cells in splenic GCs (top) and percentage of CD45.1+GT10++KO GC B cells in splenic GCs (bottom) at days 7, 14 and 21 p.i. as in a (n = 3). Each circle represents one mouse. Top, representative data from one of three independent experiments; lines mark the means. Bottom, data are from pooled groups from three independent experiments; lines mark the respective means. c, Amino acid SHM of 10E8-UCAH CD45.2+GT10++KO B cells isolated from spleen GCs at days 7 and 14 p.i. with 10E8-GT10.2 12mer, endogenous CD45.1+GT10++KO B cells isolated from spleen GCs at day 14 p.i. with 10E8-GT10.2 60mer and pretransfer (day −1, naive) 10E8-UCAH GT10++KO and wild-type GT10++KO B cells as a control. Circles represent individual sequences, and lines indicate median values. d, Affinities of monomeric mAbs expressed from 10E8-UCAH CD45.2+GT10++KO B cells (GT10.2-10E8-UCAH), endogenous CD45.1+GT10++KO B cells (GT10.2-WT) and pretransfer (day −1) 10E8-UCAH GT10++KO B cells and wild-type GT10++KO B cells (naive), as in c, determined by monomer SPR assay. Circles represent individual antibodies, and lines represent median values; LOD, limit of detection.
Fig. 5
Fig. 5. Antibodies produced p.i. by 10E8-UCAH B cells face competition from wild-type antibodies.
a, Orientation of mature 10E8 Fab in relation to the MPER peptide in the published Protein Data Bank (PDB) 4G6F crystal structure (heavy chain, white; light chain, dark gray; MPER peptide, purple; top left) and surface rendering and positioning of the critical YxFW residues of HCDR3 (bottom left), representative GT10.2-10E8-UCAH mAb in complex with a glycan-knockout (KO) version of 10E8-GT10.2 (heavy chain, yellow; light chain, dark gray; targeted MPER graft with GT mutations, purple; top center; structure aligned and oriented to the MPER peptide as in the top left) and designed binding pocket (green) and engagement of the GT10.2-10E8-UCAH mAb HCDR3 (yellow) compared to mature 10E8 HCDR3 (white; bottom center) and representative GT10.2-WT mAb in complex with 10E8-GT10.2 (heavy chain, red; light chain, dark gray; targeted MPER graft with GT mutations, purple; top right) and binding pocket (green; bottom right). b, Overlay of the GT10.2-10E8-UCAH and GT10.2-WT mAbs described in a, showing the representative competitor response in relation to on-target response (top) and overlay of the GT10.2-WT mAb with mature 10E8 mAb from a (bottom). Arrows indicate clashes of the antibodies. c, Representative flow cytometry histograms showing the mean fluorescence intensity of fluorescently labeled GT10.2-10E8-UCAH-PE mAb to 10E8-GT10.2-coated streptavidin beads in the presence of GT10.2-10E8-UCAH mAb or GT10.2-WT mAb or in the absence of other mAbs. Data are derived from one of two experiments. d,e, Representative flow cytometry plots (d) and quantifications (e) of GC B cells and CD45.2+ B cells in GC B cells in the spleen at day 7 p.i. in CD45.1 wild-type mice adoptively transferred with CD45.2 10E8-UCAH B cells to reach a frequency of 1:104 CD45.2 10E8-UCAH B cells 1 day before i.p. injection with or without 10 µg of GT10.2-WT mAb, followed by immunization with 5 µg of 10E8-GT10.2 12mer with alhydrogel 12 h later. Error bars indicate mean ± s.d. from mice in each group (n = 5). Data were analyzed with a two-tailed Mann–Whitney test and are derived from one experiment.
Fig. 6
Fig. 6. 10E8-GT10.3 improves sustenance of 10E8-UCAH B cells in GCs.
a, Location of mutations introduced in 10E8-GT10.2 to generate 10E8-GT10.3 (MPER, purple; scaffold backbone, cyan; mutations, orange). b, Affinities of human 10E8-UCAH/UCAL Fab and Fabs of 10E8-UCAH/mouseL antibodies (sorted based on B220+IgM+ expression on B cells) to 10E8-GT10.2 12mer and 10E8-GT10.3 12mer in nanoparticle SPR assays. Symbols represent individual antibodies, and lines represent 10E8-UCAH/mouseL medians. c,d, Representative flow cytometry plots of CD45.2+ and CD45.1+ B cells (c) and percentages of CD45.2+ B cells (d) in spleen GCs at days 7, 14 and 21 p.i. in CD45.1 wild-type mice transferred with CD45.2 10E8-UCAH B cells to reach 1:104 10E8-UCAH B cells and immunized 1 day later with 5 µg of 10E8-GT10.2 12mer, 10E8-GT10.3 12mer or 10E8-GT9-KO 12mer with alhydrogel. Data in d are pooled from two independent experiments (n = 5–8). Error bars indicate mean ± s.d. from mice in pooled groups. Significance was calculated with a Student’s t-test (unpaired, two tailed). e, Affinities of mAbs expressed from epitope-specific 10E8-UCAH CD45.2+GT10++KO GC B cells (GT10.3-10E8-UCAH mAbs) and endogenous CD45.1+GT10++KO GC B cells (GT10.3-WT mAbs) at days 7, 14 and 21 p.i. with 10E8-GT10.3 12mer as in c and the affinity for corresponding iGL sequences (naive), as measured by monomer SPR assay. Circles represent individual antibodies, and lines indicate median values. f, Representative immunohistochemistry image of a spleen section at day 21 p.i. from a mouse immunized with 10E8-GT10.3 12mer and alhydrogel, as in c (left), and percentage of total GCs containing CD45.2+ B cells (right). White boxes show GCs with CD45.2+ B cells. Scale bar, 200 μm (left). g, Phylogenetic tree of IGHV sequences from 10E8-UCAH B cells, colorized on the basis of affinities at day 21 p.i., as in e.
Fig. 7
Fig. 7. MPER-HuGL18H mice show a sustained GC response to 10E8-GT10.3 12mer.
a, Affinities of human MPER-HuGL18H/MPER-HuGL18L Fabs and MPER-HuGL18H/mouseL Fabs to 10E8-GT10.3 12mer in the nanoparticle SPR assay. Symbols represent individual antibodies, and lines represent median MPER-HuGL18H/mouseL values. b,c, Representative flow cytometry plots showing CD45.2+ and CD45.1+ B cells (b) and quantification of the percentage of GC B cells and CD45.2+ B cells (c) in spleen GCs at days 7, 14 and 21 p.i. in CD45.1 wild-type mice transferred with CD45.2 MPER-HuGL18H B cells (1:104 MPER-HuGL18H B cells) 1 day before immunization with 5 µg of 10E8-GT10.3 12mer or 5 µg of 10E8-GT9-KO 12mer with alhydrogel. Data were pooled from two to three independent experiments (n = 4–10 per treatment), and lines show respective means. d, Number of nucleotide (nt; left) and amino acid (aa; right) mutations in IGHV of epitope-specific MPER-HuGL18H CD45.2+GT10++KO GC B cells at days 14 and 21 p.i., as in b. The black line indicates the median number of mutations. e, Phylograms showing diversification of IGHV sequences from MPER-HuGL18 CD45.2+GT10++KO GC B cells at days 14 and 21 p.i., as in d. f, Pie plots showing MPER-HuGL18 heavy chains (top) and associated mouse light chains (bottom) sequenced from epitope-specific MPER-HuGL18H CD45.2+GT10++KO GC B cells at days 14 and 21 p.i. with 10E8-GT10.3 12mer and alhydrogel as in b and pretransfer (day −1, naive) MPER-HuGL18 GT10++KO B cells as a control. g, Affinities of mAbs expressed from MPER-HuGL18H CD45.2+GT10++KO GC B cells (GT10.3-MPER-HuGL18H) and endogenous CD45.1+GT10++KO GC B cells (GT10.3-WT) at days 14 and 21 p.i. with 10E8-GT10.3 12mer as in b and affinities of iGL and pretransfer (day −1) MPER-HuGL18H, with iGL wild-type mAbs for monomeric 10E8-GT10.2 (naive) as a control, as measured by monomer SPR assay. Circles represent individual antibodies, and lines mark median values.
Fig. 8
Fig. 8. Survival of 10E8 B cells in GCs after immunization with a clinically relevant candidate immunogen varies by precursor clonotype.
a, Quantifications of the percentages of GC B cells (left) and epitope-specific CD45.2+GT10++KO GC B cells (right) in spleens at day 7 p.i. in CD45.1 wild-type mice adoptively transferred with 10E8-NGS-04H, 10E8-UCAH and MPER-HuGL18H CD45.2 B cells to reach a frequency of 1:104 for each precursor lineage 1 day before immunization with 5 µg of 10E8-GT10.2 12mer or 10E8-GT9-KO 12mer with alhydrogel. Data are pooled from two independent experiments (n = 5–7 per treatment). Error bars indicate mean ± s.d. from mice in the pooled group. Significance was calculated by using a two-tailed unpaired t-test. b, Pie plots and bar graphs showing the frequencies of MPER-HuGL18, 10E8-UCA and 10E8-NGS-04 heavy chains sequenced from CD45.2+GT10++KO GC B cells at days 7 and 21 p.i. as in a (n = 12 mice). Significance was calculated by using an unpaired t-test with Welch’s correction. c, Uniform manifold approximation and projection embedding of 10E8-UCAH and MPER-HuGL18H CD45.2+GT10++KO GC B cells from the dark zone (DZ) and light zone (LZ) of spleen GCs at day 7 p.i., as in b (left), and stacked bar plot showing cluster composition of 10E8-UCAH and MPER-HuGL18H light zone and dark zone B cells. Bars represent the fraction of cells in dark zone/light zone clusters in each cell line.
Extended Data Fig. 1
Extended Data Fig. 1. Generation of preclinical mouse models expressing the heavy chains of NGS-04 and 10E8UCA, related to Fig. 1.
a, Representative flow cytometry of bone marrow progenitors isolated from 8–10‐week‐old wild-type, 10E8-NGS-04H and 10E8-UCAH mice separated by Hardy classification into: early (B220+CD43+) and late (B220+CD43) B cells (top panel); early (A–C) B cell subfractions (middle panel); and the late (D–F) subfractions in the bone marrow (bottom panel). Data is representative of two independent experiments (n = 3–4 mice/independent group). b, Quantification of flow cytometry of bone marrow progenitors, as in a. Error bars indicate mean ± SD from mice in each group. Data are pooled from two independent experiments (n = 3–4 per treatment) for wild-type, 10E8-NGS-04H and 10E8-UCAH mice; MPER-HuGL18H data presented for comparative purposes (n = 4 mice from one experiment). c, Representative flow cytometry of CD4+/CD8+ T cells and T2/MZB (marginal zone B cells) cells isolated from spleen samples of 8–10‐week‐old wild-type, 10E8-NGS-04H and 10E8-UCAH mice, as in Fig. 1a,b. d, Quantification of T and B cell subfractions, as in c. Error bars indicate mean ± SD from mice in each group. Data are pooled from two independent experiments (n = 3–4 per treatment) for wild-type, 10E8-NGS-04H and 10E8-UCAH mice, with some values repeated from Fig. 1a, b for comparison; MPER-HuGL18H data also presented for comparative purposes (n = 4 mice from one experiment). e, Representative flow cytometry histograms showing expression of B220, IgM and IgD in follicular B cells in spleen (green, WT; red, 10E8-NGS-04; yellow, 10E8-UCA and blue, MPER-HuGL18). Data representative of two independent experiments (n = 3–4 mice per treatment) for wild-type, 10E8-NGS-04H and 10E8-UCAH mice; MPER-HuGL18H data presented for comparative purposes (n = 4 mice from one experiment).
Extended Data Fig. 2
Extended Data Fig. 2. B cell development in 10E8 mice, related to Fig. 1.
a, Representative flow cytometry of immature (B220+CD93+) and mature (B220+CD93) B cells isolated from spleen samples of 8–10‐week‐old wild-type, 10E8-NGS-04H and 10E8-UCAH. b, Representative flow cytometry of T1, T2 and T3 subfractions from immature B cells isolated from spleen samples of wild-type, 10E8-NGS-04H and 10E8-UCAH. c, Quantification of transitional cells subset T3 as in b, with MPER-HuGL18H shown for comparison. Error bars indicate mean ± SD from mice in each group (n = 4). Data representative of two independent experiments (n = 3 mice per treatment) for wild-type, 10E8-NGS-04H and 10E8-UCAH mice with one presented; MPER-HuGL18H data from one experiment presented for comparative purposes (n = 4 mice from one experiment). d, Gating strategy for single-cell sorting of naïve B cells from blood of 10E8-NGS-04H and 10E8-UCAH mice. e, f, 10x Genomics single-cell BCR sequences from B220+IgM+ naïve B cells sorted from 10E8-NGS-04H (e) and 10E8-UCAH (f) mice. Human NGS-04 IGHV gene frequency in teal (94%), human 10E8UCA IGHV gene frequency in green (65%), and grey murine HC. Pies on the right shows the respective murine IGKV genes in various colors; IGKV families used in key. n=pairs amplified, NGS-04 (n = 1046) and 10E8-UCA (n = 1260). g, Left, crystal structure of the T298 scaffold (PDB 3T43) that served as a starting point for the iterative vaccine design of 10E8-GT9 and 10E8-GT10 immunogens. Purple: MPER; Cyan: scaffold backbone. Right, schematic illustration of the multimerization of the 10E8-GT immunogens into self-assembling 12mer nanoparticles.
Extended Data Fig. 3
Extended Data Fig. 3. 10E8 UCA B cells can be activated in vivo, related to Fig. 2.
a, Representative equilibrium binding curves of 10E8-GT9.2 interacting with human 10E8-UCAH/UCAL and 10E8-NGS-04H/10E8-NGS-04L as measured by the monomer SPR assay. b, Quantification of precursor frequencies corresponding to transfer of 5,000, 50,000, 100,000, 200,000 and 500,000 CD45.2+10E8-UCAH B cells from donor mice to the host wild-type CD45.1+ mice. (n = 4). Error bars indicate mean ± SD from mice in each group. Experiment performed once. c, Flow cytometry of CD45.2+ cells in splenic GCs of mice transferred with varying numbers of CD45.2+10E8-UCAH precursors and immunized with 50 μg of 10E8-GT9 12mer and the Ribi adjuvant system 7 DPI. d, Representative gating strategy used for the GC response in adoptive transfer experiments.
Extended Data Fig. 4
Extended Data Fig. 4. New immunogen sequences and binding, related to Fig. 2.
a, Sequences of new immunogens. Mutations relative to 10E8-GT9.2 12mer are red; nanoparticles are purple; the PADRE epitope is in brown; N-linked glycosylation sites are blue; flexible linkers are green. Sequences are wrapped over multiple lines. b, Table and schematic describing the 10E8-GT9 nanoparticle design elements including GT version, added glycan sites, presence of PADRE T-help epitope, and off-target reduction. c, Representative FACS gating strategy for 10E8-GT9 libraries designed to reduce off-target responses. A selection strategy was employed to maintain high binding to 10E8-UCA (y-axis) while reducing binding of mouse competitors (x-axis). d, Graph showing affinities of human 10E8-UCAH/ UCAL Fab and Fabs of 10E8-UCAH/mouseL to 10E8-GT9.2 12mer, 10E8-GT9.3 12mer, 10E8-GT9.4 12mer, 10E8-GT9.5 12mer and 10E8-GT9.6 12mer, using the nanoparticle SPR assay. Symbols represent individual antibodies; lines represent median 10E8-UCAH/ mouseL values.
Extended Data Fig. 5
Extended Data Fig. 5. NGS-04H mice show weak immune responses to 10E8-GT10.2, related to Fig. 3.
a, Graph showing mean fluorescence intensity (MFI, % of initial) of 10E8-GT10.2 dissociation from 10E8-UCAH (green) and 10E8-NGS-04H BCRs (teal). Error bars indicate SD (n = 4). Experiment performed once. b, Schematic showing wild-type mice adoptively transferred with 10E8-NGS-04H precursors and immunized with either 50 µg of 10E8-GT9.6 12mer, 10E8-GT10.2 12mer or 10E8-GT9-KO 12mer with ribi adjuvant (control), as in Fig. 3b, c. c, Schematic showing wild-type mice adoptively transferred with 10E8-NGS-04H precursors and immunized with either 5 μg 10E8-GT10.2 12mer and alhydrogel or 5 μg 10E8-GT9-KO 12mer control and alhydrogel. d, Representative flow cytometric plots of CD45.2+10E8-NGS-04H B cells recruitment to GCs 7 and 14 DPI in spleens of mice immunized as in c. e, Quantification of GC size and CD45.2 in GC in spleen of mice immunized in c,d. Data are pooled from two independent experiments (n = 5–6 per treatment). Error bars indicate mean ± SD from mice in each group.
Extended Data Fig. 6
Extended Data Fig. 6. Antigen multimerization does not impact the GC response, related to Fig. 3.
a, Representative flow cytometry plots of CD45.2+10E8-UCAH recruitment to GCs 7 DPI in spleens of mice immunized with 5 μg of 10E8-GT10.2 12mer or with 25 μg, 6.2 μg or 1.5 μg of GT10.2 60mer and Ribi adjuvant. b, Quantification of a: (Left) GC size; (right) CD45.2+10E8-UCAH cells in GCs. Error bars indicate mean ± SD from mice in each group (n = 3). Two independent experiments were performed; data from one representative shown. c, ELISA of Ab response to immunizations as in a. Green dots represent IgG level specific to 10E8-GT10.2 probe and gray dots represent IgG level to 10E8-GT10-KO probe. Each symbol represents a different mouse. Bars indicate geometric mean and geometric SD from mice in pooled groups. n = 2–3 mice in each group. d, Quantification of GC size and epitope specific (GT10++KO) CD45.2+10E8-UCAH in GC from mice immunized with different doses of 10E8-GT10.2 12mer with Ribi adjuvant, as shown in Fig. 3d. Error bars indicate mean ± SD from mice in each group (n = 4). Two independent experiments performed, one shown. e, Quantification of GC size and epitope specific (GT10++KO) CD45.2+10E8-UCAH in GC from mice immunized with different doses of 10E8-GT10.2 12mer with alhydrogel, as shown in Fig. 3d. Error bars indicate mean ± SD from mice in each group (n = 3). Three independent experiments were performed; data from one representative shown. f, Quantification of lymph node response in mice. GC size, CD45.2+10E8-UCAH B cells in GCs and epitope specific CD45.2+ in GCs from 7 DPI with 10E8-GT10.2 12mer and alhydrogel, from mice immunized as in Fig. 3d. Error bars indicate mean ± SD from mice in each group (n = 3).
Extended Data Fig. 7
Extended Data Fig. 7. Antigens with a minimum affinity can recruit 10E8-UCAH B cells to germinal centers, related to Fig. 3.
a, Schematic showing mice adoptively transferred to reach ~1:104 10E8-UCAH precursors and immunized with 5 µg either different variants of 10E8-GT9 12mer and GT10.2 12mer with alhydrogel or 10E8-GT9-KO 12mer with alhydrogel (control); experiment performed once. b, Quantification of GC size, CD45.2+10E8-UCAH B cells in GC and epitope specific CD45.2+10E8-UCAH in GC in spleen of mice immunized as in a. Error bars indicate mean ± SD from mice in each group (n = 5). c, Quantification of GC size, CD45.2 in GC and epitope specific CD45.2 in GC in lymph nodes of mice immunized in a. Error bars indicate mean ± SD from mice in each group (n = 5).
Extended Data Fig. 8
Extended Data Fig. 8. Epitope-specific 10E8 B cells are outcompeted by endogenous WT B cells in GCs, related to Figs. 4 and 5.
a, Schematic of adoptive transfer of CD45.2+ 10E8-UCAH B cells into CD45.1+ wild-type mice followed by immunization with 10E8-GT10.2 12mer with alhydrogel and analysis until 21 DPI. b, Quantification of percent of B cells in GC of spleen from mice immunized with 10E8-GT10.2 12mer at 7, 14, and 21 DPI, as in a. Green lines show the mean percentage of 10E8-UCAH GC B cells in mice immunized with 10E8-GT10.2 12mer and gray lines show mean percentage of cells immunized with 10E8-GT9-KO 12mer (n = 3). Data from one representative of three independent experiments shown. c, Quantification of epitope specific CD45.2+10E8-UCAH in mice immunized with 10E8-GT10.2 12mer at different time points, as in a. Error bars indicate mean ± SD from mice in each group (n = 3). Data from one representative of three independent experiments shown. d, ELISA of Ab response of 10E8-UCAH to immunizations with 10E8-GT10.2 12mer, as in a. Green dots represent IgG titer specific to 10E8-GT10.2 probe and gray dots represent IgG level to KO probe. Data pooled from three independent experiments. Each symbol represents a different mouse. Bars indicate geometric mean and geometric SD from mice in all three groups. n = 4-5 mice in each group. e, Graph showing the MFI of mAb-GT10.2-CD45.2 10E8-UCAH-14DPI-PE with varying amounts of competing antibodies (µg) on x-axis (yellow: CD45.2 Ab; red: CD45.1 Ab). Dotted line represents the ‘no competition’ control. f, Representative flow cytometric plots of CD45.2+10E8-UCAH B cells recruitment to GCs 7 and 14 DPI in spleens of mice transferred to reach frequencies of ~1:104 5:104 and 25:104 CD45.2+10E8-UCAH precursors and immunized with 5 μg of 10E8-GT10.2 12mer with alhydrogel or 10E8-GT9-KO 12mer with alhydrogel (control). g, Quantification of CD45.2+ in GC in spleen of mice immunized in f. Data are pooled from two independent experiments. Error bars indicate mean ± SD from mice in each group (n = 3 mice/independent group).
Extended Data Fig. 9
Extended Data Fig. 9. Higher affinity 10E8-GT10.3 improves GC sustenance of 10E8 B cells, related to Fig. 6.
a, Schematic of CD45.1+ mice adoptively transferred to establish a frequency of 1:104 CD45.2+10E8-UCAH B cells and then immunized with either 5 μg of 10E8-GT10.3 12mer, 10E8-GT10.2 12mer, or a control KO immunogen with alhydrogel, as in Fig. 6c. b, Quantification of percentage of GC B cells post immunization with 10E8-GT10.3 12mer, 10E8-GT10.2 12mer, or 10E8-GT9-KO 12mer. Data are pooled from two independent experiments (n = 5–8) with lines marking the respective means. c, Quantification of epitope specific (GT10++KO) CD45.2+10E8-UCAH B cells in GC in mice immunized with 10E8-GT10.2 12mer or 10E8-GT10.3 12mer at different time points, as in a. Error bars indicate mean ± SD from mice in each group (n = 5–8). Data are pooled from two independent experiments. d, Quantification of epitope specific CD45.1+ cells in GC in mice immunized as in a. Data are pooled from two independent experiments. *p =0.0137(unpaired t test, two tailed); ns, not significant. N = 5–8 mice in each group; lines mark means. e, Mutations in IGHV of GT10-specific 10E8-UCAH B cells 7, 14, and 21 DPI. (Left) Nucleotide (nt); (right) amino acid (aa). The black dashed line indicates the median number of mutations. f, Diversification of IGHV sequences from 10E8-UCAH B cells isolated at 7, 14, and 21 DPI with 10E8-GT10.3 12mer as in e. g, Graph comparing the number of mutations in heavy chain of 10E8-UCA cells (x-axis) against their affinity (y-axis) (shown in Fig. 6e) 21 DPI with 10E8-GT10.3 12mer. h, HCs (top) LCs (bottom) sequenced from GT10-specific 10E8-UCAH B cells 7, 14, and 21 DPI by 10E8-GT10.3 and alhydrogel, as in a. Numbers inside pie shows the number of cells sequenced. i, Graph showing the affinities of the 10E8-UCAH 21 DPI as per in Fig. 6e with the associated mouse light chains.
Extended Data Fig. 10
Extended Data Fig. 10. Mice carrying native human precursor sequence show a sustained GC response and form memory, related to Fig. 7.
a, Schematic of CD45.1+ mice adoptively transferred to establish a frequency of 1:104 CD45.2+MPER-HuGL18H B cells and then immunized with either 5 μg of 10E8-GT10.3 12mer immunogen and alhydrogel, or 10E8-GT9-KO 12mer (control), as per Fig. 7b. b, Quantification of epitope specific CD45.2+MPER-HuGL18H B cells in mice immunized with 10E8-GT10.3 12mer as in a. Error bars indicate mean ± SD from mice in each group (n = 6–8). Data pooled from two independent experiments. c, Immunohistochemistry of spleen at 21 DPI. Red: GL7 (GC marker); White: CD45.2; Green: IgD; Blue: TCRβ. Scale, 250 um. d, Quantification showing CD45.2 recruitment in GCs from 10E8-UCAH or MPER-HuGL18H transferred mice immunized with 10E8-GT10.2 12mer and 10E8-GT10.3 12mer (merged data from Figs. 6d, 7c, and ref. ). Data are pooled from 2–3 independent experiments (n = 4–6). Error bars indicate mean ± SD. (*p = 0.0131, **p = 0.0085) (unpaired t test, two-tailed). e, Representative flow cytometry showing gating strategy used for the identification of memory B cells (MBC) 36 DPI with 10E8-GT10.3 12mer with alhydrogel (n = 8) or 10E8-GT9-KO 12mer with alhydrogel (n = 5). f, Quantification of memory B cells (MBC) 36 DPI with 10E8-GT10.3 12mer, as in e. Experiment performed once. Error bars indicate mean ± SD. (p = 0.024) (unpaired t-test, two-tailed). g, Graph of the affinities of MPER-HuGL18H mAbs 21 DPI with 10E8-GT10.3 12mer (panel with affinities) (y-axis) sorted by light chain (x-axis) LOD: limit of detection. h, Graph showing the affinities (y-axis) of the subset using IGKV1-117 light chains from the MPER-HuGL18H 21 DPI with 10E8-GT10.3 12mer (selection from Fig. 7g) vs. number of heavy chain mutations (x-axis). LOD: limit of detection. i, Tree showing phylogenetic relationship between MPER-HuGL18H B cell IGHV sequences, colorized on the basis of 21 DPI affinities shown in (Fig. 7g).

References

    1. Burton DR, Hangartner L. Broadly neutralizing antibodies to HIV and their role in vaccine design. Annu. Rev. Immunol. 2016;34:635–659. doi: 10.1146/annurev-immunol-041015-055515. - DOI - PMC - PubMed
    1. Chen J, et al. Mechanism of HIV-1 neutralization by antibodies targeting a membrane-proximal region of gp41. J. Virol. 2014;88:1249–1258. doi: 10.1128/JVI.02664-13. - DOI - PMC - PubMed
    1. Krebs SJ, et al. Longitudinal analysis reveals early development of three MPER-directed neutralizing antibody lineages from an HIV-1-infected individual. Immunity. 2019;50:677–691. doi: 10.1016/j.immuni.2019.02.008. - DOI - PMC - PubMed
    1. Kwong PD, Mascola JR. HIV-1 vaccines based on antibody identification, B cell ontogeny, and epitope structure. Immunity. 2018;48:855–871. doi: 10.1016/j.immuni.2018.04.029. - DOI - PubMed
    1. Sok D, Burton DR. Recent progress in broadly neutralizing antibodies to HIV. Nat. Immunol. 2018;19:1179–1188. doi: 10.1038/s41590-018-0235-7. - DOI - PMC - PubMed

LinkOut - more resources