. 2024 Jun;25(6):1007-1019.
doi: 10.1038/s41590-024-01845-6. Epub 2024 May 30.

Alternative platelet differentiation pathways initiated by nonhierarchically related hematopoietic stem cells

Affiliations

Alternative platelet differentiation pathways initiated by nonhierarchically related hematopoietic stem cells

Joana Carrelha et al. Nat Immunol. 2024 Jun.

Abstract

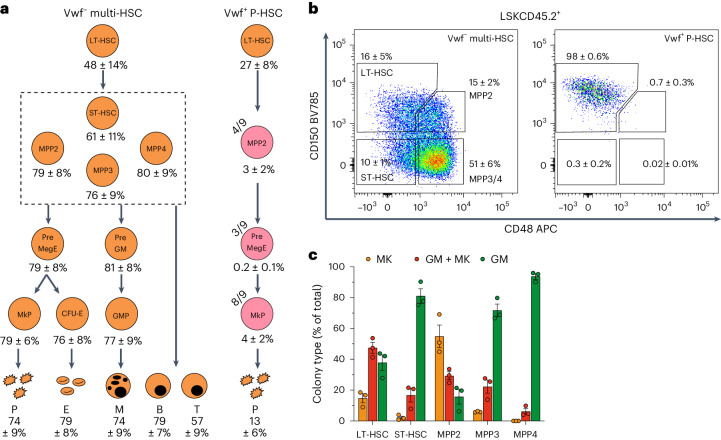
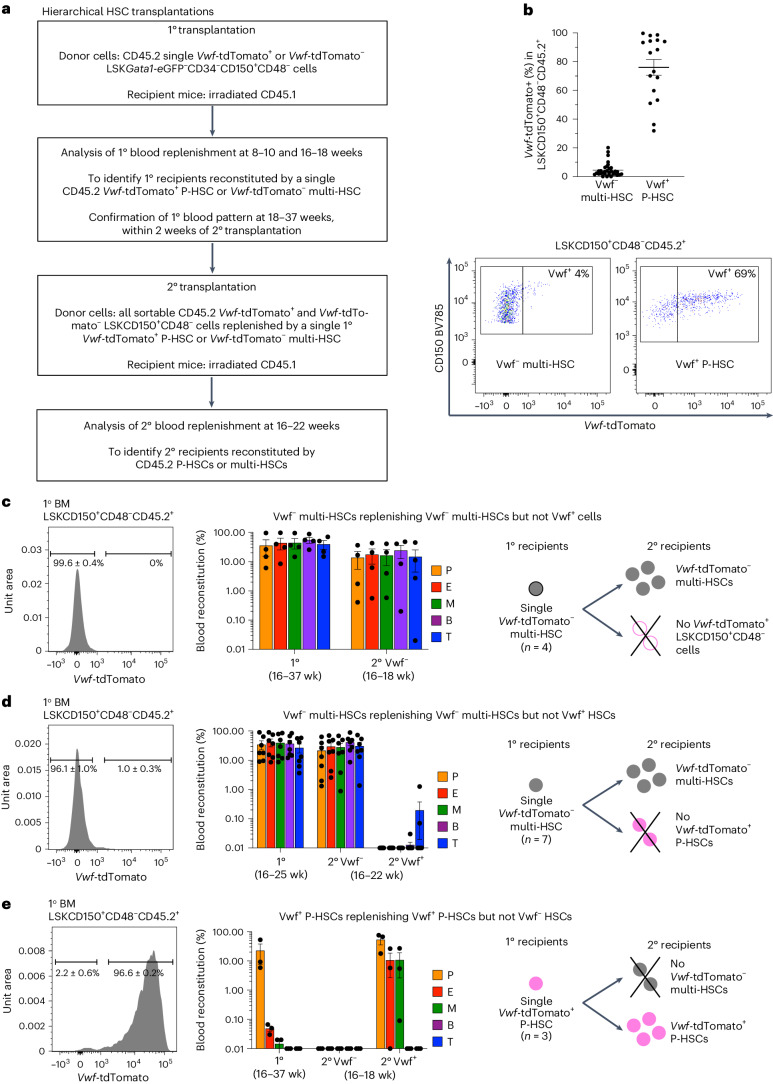
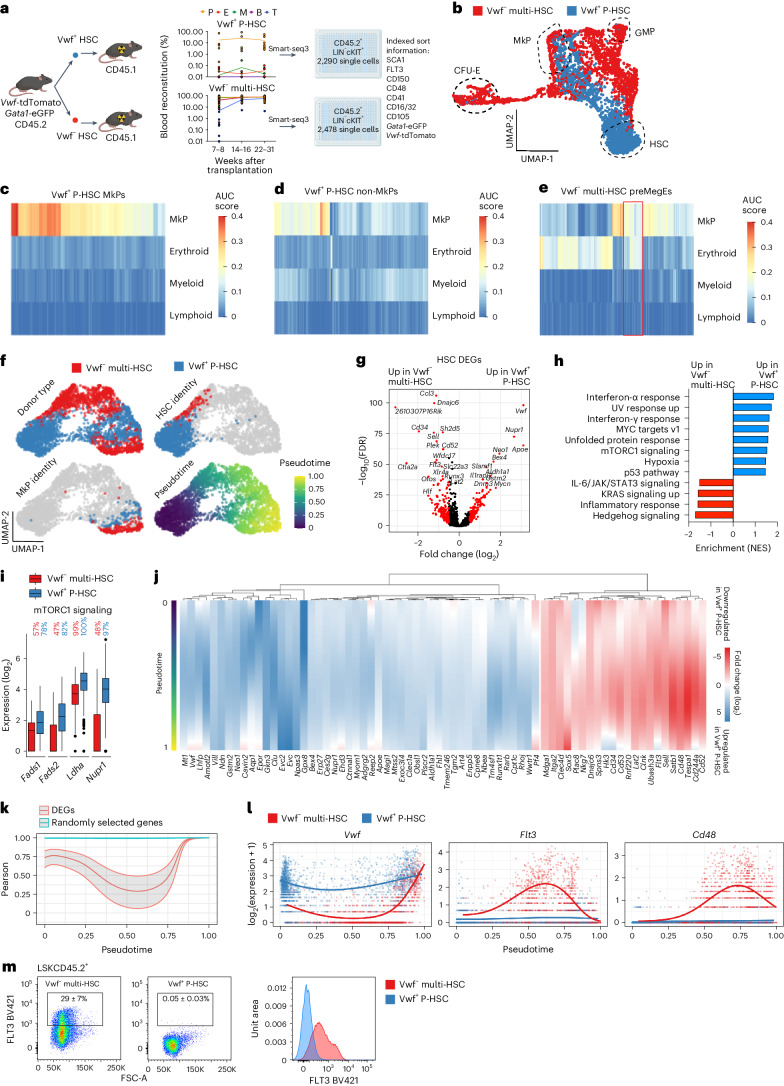
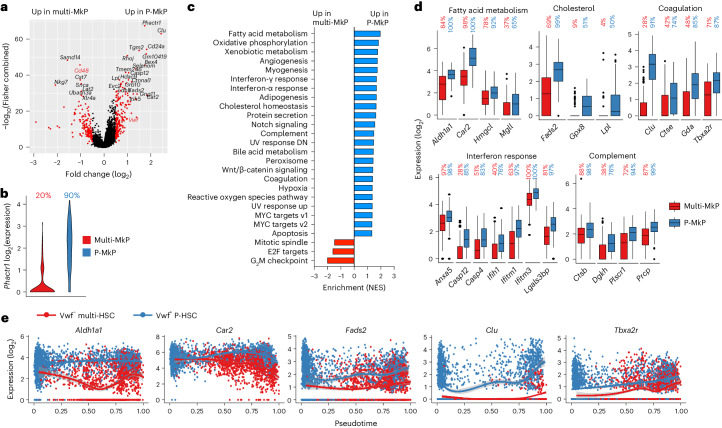
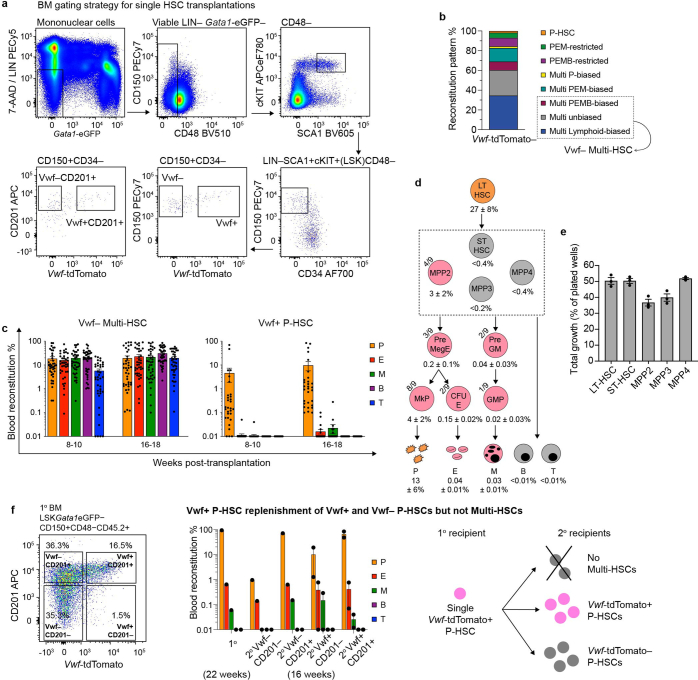
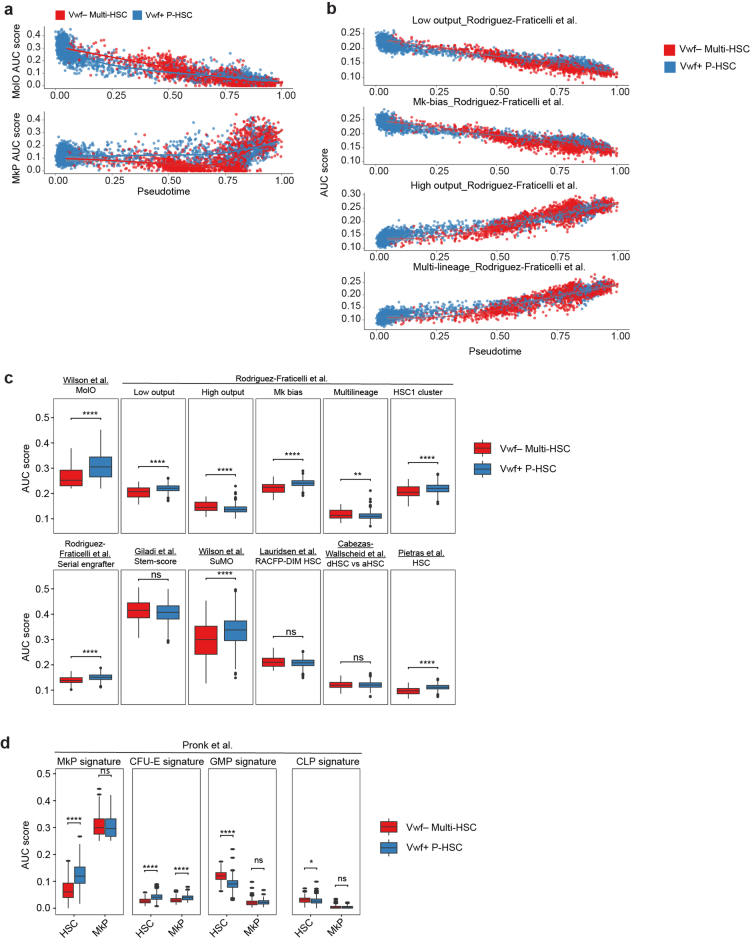
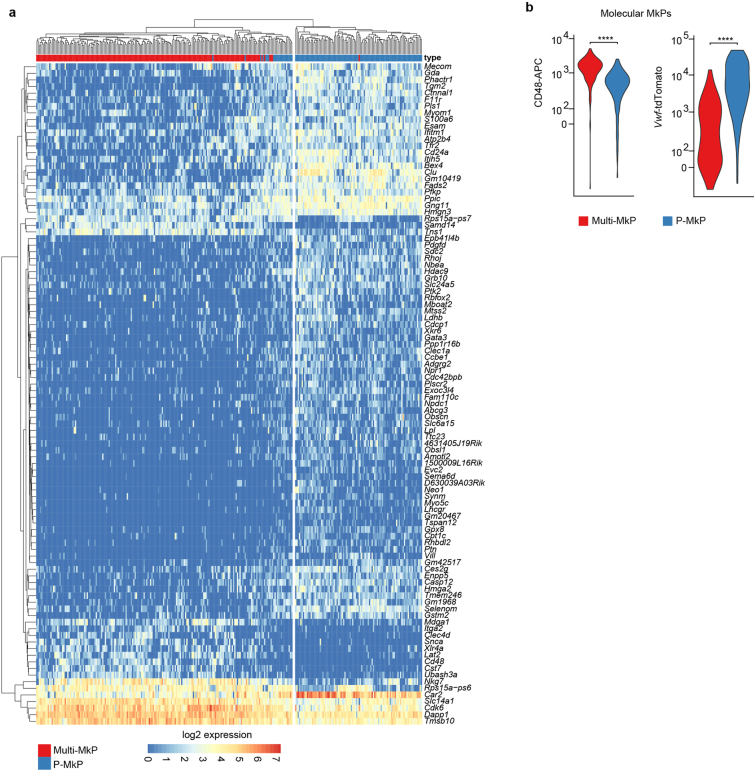
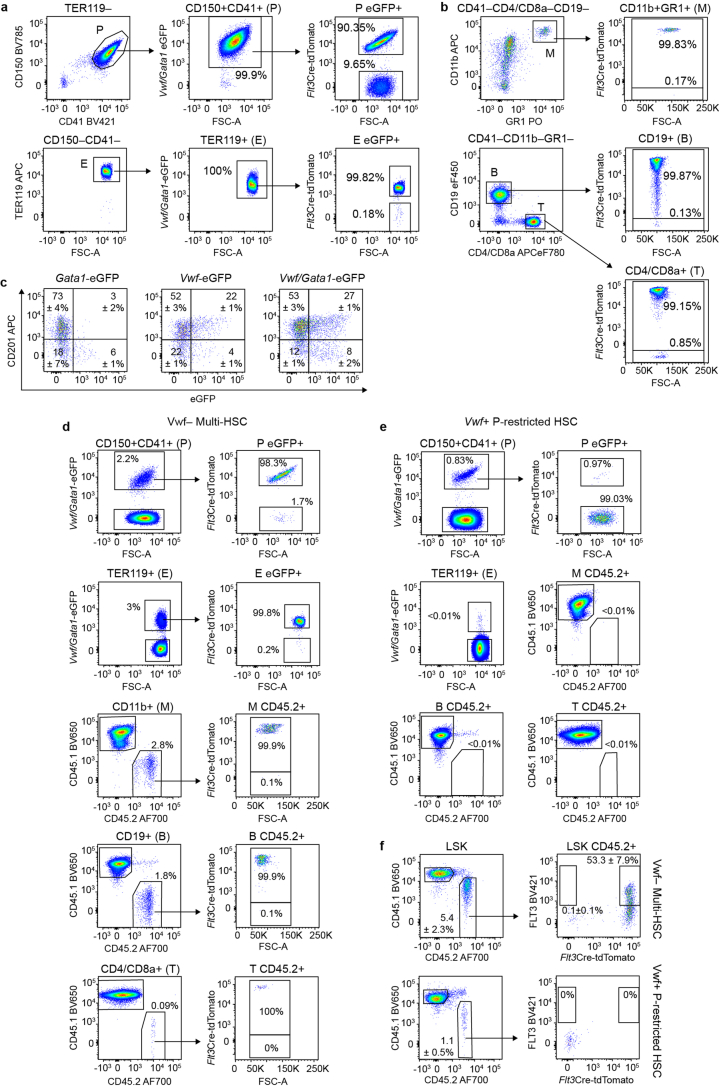
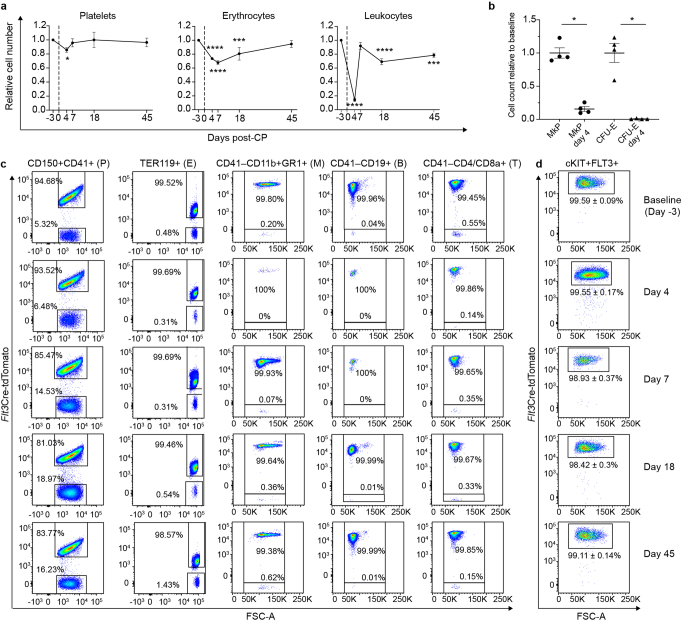
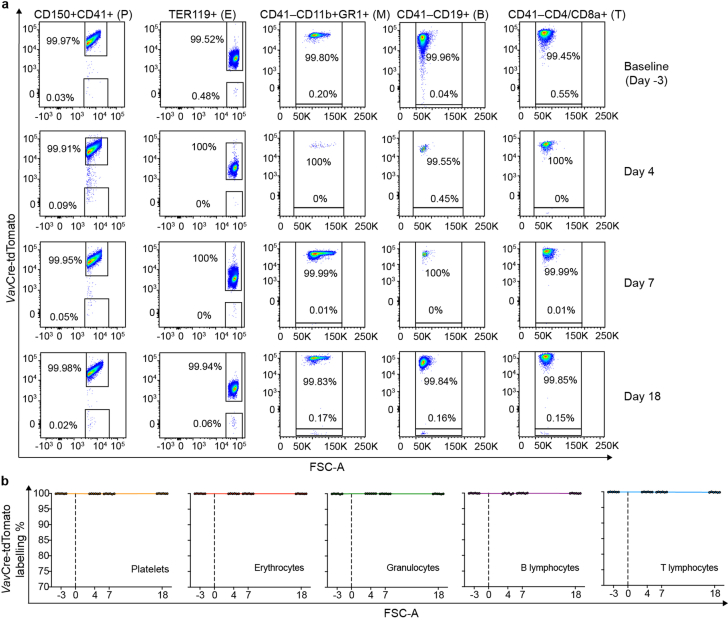
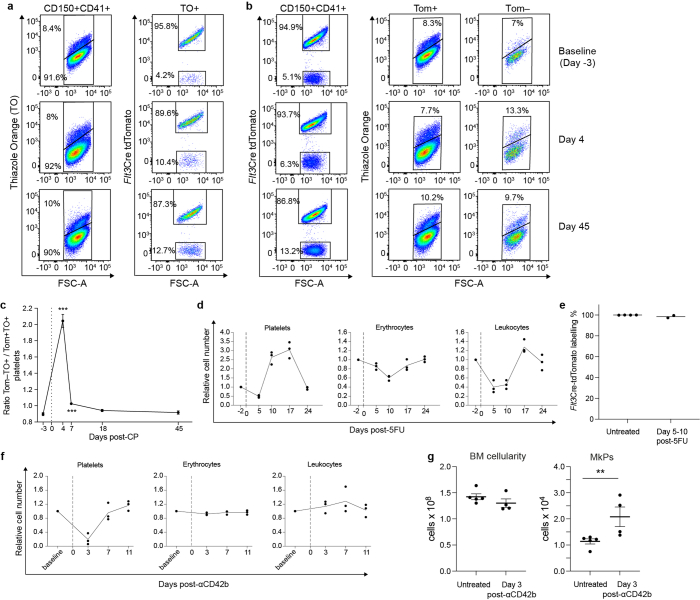
Rare multipotent stem cells replenish millions of blood cells per second through a time-consuming process, passing through multiple stages of increasingly lineage-restricted progenitors. Although insults to the blood-forming system highlight the need for more rapid blood replenishment from stem cells, established models of hematopoiesis implicate only one mandatory differentiation pathway for each blood cell lineage. Here, we establish a nonhierarchical relationship between distinct stem cells that replenish all blood cell lineages and stem cells that replenish almost exclusively platelets, a lineage essential for hemostasis and with important roles in both the innate and adaptive immune systems. These distinct stem cells use cellularly, molecularly and functionally separate pathways for the replenishment of molecularly distinct megakaryocyte-restricted progenitors: a slower steady-state multipotent pathway and a fast-track emergency-activated platelet-restricted pathway. These findings provide a framework for enhancing platelet replenishment in settings in which slow recovery of platelets remains a major clinical challenge.


Conflict of interest statement

M.H.-J., C.Z. and R.S. report holding shares in Xpress Genomics AB, and M.H.-J. and R.S. are inventors on the patent relating to Smart-seq3 that is licensed to Takara Bio USA. The other authors declare no competing interests.

Figures

Fig. 1
Fig. 1. Distinct platelet replenishment kinetics from single HSCs.
a, HSPC hierarchy reconstituted by single LSKGata1-eGFPCD34CD150+CD48 Vwf-tdTomato multi-HSCs (n = 8) or Vwf-tdTomato+ P-HSCs (n = 9). The numbers shown are the mean ± s.e.m. percentage contributions to each population. Orange, reconstitution in all mice. Pink, reconstitution in some mice (the fraction of reconstituted mice is indicated in the upper left of each circle); mean of positive mice. Only progenitor populations present in ≥1/3 of mice and with ≥0.1% average reconstitution are shown. For the full P-HSC hierarchy, see Extended Data Fig. 1d. Phenotypic definitions: LT-HSC, LSKFLT3CD150+CD48CD45.2+; ST-HSC, LSKFLT3CD150CD48CD45.2+; MPP2, LSKFLT3CD150+CD48+CD45.2+; MPP3, LSKFLT3CD150CD48+CD45.2+; MPP4, LSKFLT3+CD45.2+; MkP, LKCD150+CD41+CD45.2+; preMegE progenitor, LKCD41CD16/32CD150+CD105CD45.2+; colony-forming unit-erythroid (CFU-E), LKCD41CD16/32CD150CD105+Gata1-eGFP+; pregranulocyte–monocyte (preGM) progenitor, LKCD41CD16/32CD150CD105CD45.2+; GMP, LKCD41CD16/32+CD150CD105CD45.2+; platelets (P), CD150+CD41+TER119Vwf-tdTomato+Gata1-eGFP+ for Vwf-tdTomatotg/+ Gata1-eGFPtg/+ donors; erythrocytes (E), TER119+CD150CD41Vwf-tdTomatoGata1-eGFP+; myeloid (granulocyte and monocyte) cells (M), CD11b+NK1.1CD19CD4/CD8aCD45.1CD45.2+; donor-derived B lymphocytes (B), CD19+NK1.1CD4/CD8aCD11bCD45.1CD45.2+; donor-derived T lymphocytes (T), CD4/CD8a+NK1.1CD11bCD19CD45.1CD45.2+. b, HSCs and MPPs replenished by Vwf-tdTomato multi-HSCs (n = 8) or Vwf-tdTomato+ P-HSCs (n = 9). Representative profiles and mean ± s.e.m. percentages of the parent LSKCD45.2+ gate are shown. c, Granulocyte/monocyte (GM) and megakaryocyte (MK) in vitro lineage potentials (mean ± s.e.m.) of HSCs and MPPs replenished by Vwf-tdTomato multi-HSCs (n = 3). Data are from 580–720 plated wells per population with a similar distribution across three replicates. Each dot represents an independent experiment. Source data
Fig. 2
Fig. 2. Nonhierarchical relationship between distinct HSCs.
a, Experimental outline of hierarchical HSC transplantations. Further details of cell phenotypes and numbers are provided in Supplementary Tables 1–3. b, Top, percentage of Vwf-tdTomato+ cells within LSKCD150+CD48CD45.2+ cells replenished in the BM of CD45.1 primary (1°) recipients transplanted with a single CD45.2 LSKGata1-eGFPCD34CD150+CD48 Vwf-tdTomato multi-HSC (n = 33) or Vwf-tdTomato+ P-HSC (n = 17). Dots represent individual mice, and lines represent mean ± s.e.m. Bottom, representative flow cytometry profiles. c, Left, representative histogram (mean ± s.e.m., n = 4) of Vwf-tdTomato expression in LSKCD150+CD48CD45.2+ cells replenished in primary CD45.1 recipients by a single CD45.2 Vwf-tdTomato multi-HSC. Middle, primary blood reconstitution at 16–37 weeks (wk) and secondary (2°) reconstitution at 16–18 weeks after transplantation of Vwf-tdTomato LSKCD150+CD48CD45.2+ cells sorted from primary recipients (mean ± s.e.m., n = 4 from four experiments; in secondary recipients, each dot represents the average reconstitution of one to two mice per primary recipient). Right, interpretation of results regarding (non)hierarchical replenishment of multi-HSCs and P-HSCs. Further details of cell phenotypes and numbers are provided in Supplementary Table 1. d, Left, representative histogram (mean ± s.e.m., n = 7) of Vwf-tdTomato expression in LSKCD150+CD48CD45.2+ cells replenished in primary recipients of a single transplanted LSKGata1-eGFPCD34CD150+CD48 Vwf-tdTomato multi-HSC. Middle, primary and secondary blood reconstitution 16–25 and 16–22 weeks after transplantation, respectively (mean ± s.e.m., n = 7 primary recipients from five experiments; in secondary recipients, each dot represents the average reconstitution of one to three mice per primary recipient). Right, interpretation of results regarding (non)hierarchical replenishment of multi-HSCs and P-HSCs. Further details of cell phenotypes and numbers are provided in Supplementary Table 2. e, Left, representative histogram (mean ± s.e.m., n = 3) of Vwf-tdTomato expression in LSKCD150+CD48CD45.2+ cells replenished in primary recipients of a single transplanted LSKGata1-eGFPCD34CD150+CD48 Vwf-tdTomato+ P-HSC. Middle, primary and secondary blood reconstitution 16–37 and 16–18 weeks after transplantation, respectively (mean ± s.e.m., n = 3 primary recipients from three experiments; in secondary recipients, each dot represents the average reconstitution of one to two mice per primary recipient). Right, interpretation of results regarding (non)hierarchical replenishment of multi-HSCs and P-HSCs. Further details of cell phenotypes and numbers are provided in Supplementary Table 3. Source data
Fig. 3
Fig. 3. Distinct molecular platelet differentiation pathways.
a, Left, experimental design (partly created with Biorender.com) for single-cell RNA sequencing of HSPCs generated by single Vwf-tdTomato+ P-HSCs (n = 7) or Vwf-tdTomato multi-HSCs (n = 8). Right, mean (dots indicate individual mice) contribution to blood lineages. b, UMAP of LINcKIT+ cells replenished by single Vwf-tdTomato+ P-HSCs (blue; n = 7 mice, 2,290 cells) or Vwf-tdTomato multi-HSCs (red; n = 8 mice, 2,478 cells). HSC, GMP, MkP and CFU-E cells were classified based on molecular signatures (Extended Data Fig. 3b). ce, AUC heatmaps for lineage signatures in single MkPs (c; n = 133 cells) and other HSPCs (d; n = 2,157 cells) replenished by single Vwf-tdTomato+ P-HSCs (seven mice) and in preMegE progenitors with an MkP and/or erythroid AUC score of >0.1 (e; n = 212 cells) replenished by single Vwf-tdTomato multi-HSCs (eight mice). Red rectangle, preMegE progenitors derived from Vwf-tdTomato multi-HSCs with combined MkP–erythroid signatures without myeloid and lymphoid signatures. f, UMAP after removing erythroid- and myeloid-restricted progenitors, visualized by donor type, molecular HSC (MolO > 0.22), molecular MkP (AUC > 0.25) and pseudotime order. g, DEGs (red; adjusted P < 0.05, absolute log2(fold change) > 0.5) when comparing MolO HSCs replenished by Vwf-tdTomato+ P-HSCs (n = 1,047 cells) and Vwf-tdTomato multi-HSCs (n = 97 cells). h, Gene-set enrichment normalized enrichment scores (NES; false discovery rate (FDR) q value < 0.1) of HALLMARK pathways based on DEGs detected in g. i, Expression (log2) of DEGs (adjusted P < 0.05, combined Wilcoxon/Fisher’s exact test) related to mTORC1 signaling when comparing MolO HSCs derived from Vwf-tdTomato+ P-HSCs (n = 1,047 cells, seven mice) and Vwf-tdTomato multi-HSCs (97 cells, eight mice). Boxes, first and third quartiles; line, median; whiskers, ±1.5× interquartile range; dots, outlier cells. The percentages of cells with detected gene expression (Methods) are shown. j, Fold-change (log2) tradeSeq fitted expression values of the top 70 DEGs (adjusted P < 0.01, log2(fold change) > 1, patternTest tradeSeq function) along pseudotime when comparing cells replenished by Vwf-tdTomato+ P-HSCs and Vwf-tdTomato multi-HSCs. k, Pearson correlation (center line) along pseudotime comparing the expression of the top 70 DEGs and 70 randomly selected non-DEGs between cells replenished by Vwf-tdTomato+ P-HSCs and Vwf-tdTomato multi-HSCs. Shading indicates the 95% confidence interval (CI). l, Normalized gene expression along pseudotime for cells shown in f. Lines show the mean expression count from the generalized additive model fit using tradeSeq. m, FLT3 expression in LSKCD45.2+ cells generated by single Vwf-tdTomato multi-HSCs (n = 8) and Vwf-tdTomato+ P-HSCs (n = 9). Representative profiles with mean ± s.e.m. percentages of parent gates and representative histograms are shown. Source data
Fig. 4
Fig. 4. Transcriptional characterization of MkPs replenished by single Vwf-tdTomato multi-HSCs and Vwf-tdTomato+ P-HSCs.
a, DEGs (red; adjusted P < 0.05 and absolute log2(fold change) > 0.5, combined Wilcoxon/Fisher’s exact test) when comparing molecular MkPs replenished by single Vwf-tdTomato multi-HSCs (multi-MkPs; n = 177) or Vwf-tdTomato+ P-HSCs (P-MkPs; n = 119). Cd48 and Vwf are highlighted in red. b, Expression (log2) of Phactr1, the top DEG (P < 0.05, log2(fold change) > 0.5, combined Wilcoxon/Fisher’s exact test) when comparing multi-MkPs and P-MkPs. The percentages of cells with detected expression (Methods) are indicated above the violin plots. c, Normalized gene-set enrichment score for HALLMARK pathways of DEGs enriched (FDR q value < 0.1) in multi-MkPs (red) and P-MkPs (blue). d, Expression (log2) of DEGs (adjusted P < 0.05, combined Wilcoxon/Fisher’s exact test) associated with fatty acid metabolism, cholesterol homeostasis, coagulation, interferon response and complement when comparing multi-MkPs (red; n = 177 cells, eight mice) and P-MkPs (blue; n = 119 cells, seven mice). Boxes, first and third quartiles; line, median; whiskers, the largest values within the ±1.5× interquartile range; dots, outliers. The percentages of cells with detected gene expression (Methods) are shown above the boxes. e, Expression (log2) of selected genes in all LINcKIT+ single cells generated by single Vwf-tdTomato multi-HSCs or Vwf-tdTomato+ P-HSCs along pseudotime. Dots represent individual cells, and lines represent LOESS (locally estimated scatterplot smoothing) curves of the expression for the HSC subtype (gray shading indicates the 95% CI).
Fig. 5
Fig. 5. Phenotypic characterization of MkPs replenished by single transplanted Vwf-tdTomato multi-HSCs and Vwf-tdTomato+ P-HSCs.
a, Normalized expression (log2) of the indicated DEGs (adjusted P < 0.05, combined Wilcoxon/Fisher’s exact test) encoding Vwf and specified cell-surface proteins (Itga2 encodes CD49b) in single molecularly defined multi-MkPs (n = 177) or P-MkPs (n = 119). The percentage of cells expressing each gene (Methods) is indicated below each violin plot. b,c, Histograms (left), mean fluorescence intensity (MFI; middle) and percentage positive cells (right) based on flow cytometry analysis of the expression of Vwf-tdTomato reporter and CD24 (b; corresponding gene expression upregulated in P-MkPs) and of CD48 and CD49b (c; corresponding gene expression upregulated in multi-MkPs) in LKCD150+CD41+CD45.2+ MkPs replenished by single Vwf-tdTomato multi-HSCs (n = 3) or Vwf-tdTomato+ P-HSCs (n = 3). Histograms (percentage positive cells) show the expression on gated MkPs replenished by a platelet-restricted Vwf-tdTomato+ P-HSC and a Vwf-tdTomato multi-HSC. Dots represent individual mice, and lines represent mean ± s.e.m. Source data
Fig. 6
Fig. 6. Replenishment of molecularly distinct MkPs by Vwf-tdTomato multi-HSCs and Vwf-tdTomato+ P-HSCs.
a, DEGs (adjusted P < 0.05, combined Wilcoxon/Fisher’s exact test, absolute log2(fold change) > 0.5; blue, genes overlapping with the DEGs comparing total P-MkPs and total multi-MkPs in Fig. 4a; red, genes not overlapping with the DEGs in Fig. 4a) when comparing CD48+ (left; n = 122 cells) or CD48 (right; n = 51 cells) molecularly defined MkPs replenished by single Vwf-tdTomato multi-HSCs (multi-MkPs) to CD48 molecularly defined MkPs replenished by single Vwf-tdTomato+ P-HSCs (P-MkPs; n = 101 cells). Cd48, Vwf, Cd24a and Itga2 are highlighted in blue. b, Distribution of Vwf log2(mRNA expression) and percentage of Vwf transcript-positive cells (left) and Vwf-tdTomato reporter fluorescence distribution (right) in CD48 and CD48+ molecularly defined multi-MkPs and CD48 P-MkPs. The numbers of analyzed single cells are indicated below the violin plots. c, DEGs (adjusted P < 0.05, combined Wilcoxon/Fisher’s exact test, absolute log2(fold change) > 0.5; blue, genes overlapping with the DEGs comparing total P-MkPs and total multi-MkPs in Fig. 4a; red, genes not overlapping with the DEGs in Fig. 4a) when comparing Cd48 transcript-positive (left) or Cd48 transcript-negative (right) multi-MkPs (n = 102 and 71 cells, respectively) to Cd48 transcript-negative P-MkPs (n = 114 cells). Cd48, Vwf, Cd24a and Itga2 are highlighted in blue. d, DEGs (adjusted P < 0.05, combined Wilcoxon/Fisher’s exact test, absolute log2(fold change) > 0.5; blue, genes overlapping with the DEGs comparing total P-MkPs and total multi-MkPs in Fig. 4a; red, genes not overlapping with the DEGs in Fig. 4a) when comparing Cd48 transcript-positive (n = 102 cells) to Cd48 transcript-negative (n = 71 cells) multi-MkPs. A detailed list of detected DEGs is provided in Supplementary Table 4.
Fig. 7
Fig. 7. Fate mapping of alternative platelet replenishment pathways.
a, Flt3Cre-tdTomato labeling (mean ± s.e.m.) of blood lineages in steady-state Flt3Cretg/+ R26Tom/+ Vwf-eGFPtg/+ Gata1-eGFPtg/+ mice (n = 7; 8–13 weeks old): platelets (CD150+CD41+TER119), erythrocytes (TER119+CD150CD41), myeloid (granulocyte) cells (CD11b+GR1+CD41NK1.1CD19CD4/CD8a), B lymphocytes (CD19+CD41NK1.1CD4/CD8aCD11bGR1) and T lymphocytes (CD4/CD8a+CD41NK1.1CD11bGR1CD19). Dots represent individual mice. Tom, tdTomato. b, Representative profiles of Flt3Cre-tdTomato labeling in platelets (left) and mean ± s.e.m. labeling of all lineages (right) replenished by a single CD45.2 Vwf-eGFP multi-HSC (top; n = 14) and Vwf-eGFP+ platelet-restricted P-HSC (bottom; n = 14) 18–21 weeks after transplantation. Source data
Fig. 8
Fig. 8. Fate mapping of alternative platelet replenishment pathways upon hematopoietic challenges.
a, Flt3Cre-tdTomato labeling of blood lineages (as in Fig. 7a) in 7- to 11-week-old Flt3Cretg/+ R26Tom/+ mice after CP treatment on day 0. Analysis at baseline (day −3; n = 22) and on day 4 (n = 14), day 7 (n = 14), day 18 (n = 12) and day 45 (n = 7). Lines connect the mean of each time point. In platelets, ****P = 3.23 × 10−6 for day 4, ****P = 7.67 × 10−86 for day 7, ****P = 7.19 × 10−99 for day 18 and ****P = 6.88 × 10−45 for day 45 compared to baseline; ****P = 6.18 × 10−17 between days 18 and 45. Linear mixed-model two-sided analysis with P-value adjustment by the Benjamini–Hochberg procedure. b, Flt3Cre-tdTomato labeling (mean ± s.e.m.) of TO+ cells in 7- to 11-week-old Flt3Cretg/+ R26Tom/+ mice after CP treatment. Baseline (day −3), n = 16; day 4, n = 10; day 7, n = 10; day 18, n = 10; day 45, n = 7. Compared to baseline, ****P = 3.28 × 10−8 for day 4, ****P = 1.87 × 10−6 for day 7, ****P = 2.63 × 10−7 for day 18 and ***P = 1.23 × 10−4 for day 45. Two-way analysis of variance (ANOVA) with Bonferroni correction. Dots represent individual mice. c, TO labeling (mean ± s.e.m.) in the same mice as in b. Data represent the percentages of TO+ cells. ****P = 3.18 × 10−8 for day 4. Two-way ANOVA with Bonferroni correction. Dots represent individual mice. d, Flt3Cre-tdTomato labeling (as in c) upon 5FU treatment (day 0). Analysis at baseline (day −7 or −2) and on days 10, 17 and 24 after 5FU (n = 6). In platelets, ****P = 1.19 × 10−47 for day 10, ****P = 5.68 × 10−42 for day 17 and ****P = 3.95 × 10−23 for day 24 compared to baseline; ****P = 3.60 × 10−5 for day 17 and ****P = 4.10 × 10−27 for day 24, both compared to day 10. Compared to baseline, ****P = 4.05 × 10−18 for day 24 in erythrocytes and ****P = 6.30 × 10−11 for day 17 in myeloid cells. For myeloid cells, ****P = 9.60 × 10−7 for day 24 when compared to day 17. Linear mixed-model two-sided analysis with P-value adjustment by the Benjamini–Hochberg procedure. e, Platelet counts in Flt3Cretg/+ R26Tom/+ mice at baseline (day −10 or −3; n = 3) and on day 3 after anti-CD42b antibody treatment (n = 5). Dots represent individual mice, and lines represent mean ± s.e.m. f, Flt3Cre-tdTomato labeling (as in c) after anti-CD42b treatment (day 0). Analysis at baseline (day −10 or −3) and on days 3, 7 and 11 after anti-CD42b treatment (n = 5). A marginal significance was observed on day 11 (*P = 0.0466). Linear mixed-model two-sided analysis with P-value adjustment by the Benjamini–Hochberg procedure. Source data
Extended Data Fig. 1
Extended Data Fig. 1. In vitro and in vivo potentials of Vwf-tdTomato Multi-HSCs and Vwf-tdTomato+ P-HSCs.
a, Representative flow cytometry profiles and gating strategy for sorting of BM Vwf-tdTomato and Vwf-tdTomato+ LSKGata1-eGFPCD34CD150+CD48 cells for single cell transplantations. b, Frequency (%) of long-term (16–18 weeks post-transplantation) blood replenishment patterns in recipients reconstituted by a single LSKGata1-eGFPCD34CD150+CD48 (also CD201+ in some experiments) Vwf-tdTomato HSC (n = 58; 13 experiments). The 3 blood patterns included as Vwf Multi-HSCs in the present studies are highlighted. c, Peripheral blood replenishment (mean % ± s.e.m.) in recipients reconstituted by a single LSKGata1-eGFPCD34CD150+CD48 Vwf-tdTomato Multi-HSC (n = 39) or Vwf-tdTomato+ P-HSC (n = 30); 13 experiments. Phenotypic populations defined in Methods and Fig. 1a. d, Complete HSPC hierarchy by single Vwf-tdTomato+ P-HSCs (n = 9). Same mice as in Fig. 1a. Mean ± s.e.m. % contribution to each population. Orange: reconstituted in all mice. Grey: below detection level in all mice; mean of detection thresholds. Pink: reconstitution in some but not all mice (frequency of reconstituted mice is indicated in the upper left of each circle); mean of positive mice. Phenotypic populations defined in Methods and Fig. 1a. e, Frequency of wells with cell growth (mean ± s.e.m.) of the in vitro assay for granulocyte/macrophage (GM) and Mk lineage potentials shown in Fig. 1c. LT-HSC: 580 plated wells; ST-HSC: 660 wells; MPP2: 652 wells; MPP3: 720 wells; MPP4: 720 wells. Phenotypic populations defined in Methods and Fig. 1a. f, Unique case of a single Vwf-tdTomato+ P-HSC replenishing Vwf-tdTomato+ as well as Vwf-tdTomato P-HSCs but no Multi-HSCs. Left: Vwf-tdTomato and CD201 expression in LSKGata1-eGFPCD150+CD48CD45.2+ cells in the primary CD45.1 recipient of a single CD45.2 LSKGata1eGFPCD34CD150+CD48CD201+ Vwf-tdTomato+ P-HSC. Middle: Blood reconstitution in the primary (10) recipient at 22 weeks post-transplantation and in the secondary (20) recipients (mean ± s.e.m.) 16 weeks after transplantation. CD201Vwf-tdTomato n = 1; CD201+ Vwf-tdTomato n = 1; CD201Vwf-tdTomato+ n = 2; CD201+ Vwf-tdTomato+ n = 2. Right: Interpretation of results regarding (non-) hierarchical replenishment of Multi-HSCs and P-HSCs. See Fig.1a for cell phenotypes and Supplementary Table 3. Source data
Extended Data Fig. 2
Extended Data Fig. 2. Single cell RNA sequencing UMAP plots of cells from replicate recipients of single Vwf-tdTomato+ P-HSC or Vwf-tdTomato Multi-HSC.
Batch corrected UMAP plots of LINcKIT + cells replenished by a single transplanted Vwf-tdTomato+ P-HSC (7 recipient mice; P1-7) or Vwf-tdTomato Multi-HSC (8 recipient mice; M1-8). Colors indicate molecularly defined HSCs (red), MkPs (blue), and other cells (green). Mice used for RNA sequencing do not overlap with mice in Supplementary Tables 1–3.
Extended Data Fig. 3
Extended Data Fig. 3. Molecular signatures of HSPCs replenished from single Vwf-tdTomato Multi-HSCs or Vwf-tdTomato+ P-HSCs.
a, UMAP plots (as in Fig. 3b) of HSPC cell surface antigens; mRNA expression (left) and protein/reporter expression based on index sorting information from the same cells (right). b, UMAP plots of single LINcKIT+ HSPCs from mice reconstituted by single Vwf-tdTomato Multi-HSCs or Vwf-tdTomato+ P-HSCs. Color scales indicate expression of molecular signatures (AUCell scores) for HSCs (MolO), lineage restriction (MkP, erythroid, myeloid, and lymphoid), and cell cycle (G2M and S phases).
Extended Data Fig. 4
Extended Data Fig. 4. Nearest neighbor clustering and cluster markers.
a, UMAP plot (as in Fig. 3b) with identified molecular clusters among the cells derived from Vwf-tdTomato Multi-HSC or Vwf-tdTomato+ P-HSC. Colors indicate individual clusters. b, Expression patterns of top genes defining clusters in a. c, UMAP reduction computed based on indicated numbers of variable genes generated independently of the analysis pipeline used to generate UMAPs shown in Fig. 3b. d, t distributed stochastic neighborhood embedding (t-SNE) of the cells in Fig. 3b.
Extended Data Fig. 5
Extended Data Fig. 5. HSC and Mk signatures of HSPCs replenished by single transplanted Vwf-tdTomato Multi-HSCs or Vwf-tdTomato+ P-HSCs.
a, MolO HSC (top) and MkP (bottom) AUC signature scores for HSPCs replenished by Vwf-tdTomato+ P-HSCs or Vwf-tdTomato Multi-HSCs along pseudotime. Dots represent individual cells and lines represent LOESS curves (local regression to fit a smooth curve through scatterplot) of AUC signature for the HSC subtype with 95% confidence interval (CI). b, Low output, high output, Mk-bias and multilineage AUC signature scores for HSPCs replenished by Vwf-tdTomato+ P-HSCs or Vwf-tdTomato Multi-HSCs along pseudotime. Dots represent individual cells and lines represent LOESS curves (local regression to fit a smooth curve through scatterplot) of AUC signature for the HSC subtype with 95% CI. c, d, AUC scores for stem cell associated signatures in HSCs (c) and for lineage-restricted progenitor signatures in HSCs and MkPs (d) replenished by Vwf-tdTomato+ P-HSCs (n = 1047 HSC and 119 MkPs from 7 mice) or Vwf-tdTomato Multi-HSCs (n = 97 HSCs and 177 MkPs from 8 mice), based on published gene signatures (see Methods). Boxes show first and third quartiles of the normalized expression values, where the line within each box indicates the median, whiskers indicate the largest value within the ±1.5*IQR, and dots indicate outlier cells. * P < 0.05, ** P < 0.01, **** P < 0.0001, ns P > 0.05 (non-significant) by two-sided Wilcoxon test. P values: MolO = 3.29 × 10−13, Low output = 9.84 × 10−11, High output = 4.88 × 10−6, Mk bias = 8.58 × 10−13, Multilineage = 0.0022, HSC1 cluster = 4.88 × 10−6, Serial engrafter = 1.37 × 10−11, Stem-score = 0.15, SuMO = 4.48 × 10−5, RACFP-DIM = 0.15, dHSCvsaHSC = 0.97, HSC = 2.54 × 10−13, HSC-MkP = 6.06 × 10−21, MkP-MkP = 0.72, HSC-CFUE = 4.08 × 10−24, MkP-CFUE = 2.65 × 10−11, HSC-GMP = 1.90 × 10−24, MkP-GMP = 0.72, HSC-CLP = 0.02, MkP-CLP = 0.72.
Extended Data Fig. 6
Extended Data Fig. 6. Molecularly distinct MkPs generated by Vwf-tdTomato+ P-HSCs and Vwf-tdTomato Multi-HSCs.
a, Heatmap of molecularly defined single MkPs replenished by single Vwf-tdTomato Multi-HSCs (Multi-MkPs; red) and Vwf-tdTomato+ P-HSCs (P-MkPs; blue) clustered based on expression of the 100 most differentially expressed genes (DEGs). b, Distribution of CD48 and Vwf-tdTomato protein/reporter level based on index data from FACS within molecularly defined Multi-MkPs and P-MkPs. **** P < 0.0001 by two-sided Wilcoxon test. P values: CD48-APC = 1.69 × 10−22, Vwf-tdTomato = 1.89 × 10−26.
Extended Data Fig. 7
Extended Data Fig. 7. Flt3Cre fate mapping of single HSCs.
a-b, Representative flow cytometry profiles (% of parent gates) of platelets and erythrocytes (a) and leukocyte lineages (b) of a 12 week old steady-state Flt3Cretg/+ R26Tom/+ Vwf-eGFPtg/+ Gata1-eGFPtg/+ mouse. P: platelets, E: erythrocytes, M: myeloid cells, B: B lymphoid cells, T: T lymphoid cells. c, CD201, Vwf-eGFP, and Gata1-eGFP expression (mean ± s.e.m. % of parent gate) in BM LSKCD34CD150+CD48 HSCs of 9–13 week old steady-state Flt3Cretg/+ R26Tom/+ Gata1-eGFPtg/+ (n = 2), Flt3Cretg/+ R26Tom/+ Vwf-eGFPtg/+ (n = 2), and Flt3Cretg/+ R26Tom/+ Vwf-eGFPtg/+ Gata1-eGFPtg/+ mice (n = 4). d, e, Representative flow cytometry profiles (% of parent gates) of blood lineages of a mouse reconstituted by a single Vwf-tdTomato Multi-HSC (d, n = 14) or a single Vwf-tdTomato+ P-restricted HSC (e, n = 14) sorted from a Flt3Cretg/+ R26Tom/+ Vwf-eGFPtg/+ Gata1-eGFPtg/+ donor. P: platelets, E: erythrocytes, M: myeloid cells, B: B lymphoid cells, T: T lymphoid cells. f, Cell-surface FLT3 and tdTomato (Tom) labelling (mean ± s.e.m. % of parent gate) in BM LSK cells of mice reconstituted by single Vwf-eGFP Multi-HSCs (n = 14) or Vwf-eGFP+ P-restricted HSCs (n = 14) sorted from Flt3Cretg/+ R26Tom/+ Vwf-eGFPtg/+ Gata1-eGFPtg/+ donors. Note that all LSKFLT3+ cells are Tom+ whereas Vwf-eGFP+ P-restricted HSCs do not generate LSKFLT3+ or LSKTom+ cells. Source data
Extended Data Fig. 8
Extended Data Fig. 8. Fate mapping of Flt3Cretg/+R26Tom/+ mice after Cyclophosphamide treatment.
a, Blood cell counts (mean ± s.e.m.) of 7–11 week old Flt3Cretg/+ R26Tom/+ mice before and after Cyclophosphamide (CP) treatment (day 0), relative to untreated baseline. Analysis on day -3 (baseline, n = 19), 4 (n = 13), 7 (n = 13), 18 (n = 10), and 45 (n = 7). All 19 mice with baseline measurement were bled on at least one additional time point; 7 of them were bled at all time points. Compared to baseline, *P = 2.27 × 10−2 for d4 in platelets; in erythrocytes ****P = 8.54 × 10−6 for d4, ****P = 4.81 × 10−8 for d7 and ***P = 1.88 × 10−3 for d18; in leukocytes ****P = 4.09 × 10−36 for d4, ****P = 2.56 × 10−7 for d18 and ***P = 1.72 × 10−3 for d45. Linear mixed-model two-sided analysis with P-value adjustment by Benjamini-Hochberg procedure. b, BM MkP and CFU-E progenitor cell counts (mean ± s.e.m.) in Flt3Cretg/+ R26Tom/+ mice on day 4 following CP treatment (n = 4), relative to untreated mice (n = 4). Both progenitor counts were significantly decreased (*P = 0.03); two-tailed Mann-Whitney test. c, Representative flow cytometry profiles (% of parent gates) of blood lineages of an 8 week old Flt3Cretg/+ R26Tom/+ mouse before and after CP treatment. d, Flt3Cre-tdTomato expression (mean ± s.e.m. % of parent gate) in BM LINcKIT+FLT3+ progenitor cells of Flt3Cretg/+ R26Tom/+ mice before and after CP treatment. Untreated (n = 4), and day 4 (n = 4), 7 (n = 4), 18 (n = 6), 45 (n = 7) after CP. Source data
Extended Data Fig. 9
Extended Data Fig. 9. Blood lineage analysis of VavCretg/+R26Tom/+ mice before and after Cyclophosphamide treatment.
a, Representative flow cytometry profiles (% of parent gates) of blood lineages of a 23 week old VavCretg/+ R26Tom/+ mouse before CP and on days 4 and 45 after CP. P: platelets, E: erythrocytes, M: myeloid (granulocytic) cells, B: B lymphoid cells, T: T lymphoid cells. b, VavCre-tdTomato labelling of blood lineages in 8–23 week old VavCretg/+ R26Tom/+ mice before and after CP (n = 6, same mice for all time points). Baseline on day -3 and CP injection on day 0. Lines connect the mean of each time point. Source data
Extended Data Fig. 10
Extended Data Fig. 10. Staining of blood platelets with Thiazole Orange after Cyclophosphamide treatment, and fate mapping of Flt3Cretg/+R26Tom/+ mice after 5FU and antibody-induced platelet depletion.
a, Representative flow cytometry profiles (% of parent gates) of Tomato labelling in Thiazole Orange positive (TO+) platelets of a Flt3Cretg/+ R26Tom/+ mouse before CP (upper panels), and on day 4 (middle panels) and 45 (lower panels) after CP. b, Representative flow cytometry profile (% of parent gates) of TO labelling in Tom+ and Tom platelets of a Flt3Cretg/+ R26Tom/+ mouse before and after CP. c, Ratio (mean ± s.e.m.) between TO+ Tom and TO+ Tom+ platelets in Flt3Cretg/+ R26Tom/+ mice before and after CP (day 0). Analysis at baseline (day -3, n = 16), and on day 4 (n = 10), 7 (n = 10), 18 (n = 10), and 45 (n = 7). Compared to baseline, ****P = 3.77 × 10−7 for d4 and ****P = 3.90 × 10−5 for d7. Two-tailed Mann-Whitney test. d, Blood cell counts, relative to baseline (d-2), of 8–10 week old Flt3Cretg/+ R26Tom /+ mice before and after 5-Fluorouracil (5FU, n = 3) treatment. Lines connect the means for each time point. e, Flt3Cre-tdTomato labelling of BM LINFLT3+ progenitor cells in Flt3Cretg/+ R26Tom /+ mice, untreated (n = 4) and 5–10 days after 5FU treatment (n = 2). Dots represent individual mice and lines represent means. f, Blood cell counts, relative to baseline of 12–13 week old Flt3Cretg/+ R26Tom/+ mice (n = 3), each analyzed before treatment (baseline; d-10 or -3) and on day 3, 7 and 11 after treatment with anti-CD42b antibody (αCD42b). Lines connect the means for each time point. g, BM cellularity (left) and BM LK CD150+CD41+ MkP (right) cell number recovered after crushing both femurs, tibiaes, and pelvic bones of 12–13 week old untreated (n = 5) and αCD42b-treated (n = 4) mice. Dots represent individual mice and lines represent mean ± s.e.m. BM cellularity was not significantly different, whereas BM MkP cell number was significantly increased after αCD42b treatment (**P = 1.59 × 10−2); two-tailed Mann-Whitney test. Source data

Similar articles

Cited by

References

    1. Bryder D, Rossi DJ, Weissman IL. Hematopoietic stem cells: the paradigmatic tissue-specific stem cell. Am. J. Pathol. 2006;169:338–346. doi: 10.2353/ajpath.2006.060312. - DOI - PMC - PubMed
    1. Sender R, Milo R. The distribution of cellular turnover in the human body. Nat. Med. 2021;27:45–48. doi: 10.1038/s41591-020-01182-9. - DOI - PubMed
    1. Jacobsen SEW, Nerlov C. Haematopoiesis in the era of advanced single-cell technologies. Nat. Cell Biol. 2019;21:2–8. doi: 10.1038/s41556-018-0227-8. - DOI - PubMed
    1. Leader A, Hofstetter L, Spectre G. Challenges and advances in managing thrombocytopenic cancer patients. J. Clin. Med. 2021;10:1169. doi: 10.3390/jcm10061169. - DOI - PMC - PubMed
    1. Scridon A. Platelets and their role in hemostasis and thrombosis—from physiology to pathophysiology and therapeutic implications. Int. J. Mol. Sci. 2022;23:12772. doi: 10.3390/ijms232112772. - DOI - PMC - PubMed