. 2024 Jun;56(6):1203-1212.
doi: 10.1038/s41588-024-01767-x. Epub 2024 May 30.

Systematic assessment of ISWI subunits shows that NURF creates local accessibility for CTCF

Affiliations

Systematic assessment of ISWI subunits shows that NURF creates local accessibility for CTCF

Mario Iurlaro et al. Nat Genet. 2024 Jun.

Erratum in

Abstract

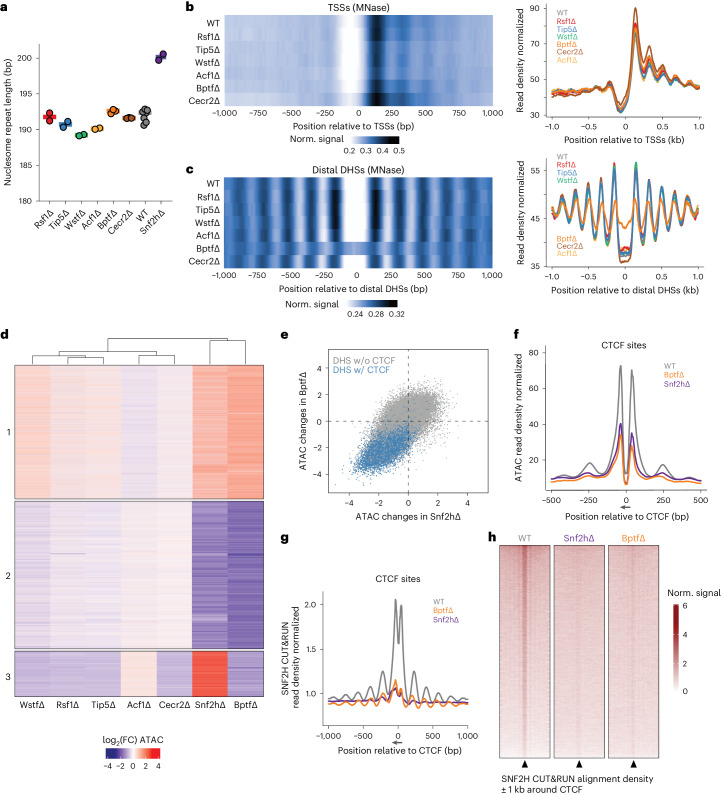
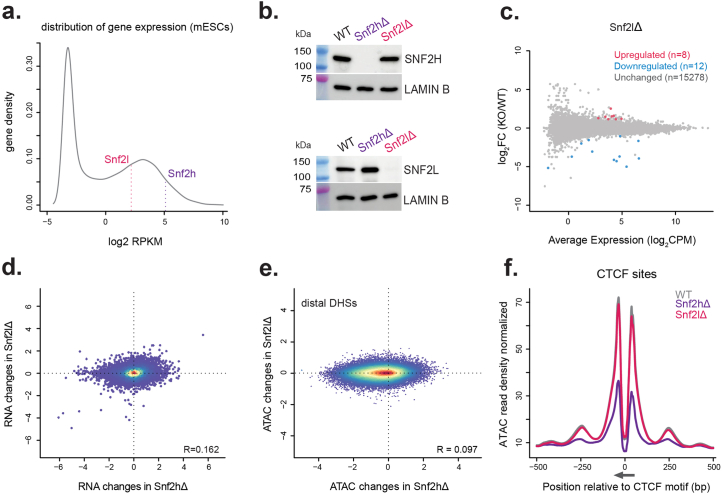
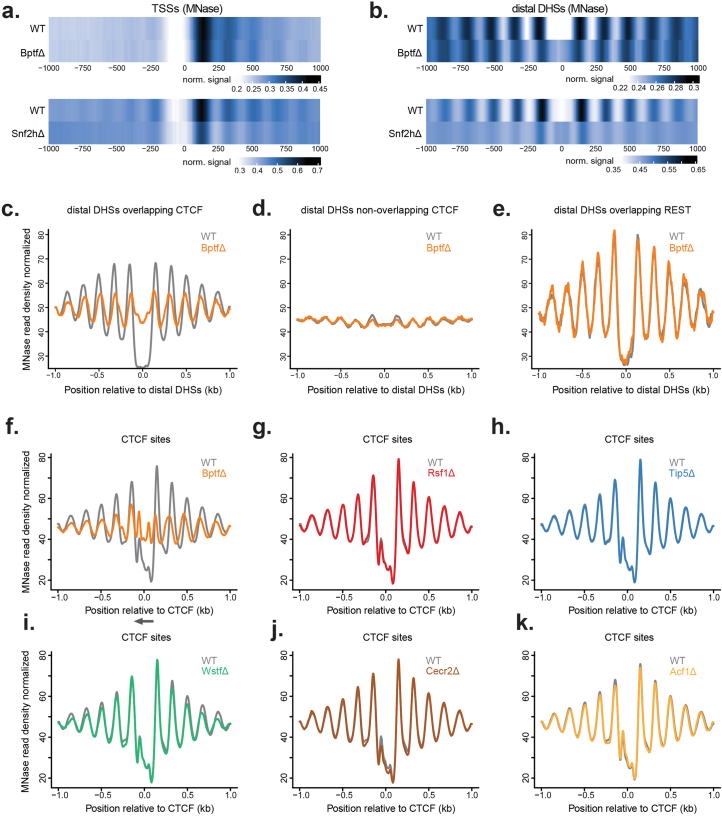
Catalytic activity of the imitation switch (ISWI) family of remodelers is critical for nucleosomal organization and DNA binding of certain transcription factors, including the insulator protein CTCF. Here we define the contribution of individual subcomplexes by deriving a panel of isogenic mouse stem cell lines, each lacking one of six ISWI accessory subunits. Individual deletions of subunits of either CERF, RSF, ACF, WICH or NoRC subcomplexes only moderately affect the chromatin landscape, while removal of the NURF-specific subunit BPTF leads to a strong reduction in chromatin accessibility and SNF2H ATPase localization around CTCF sites. This affects adjacent nucleosome occupancy and CTCF binding. At a group of sites with reduced chromatin accessibility, CTCF binding persists but cohesin occupancy is reduced, resulting in decreased insulation. These results suggest that CTCF binding can be separated from its function as an insulator in nuclear organization and identify a specific role for NURF in mediating SNF2H localization and chromatin opening at bound CTCF sites.


Conflict of interest statement

The authors declare no competing interests.

Figures

Fig. 1
Fig. 1. Comprehensive deletion and transcriptome analysis of ISWI subunits in mESCs.
a, MS quantification of proteins co-immunoprecipitated using an anti-SNF2H antibody in WT and Snf2h∆ cells. Highlighted in red are proteins with P < 0.01 and log2(FC) (WT/Snf2h∆) > 1. Only the names of ISWI subunits are shown. Statistical significance was calculated using a two-sided t-test with Benjamini–Hochberg correction for multiple comparisons (Methods). b, Western blot for ISWI subunits and controls (LAMIN B, CTCF) in all deletion cell lines and WT control. While the deletions show overall no effect on other subunits, we note a change in band stoichiometry for CECR2, ACF1 and BPTF in some of the mutant lines. Blots are representative of at least two experiments. c. Number of DEGs (Methods) upon deletion of ISWI subunits, upregulated in red and downregulated in blue. d, Heatmap of DEGs shown as log2(FC) with respect to parental cell line control. DEGs are clustered based on expression changes, with cluster numbering indicated on the left. Source data
Fig. 2
Fig. 2. Genome-wide nucleosome position and accessibility profiling identifies subcomplex-specific chromatin functions.
a, Average NRL for each generated deletion cell line, for SNF2H deleted line (data from ref. ) and parental line control, as measured by MNase-seq. Shaded bar represents median value of multiple replicates. b,c, Average nucleosomal profile at TSSs (b) or distal DHSs (c) shown as heatmap (left) and profile plot (right). d, Heatmap displaying log2(FC) of ATAC–seq signal at differentially accessible regions for each deletion cell line with respect to parental line control. Regions are clustered based on accessibility changes. Each cluster contains 36,386, 40,166 and 12,426 sites, respectively, for clusters 1, 2 and 3. Cluster numbers are reported on the left. e, Quantitative comparison of chromatin accessibility changes (log2(FC) over parental control) in Snf2h∆ (x axis) and Bptf∆ (y axis) at DHSs. DHSs containing a CTCF motif are highlighted in blue. f, Average ATAC–seq signal at bound CTCF motifs in WT control (gray), Bptf∆ (orange) and Snf2h∆ (purple) cells. Canonical motif orientation (5′–3′) indicated by the arrow. g, Average SNF2H CUT&RUN signal at bound CTCF motifs (as in f) in WT control (gray), Bptf∆ (orange) and Snf2h∆ (purple) cells. Canonical motif orientation (5′–3′) indicated by the arrow. h, SNF2H CUT&RUN alignment densities in WT, Snf2h∆ and Bptf∆ cells, centered on CTCF-bound motifs (black arrowheads).
Fig. 3
Fig. 3. CTCF binding at strong motifs largely persists in the absence of BPTF despite loss of accessibility.
a, Average CTCF ChIP–seq signal at bound CTCF sites in Bptf∆ (orange) and parental ES cells (gray; top). The same analysis is in Snf2h∆ (purple) and parental ES cells (gray; bottom; data from ref. ). Inputs are shown as control (blue). Canonical motif orientation (5′–3′) indicated by the arrow. b, Representative genomic loci illustrating changes in CTCF binding (ChIP–seq indicated by shades of red) and chromatin accessibility (ATAC–seq indicated by shades of blue) in Bptf∆, Snf2h∆ and parental ES cells. c, Average SMF signal at an unbound site (left) and at the same sites (as in b; right), in BPTF-deleted cells (orange) and WT control (gray). Shaded line represents s.d. d, A CNN-based model used to predict changes in CTCF binding in Bptf∆ cells. Influence of particular nucleotides is shown as average contribution scores, highlighting the role of an extended CTCF motif (M1 and M2) in retaining binding in the absence of BPTF. Canonical motif orientation (5′–3′) indicated by the arrow.
Fig. 4
Fig. 4. Unsupervised clustering highlights differential responses to the absence of BPTF at the level of CTCF binding, chromatin opening and nuclear organization.
a, Boxplot displaying changes upon loss of BPTF or SNF2H in CTCF ChIP–seq and ATAC–seq signal at all bound CTCF sites, expressed as log2(FC) in respect to WT control cells. Measurements are shown for all sites (left) and separately for clusters 1–5. Black lines indicate median, boxes indicate first and third quartiles, and whiskers indicate maximum and minimum values of distribution after the removal of outliers. b, Distribution of chromatin states at sites surrounding bound CTCF motifs, as labeled by chromHMM (Methods) and split by clusters (as in a). Cluster numbers reported on top. c, Changes in observed/expected interactions at TADs (identified in ref. mESCs dataset) following BPTF depletion, SNF2H depletion (data from ref. ) and CTCF auxin-mediated degradation for 48 h (data from ref. ), measured using Hi-C (ratios over respective controls are reported), at 10 kb resolution. d, Same analysis as in c at TAD boundaries (identified in ref. mESCs dataset). e, Same analysis as in c and d at Hi-C loops. f, Changes in observed/expected interactions at CTCF sites divided by clusters (as in a) following BPTF depletion, SNF2H depletion and CTCF auxin-mediated degradation (48 h), measured using Hi-C (ratios over respective controls are reported). Cluster number is reported on the left. Canonical motif orientation (5′–3′) indicated by the arrow.
Fig. 5
Fig. 5. BPTF-dependent accessibility impacts nuclear organization, localization of cohesin and the cohesin-release factor WAPL despite persistent CTCF binding.
a, Boxplot (as in Fig. 4a) summarizing changes in CTCF ChIP–seq and ATAC–seq signal for CTCF sites that retain binding upon loss of BPTF, expressed as log2(FC) in respect to WT control cells. Measurements are shown for all sites that retain binding (left) and divided into groups 1–4 based on their accessibility changes upon loss of BPTF. b, Changes in observed/expected interactions at CTCF sites not changing in binding divided by group (as in a) following BPTF depletion, SNF2H depletion and CTCF auxin-mediated degradation (48 h), measured using Hi-C (ratios over respective controls are reported), at 10 kb resolution. Canonical motif orientation (5′–3′) indicated by the arrow. c, Average ChIP–seq signal for RAD21 (top) and WAPL (bottom), at CTCF sites that retain binding, grouped by changes in chromatin accessibility (as in a). Canonical motif orientation (5′–3′) indicated by the arrow.
Extended Data Fig. 1
Extended Data Fig. 1. In contrast to SNF2H, deletion of SNF2L causes minor effects at the level of gene expression and chromatin accessibility in mES cells.
a. Gene expression (log2 RPKM) distribution in WT mES cells. Expression level of Snf2l and Snf2h are highlighted. b. Western blot detection of SNF2H and SNF2L (upper and lower blot, respectively) protein levels in WT and deletion lines. Blots are representative of two independent experiments. c. RNA changes in SNF2L deletion line are shown as MA plot. Differentially expressed genes (Methods) are reported. d. RNA changes in SNF2L deleted line (y axis) vs SNF2H deleted line (x axis) are shown as density scatter plot. e. ATAC changes in SNF2L deleted line (y axis) vs SNF2H deletion line (x axis) are shown as density scatter plot. f. Average ATAC signal at CTCF-bound sites in WT, Snf2lΔ and Snf2hΔ cells. Canonical motif orientation (5′ to 3′) indicated by the arrow. Source data
Extended Data Fig. 2
Extended Data Fig. 2. ISWI accessory subunit deletions are subcomplex-specific, and their transcriptional response shows a similarity between loss of BPTF and loss of SNF2H.
a. SNF2H co-immunoprecipitations followed by western blot against ISWI subunits in WT and ISWI deletion lines as indicated. Blots for detection of BPTF and SNF2H are representative of at least two experiments. Blots for the detection of all other proteins have not been repeated. b. Expression of several pluripotency markers (log2 RPKM) in WT and ISWI deletion lines. c. RNA changes in the generated deletion lines are shown as MA plots. Differentially expressed genes are shown as blue (downregulated) and red (upregulated) dots. d. Quantitative comparison of RNA changes (log2FC) upon deletion of accessory subunits (x-axis) versus SNF2H deletion (y-axis). R: Pearson’s correlation coefficient. e. Heatmap of Pearson’s correlation of transcriptional changes induced by each deletion. Correlation was calculated on log2 fold change data of genes called as differentially expressed in at least one contrast. f. Principal component analysis of transcriptional changes induced by each ISWI deletion. PCA was performed on log2 fold change data of genes called as differentially expressed in at least one contrast. Source data
Extended Data Fig. 3
Extended Data Fig. 3. Nucleosome profiling reveals a BPTF-specific response at CTCF sites.
a,b. Average nucleosomal profiles at transcription start sites (TSSs, a) or distal DNAseI hypersensitive sites (distal DHSs, b) shown as heatmap for BptfΔ and Snf2hΔ cells with respective controls (Snf2hΔ and associated WT data taken from ref. ). c. MNase average signal at distal DNaseI hypersensitive sites bound by CTCF in WT and BptfΔ cells. d. Same analysis (as in c) for distal DNaseI hypersensitive sites not bound by CTCF e. Same analysis (as in c and d) at distal DNaseI hypersensitive sites bound by REST. fk. MNase average signal at CTCF sites in WT and all deletion lines. Canonical motif orientation (5′ to 3′) indicated by the arrow.
Extended Data Fig. 4
Extended Data Fig. 4. BPTF deletion displays loss of chromatin accessibility specifically at CTCF sites.
a. Heatmap showing Pearson’s correlations of chromatin accessibility changes induced by each deletion. Correlation was calculated on log2 fold change ATAC-seq signal on peaks called as differentially accessible in at least one contrast. b. Enrichment of chromatin marks and chromatin-associated factors in clusters with differential accessibility response (regions and clusters as in Fig. 2d, cluster number reported on the left). c. Motif enrichment analysis over the same clusters (as in Fig. 2d). Adjusted p-value calculated through a one-sided Fisher’s exact test with Benjamini–Hochberg multiple testing correction. d. Average ATAC-seq signal at bound CTCF sites in WT and individual deletion lines. Canonical motif orientation (5′ to 3′) indicated by the arrow.
Extended Data Fig. 5
Extended Data Fig. 5. Absence of BPTF affects SNF2H localization at CTCF sites.
a. Detection of BPTF by ChIP–seq at distal bound CTCF sites shown as average signal for WT (gray) and BptfΔ (orange). Input signal is shown in blue. Canonical motif orientation 5′–3′ indicated by the arrow. b. Same analysis as in a for bound CTCF sites within ±500 bp from annotated promoters. c. CUT&RUN signal for SNF2H in WT, Snf2hΔ and BptfΔ cells, shown as alignment densities centered on bound CTCF motifs (black arrowhead). IgG signal is shown for each background as negative control. d. SNF2H CUT&RUN average signal at bound CTCF sites for WT, BptfΔ, Snf2hΔ and IgG. e. Boxplot (as in Fig. 4a) showing SNF2H CUT&RUN signal (log2 fold change over IgG control) for WT (gray), BptfΔ (orange), Snf2hΔ (purple) at bound CTCF sites grouped by ATAC changes in BptfΔ. Groups are displayed from left to right starting with regions with stronger ATAC loss on the left (n= number of sites in each group, range of ATAC changes in each group is reported in the x-axis). f. Detection of SNF2H by CUT&RUN at distal DNaseI hypersensitive sites that do not overlap with CTCF motifs shown as average signal for WT (gray), BptfΔ (orange), Snf2hΔ (purple). IgG signal is shown in blue as negative control. CTCF sites are excluded to illustrate consistent binding of SNF2H in WT and BptfΔ lines outside of CTCF-bound sites. g. Boxplots (as in Fig. 4a) showing SNF2H CUT&RUN signal (log2 fold change over IgG control) for WT (gray), BptfΔ (orange), Snf2hΔ (purple) at distal DNaseI hypersensitive regions not overlapping with CTCF sites (left) and at bound CTCF sites (right), illustrating specific reduction in SNF2H signal over CTCF sites in the BptfΔ line. Significance between WT and Bptf∆ conditions was calculated by a one-sided Wilcoxon signed-rank test.
Extended Data Fig. 6
Extended Data Fig. 6. CTCF binding largely persists in absence of BPTF but coincides with changes in nucleosome organization.
a. Quantitative comparison of CTCF binding (log2 enrichment measured in IP/input) in WT cells (x-axis) vs BptfΔ (up) or Snf2hΔ (down) (y-axis), illustrating persistent CTCF binding in BptfΔ versus the strong reduction in Snf2hΔ. R: Pearson’s correlation coefficient. b. Average CTCF ChIP–seq signal in WT and BPTF-depleted cells (inputs reported as control). CTCF sites have been divided based on their changes in binding upon BPTF depletion—in sites that gain binding (defined as regions with a log2FC over WT equal to or higher than 0.25), unchanged sites (log2FC over WT lower than 0.25 and higher than −0.25), sites with partial loss of binding (log2FC over WT equal to or lower than −0.25 and higher than −1) and sites with strong loss of binding (log2FC over WT lower than −1). Canonical motif orientation 5′–3′ indicated by the arrow. c. Single loci representative of regions with strong accessibility loss but unchanged CTCF binding upon BPTF deletion. ChIP signal is shown in shades of red for WT, BptfΔ and Snf2hΔ. ATAC signal is reported in shades of blue for the same lines. d. Single-molecule footprinting signal in WT and BPTF-depleted cells for the same sites shown in c. Shaded line represents standard deviation, red square indicates CTCF motif. e. V-plots representing standardized MNase data are shown as a function of fragment size on the y-axis and fragment midpoint position on the x-axis at bound CTCF sites in WT (left) and BptfΔ (right), highlighting relative accumulation of longer MNase fragments (>200 bp) spanning CTCF-bound sites upon deletion of BPTF.
Extended Data Fig. 7
Extended Data Fig. 7. Deep learning identifies CTCF motif features enriched at sites of persistent binding in absence of NURF.
a. CTCF sites were grouped based on changes in CTCF binding in BptfΔ versus WT. For each group, the binding strength in WT cells is shown as violin plots with median (black line). n = number of CTCF sites within each group. Range of CTCF binding changes in each group is reported in the x-axis. b. Same groups (as in a) but now showing CTCF motif score (canonical motif M1 log-odds score) as violin plots with median (black line). Illustrating a trend for higher motif scores in sites with persistent CTCF binding in absence of BPTF. c. Plots of loss (mean squared error, top) and the mean absolute error (bottom) metrics at each training epoch step for the training (red line) and validation sets (blue line). The dotted line indicates the selected epoch with the minimum validation loss. d. Scatter plot showing the observed vs predicted CTCF ChIP–seq log2 fold change in Bptf∆ compared to WT for the training (top) and the test set from held-out chromosomes (bottom). Rp indicates the Pearson correlation coefficient. e. Position weight matrix logos were generated in bits for the CTCF sites with the highest (n = 1000, top) and lowest (n = 1000, bottom) contribution scores calculated from the deep learning model. Sequence logos were created independently for M1 (left) and M2 (right) motifs. Canonical motif orientation 5′–3′ indicated by the arrow. f. Fraction of CTCF sites containing an M2 motif (as defined in ref. ) and grouped (as in a and b by CTCF changes in BptfΔ), illustrating the increased presence of M2 at sites with persistent CTCF binding in absence of BPTF.
Extended Data Fig. 8
Extended Data Fig. 8. Comparison of 3D genome changes upon BPTF, SNF2H or CTCF depletion.
a. Heatmap showing log2 fold-changes in CTCF binding (ChIP–seq) and accessibility (ATAC-seq) upon BPTF deletion at clustered bound CTCF sites (as in Fig. 4a). Cluster numbers reported on the left. b. CTCF binding (ChIP–seq) and chromatin accessibility (ATAC-seq) signal at clustered bound CTCF sites (as in a), in WT, BptfΔ and Snf2hΔ cells. Cluster numbers are reported on the left. c. Changes in insulation score at TAD boundaries (boundaries identified in ref. mESCs dataset) in BptfΔ vs WT (orange). Changes between replicates in WT condition are reported as control (blue). Two-sided Wilcoxon test p-value is reported. d. Scatter plots reporting insulation score at TAD boundaries in controls (x axis) and BptfΔ, Snf2hΔ and CTCF depleted cells (y axis). e. Compartment signal (first eigenvector values) for WT and BptfΔ cells. f. Mean observed/expected contact frequency measured using Hi-C at TADs in BptfΔ, Snf2hΔ and CTCF depleted cells (48 h) and their respective controls. g. Same as f at TAD boundaries. h. Same as f and g at Hi-C loops.
Extended Data Fig. 9
Extended Data Fig. 9. NURF-dependent accessibility and binding loss relate to loss of long-range chromatin interactions.
a. Mean observed/expected contact frequency measured using Hi-C at CTCF sites split by the same clusters as in Fig. 4a (cluster number on the left) in BptfΔ, Snf2hΔ and CTCF depleted cells (48 h) and their respective controls, at 10 kb resolution. b. Changes in observed/expected contact frequency measured by Hi-C at CTCF sites split by clusters as in a (cluster number on the left). CTCF sites are split into sites overlapping all candidate cis-regulatory elements (cCREs defined as in ref. ) (‘All’, first panel from the left), CTCF sites overlapping cCREs with distal enhancer-like features (‘dELS,CTCF-bound’, second panel from the left), CTCF sites overlapping cCREs with only CTCF bound (‘CTCF-only, CTCF-bound’, third panel from the left).
Extended Data Fig. 10
Extended Data Fig. 10. NURF-mediated accessibility loss relates to loss of long-range chromatin interactions.
a. CTCF binding (ChIP–seq) and chromatin accessibility (ATAC-seq) signal in WT and BptfΔ cells within the four groups defined (as in Fig. 5a). Group number reported on the left. b. Mean observed/expected contact frequency measured using Hi-C at CTCF split into the same groups as in Fig. 5a (group number on the left) in BptfΔ, Snf2hΔ and CTCF depleted cells (48 h) and their respective controls, at 10 kb resolution. Canonical motif orientation 5′–3′ indicated by the arrow. c. Hi-C heatmap at a representative locus illustrating loss of 3D contacts in BptfΔ, Snf2hΔ and CTCF depleted cells (48 h) in comparison to their controls, at 25 kb resolution. The black arrows indicate a CTCF site showing loss of accessibility and 3D contacts despite persistent binding. Gene annotations and CTCF ChIP–seq tracks are shown below for reference; for the Snf2hΔ and CTCF depletion conditions, single replicates of ChIP–seq data are shown (data from refs. ,). d. CTCF ChIP and accessibility in the 2 kb region flanking the CTCF site highlighted in c. e. MA plot reporting variation in RNA in BptfΔ (y axis) vs average read counts (x axis). Ctcf, Rad21 and cohesin complex components and regulators are highlighted to show their RNA variations upon BPTF depletion. f. Protein levels of RAD21 quantified by western blotting in WT and BptfΔ cells. Blot is representative of three experiments. Source data

References

    1. Clapier, C. R. & Cairns, B. R. The biology of chromatin remodeling complexes. Annu. Rev. Biochem.78, 273–304 (2009). - PubMed
    1. Zhu, F. et al. The interaction landscape between transcription factors and the nucleosome. Nature562, 76–81 (2018). - PMC - PubMed
    1. Bell, O., Tiwari, V. K., Thomä, N. H. & Schübeler, D. Determinants and dynamics of genome accessibility. Nat. Rev. Genet.12, 554–564 (2011). - PubMed
    1. Corona, D. F. & Tamkun, J. W. Multiple roles for ISWI in transcription, chromosome organization and DNA replication. Biochim. Biophys. Acta1677, 113–119 (2004). - PubMed
    1. Erdel, F. & Rippe, K. Chromatin remodelling in mammalian cells by ISWI-type complexes—where, when and why? FEBS J.278, 3608–3618 (2011). - PubMed

MeSH terms