. 2024 Jul;43(14):2878-2907.
doi: 10.1038/s44318-024-00133-1. Epub 2024 May 30.

IL-27 maintains cytotoxic Ly6C+ γδ T cells that arise from immature precursors

Affiliations

IL-27 maintains cytotoxic Ly6C+ γδ T cells that arise from immature precursors

Robert Wiesheu et al. EMBO J. 2024 Jul.

Abstract

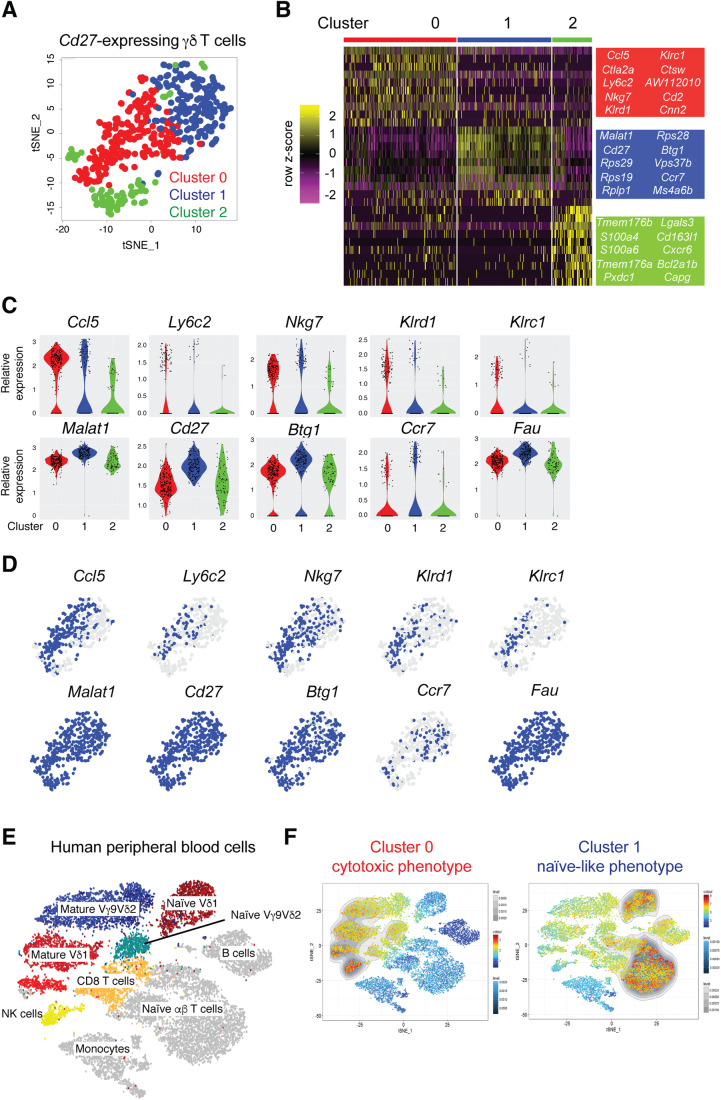
In mice, γδ-T lymphocytes that express the co-stimulatory molecule, CD27, are committed to the IFNγ-producing lineage during thymic development. In the periphery, these cells play a critical role in host defense and anti-tumor immunity. Unlike αβ-T cells that rely on MHC-presented peptides to drive their terminal differentiation, it is unclear whether MHC-unrestricted γδ-T cells undergo further functional maturation after exiting the thymus. Here, we provide evidence of phenotypic and functional diversity within peripheral IFNγ-producing γδ T cells. We found that CD27+ Ly6C- cells convert into CD27+Ly6C+ cells, and these CD27+Ly6C+ cells control cancer progression in mice, while the CD27+Ly6C- cells cannot. The gene signatures of these two subsets were highly analogous to human immature and mature γδ-T cells, indicative of conservation across species. We show that IL-27 supports the cytotoxic phenotype and function of mouse CD27+Ly6C+ cells and human Vδ2+ cells, while IL-27 is dispensable for mouse CD27+Ly6C- cell and human Vδ1+ cell functions. These data reveal increased complexity within IFNγ-producing γδ-T cells, comprising immature and terminally differentiated subsets, that offer new insights into unconventional T-cell biology.

Keywords: Cancer; Differentiation; IL-27; Innate; γδ T Cells.


Conflict of interest statement

The authors declare no competing interests.

Figures

Figure 1
Figure 1. Mouse IFNγ-producing γδ T cells consist of two populations that are phenotypically similar to human γδ T cells.
(A) t-SNE visualization of 458 individual lung CD27+ γδ T cells color-coded by cluster. (B) Heatmap of the top ten genes from each of the three clusters identified in (A), where each column represents the gene expression profile of a single cell. Gene expression is color-coded with a scale based on z-score distribution, from low (purple) to high (yellow). (C) Violin plots showing expression levels of selected genes from the clusters identified in (A) (n = 177 cells Cluster 0, 209 cells Cluster 1, 72 cells Cluster 2). (D) Feature plots of the same genes shown in (C), depicting expression levels by cell. Blue indicates high expression, and gray indicates no expression. (E) t-SNE visualization of a human scRNAseq dataset containing 2 × 104 PBMCs from three individual healthy donors (Pizzolato et al, 2019). Clusters are coded by different colors and labeled by cell type. (F) Gene signatures from Cluster 0 (left panel) and Cluster 1 (right panel) displayed on the t-SNE map from (E) by Single-Cell Signature Viewer. The colored scales represent the degree of transcriptional similarity where red indicates high similarity and dark blue indicates low similarity. The grayscale represents the density distribution of similarity scores.
Figure 2
Figure 2. Ly6C defines a subset of mature CD27+ γδ T cells in mice.
(A) Dot plots of Ly6C and CCR7 staining. Viable mouse lung γδ T single cells were gated on CD3+ and TCRδ+ cells, followed by CD27+ cells. (B) Frequency of CCR7+ and Ly6C+ cells among CD27+ γδ T cells in the spleen, LN and lung (n = 7 mice/group). (C) Frequency of CD27+Ly6C or CD27+Ly6C+ cells expressing CD160, NKG2A, NKp46 or IFNγ in indicated tissue (n = 4 mice/group). (D) Dot plot of Ly6C and T-bet-AmCyan expression in LN after gating on CD27+ γδ T cells. Frequency of T-bet expression in CD27+Ly6C or CD27+Ly6C+ cells in LN and lung (n = 4 mice/group). (E) Frequency of CD44 expression in CD27+Ly6C or CD27+Ly6C+ cells (n = 4 mice/group). (F) Frequency of Ly6C+ cells among CD27+ γδ T cells in indicated tissue at various time points (n = 4 mice/group). Data information: All data are represented as mean ± SD. P values were calculated by repeated measures of one-way ANOVA followed by Tukey’s posthoc test (B), paired t test (CE), one-way ANOVA followed by Tukey’s posthoc test (F). *P < 0.05, **P < 0.01, ***P < 0.001.
Figure 3
Figure 3. Distinct TCR-expressing CD27+ γδ T-cell subsets exhibit phenotypic differences based on their Ly6C expression status.
(A) Frequency of Ly6C+ cells among CD27+Vγ1+, CD27+Vγ4+, and CD27+Vγ1Vγ4 cells in indicated tissue (n = 3 female FVB/n mice/group). (B) Proportion of Vγ1+, Vγ4+, and Vγ1Vγ4 cells within CD27+Ly6C or CD27+Ly6C+ cells in indicated tissue (n = 3 female FVB/n mice/group). (C) The proportion of Vγ1+, Vγ4+, and Vγ1Vγ4 cells within total CD27+ γδ T cells in indicated tissue (n = 3 female FVB/n mice/group). Data information: All data are represented as mean ± SD. P values were calculated by repeated measures one-way ANOVA followed by Tukey’s post hoc test (A), paired t test (B, C). ns not significant, *P < 0.05, **P < 0.01. (D, E) PCA analysis of RNA-seq data from sorted CD27+Vγ1+Ly6C, CD27+Vγ1+Ly6C+, CD27+Vγ4+Ly6C, and CD27+Vγ4+Ly6C+ cells isolated spleen and LNs of C57BL/6 mice. Each dot represents cells pooled from ten mice. Dots are colored to distinguish TCR usage in (D) or Ly6C status in (E). (F) Volcano plot representation of a comparison between the transcriptomes of CD27+Vγ1+Ly6C cells and CD27+Vγ4+Ly6C cells. Differentially expressed genes are denoted by blue if enriched in CD27+Vγ1+Ly6C cells and, red if enriched in CD27+Vγ4+Ly6C cells, whereas genes with similar expression levels are denoted in gray. Differentially expressed genes were calculated by a moderated t test using the limma package. (G) Volcano plot representation of a comparison between the transcriptomes of CD27+Vγ1+Ly6C+ cells and CD27+Vγ4+Ly6C+ cells. Differentially expressed genes are denoted by blue if enriched in CD27+Vγ1+Ly6C cells and, red if enriched in CD27+Vγ4+Ly6C cells, whereas genes with similar expression levels are denoted in gray. Differentially expressed genes were calculated by a moderated t test using the limma package. (H) Heatmap showing z-score normalized expression of selected genes in CD27+Vγ1+Ly6C+, CD27+Vγ4+Ly6C+, CD27+Vγ1+Ly6C, and CD27+Vγ4+Ly6C cells, which is color-coded with a scale based on z-score distribution, from −4 (blue) to 4 (red).
Figure 4
Figure 4. CD27+Ly6C+ γδ T cells are functionally superior at killing cancer cells than CD27+Ly6C γδ T cells.
(A) Growth of individually sorted Ly6C and Ly6C+ cells over 4 days. Each dot is mean of 3 biological replicates from pooled LNs and spleens of 6 FVB/n WT mice per biological replicate. (B) Fold change in expansion of Ly6C and Ly6C+ cells over 4 days (n = 6 cultures of pooled cells from LNs and spleens of 6 mice). (C) Proliferation of Ly6C and Ly6C+ cells over 4 days as determined by CFSE staining (n = 4 cultures of pooled cells from LNs and spleens of 6 mice). (D) Frequency of live cells in expanded Ly6C and Ly6C+ cells over 4 days (n = 4 cultures of pooled cells from LNs and spleens of 6 mice). (E) Proportion and median fluorescence intensity (MFI) of Ly6C in expanded Ly6C and Ly6C+ cells over 4 days (n = 3 cultures of pooled cells from LNs and spleens of 6 mice). (F) Frequency of CD160, NKG2A, NKp46 or IFNγ expression in expanded Ly6C and Ly6C+ cells over 4 days (n = 3 cultures of pooled cells from LNs and spleens of 6 mice). (G) Proportion of dead KP (n = 4), KB1P (n = 4), or E0771 (n = 3) mammary cancer cells after co-culture with expanded Ly6C and Ly6C+ cells for 24 h at an effector:target ratio of 10:1. Data information: All data are represented as mean ± SD. P values were calculated by two-way repeated measures ANOVA (A) and paired t test (B, DG). *P < 0.05, **P < 0.01, ***P < 0.001. (H) Schematic of experimental setup where expanded naive, splenic CD8+ T cells, CD27+Ly6C γδ T cells, or CD27+Ly6C+ γδ T cells were adoptively transferred into E0771-bearing Tcrd−/− mice on 4 separate occasions. The experiment was terminated when tumors reached 200 mm2. (I) Waterfall plot of percentage change in tumor volume from tumor size at day 10 post cancer cell injection to day 15, after mice had received two injections of indicated T cells (n = 6 PBS, CD8, Ly6C+, n = 5 Ly6C). (J) Tumor growth curves for each group (n = 6 PBS, CD8, Ly6C+, n = 5 Ly6C). (K) Kaplan–Meier survival analysis of tumor-bearing mice that received expanded T cells (n = 6 PBS, CD8, Ly6C+, n = 5 Ly6C). *P < 0.05 (log-rank test).
Figure 5
Figure 5. CD27+Ly6C+ γδ T cells are enriched in tumors.
(A) Frequency of Ly6C+ cells among CD27+ γδ T cells in the spleen, LN (pooled axillary, brachial and inguinal representing draining and non-draining tissue), lung and tumor of indicated tumor model (n = 4–7 mice/group). (B) Frequency of CD27+Ly6C or CD27+Ly6C+ cells expressing CD160, NKG2A, NKp46, IFNγ or CD44 in indicated tissue from KP or KB1P tumor models (n = 4 KP, 4–6 KB1P mice/group). (C) Frequency and absolute numbers of CD27+Ly6C or CD27+Ly6C+ cells expressing Ki-67 in LN of WT (n = 4 mice/group) or KB1P tumor-bearing (n = 4 mice/group) mice. *P < 0.05, **P < 0.01 (paired and unpaired t test). (D) Proportion of Vγ1+, Vγ4+, and Vγ1Vγ4 cells within CD27+Ly6C or CD27+Ly6C+ cells in KP or KB1P tumor tissue (n = 6 KP, 5 KB1P mice/group). Data information: All data are represented as mean ±  SD. P values were calculated by repeated measures one-way ANOVA followed by Tukey’s posthoc test (A), paired t test (BD), and unpaired t test (C). *P < 0.05, **P < 0.01, ***P < 0.001.
Figure 6
Figure 6. CD27+Ly6C γδ T cells convert into CD27+Ly6C+ γδ T cells.
(A) Schematic design of experimental method where sorted Ly6C and Ly6C+ γδ T cells were directly injected into NRG-SGM3 mice and were then analyzed after 7 days. (B) Dot plots of Ly6C expression in recovered CD27+ γδ T cells from spleens of NRG-SGM3 mice. (C, D) Frequency of Ly6C+ cells within input cell populations and recovered cells in indicated tissue of NRG-SGM3 mice (n = 3 mice/group). (E, F) Phenotypic analysis of recovered Ly6C and Ly6C+ cells 7 days after injection of Ly6C and Ly6C+ cells into NRG-SGM3 mice showing the frequency of CD160, NKG2A, NKp46 or IFNγ expression in indicated tissue (n = 3 mice/group). (G) Schematic design of experimental method where sorted and expanded Ly6C and Ly6C+ cells were injected into E0771-bearing Tcrd−/− mice at 4 repeated intervals then analyzed when tumors reached 200 mm2. (H) Frequency of Ly6C+ cells within input cell populations and recovered cells in E0771 tumor tissue from Tcrd−/− mice (n = 5 mice/Ly6C group, 6 mice/Ly6C+ group). (I) Total telomere length (per diploid cell in megabases (Mb)) as determined by qPCR of genomic DNA from sorted CD27+Ly6C and CD27+Ly6C+ cells (n = 4 cultured cell pools from LN and spleen of 6 C57BL/6 female mice). Data information: All data are represented as mean ± SD. P values were calculated by paired t test (CF, H, I). *P < 0.05, **P < 0.01, ***P < 0.001.
Figure 7
Figure 7. IL-27 primes CD27+Ly6C+ γδ T cells.
(A) Frequency of Ly6C+ cells in cultured CD27+ γδ T cells after 4 days with CD3/CD28 beads (control) and indicated cytokine stimulation (control n = 20, stimulated n = 3–5 cultured cells from pooled LNs and spleens of 2 mice). (B) Frequency of Ly6C+ cells in sorted Ly6C and Ly6C+ cells treated with CD3/CD28 beads, IL-2, and IL-15 (control), with IL-27 as indicated (n = 8 expanded cells from pooled LNs and spleens of 6 mice). (C) Fold change in expansion of sorted Ly6C and Ly6C+ cells over 4 days treated as indicated (n = 6 replicates from pooled cells from 6 mice). (D) Frequency of IL-27RA+ cells among CD27+Ly6C and CD27+Ly6C+ γδ T cells analyzed by flow cytometry from indicated tissues of FVB/n WT mice (n = 4 mice/group). (E) Frequency of Ly6C+ cells in indicated tissues from C57BL/6 WT (n = 6) or Il27ra−/− (n = 5) mice. (F) Proportion of IFNγ-expressing Ly6C and Ly6C+ cells in indicated tissues from C57BL/6 WT (n = 6) or Il27ra−/− (n = 5) mice. (G) Frequency of Ly6C+ cells within Ly6C and Ly6C+ input cell populations from C57BL/6 WT or Il27ra−/− mice and recovered cells in indicated tissue of NRG-SGM3 mice (n = 3 mice/WT group, n = 5 mice/Il27ra−/− group). (H) Frequency of Ly6C+ cells in E0771 tumor tissue from C57BL/6 WT or Il27ra−/− mice. The proportion of IFNγ-expressing Ly6C and Ly6C+ cells in tumor tissue from C57BL/6 WT or Il27ra−/− mice (n = 7 mice/group). (I) Western blot analysis of indicated proteins in sorted Ly6C and Ly6C+ cells treated with or without IL-27. Actin was used as a loading control, and each corresponding loading control is depicted under the respective blot. (J) Proportion of dead KP (n = 4), KB1P (n = 4), or E0771 (n = 3) mammary cancer cells after 24 h co-culture with expanded Ly6C and Ly6C+ treated with IL-27 as indicated. Data information: All data are represented as mean ± SD. P values were calculated by one-way ANOVA followed by Tukey’s posthoc test (A), paired t test (BD, F, H, J), unpaired t test (EH). *P < 0.05, **P < 0.01, ***P < 0.001, ****P < 0.0001. Source data are available online for this figure.
Figure 8
Figure 8. IL-27 primes human Vδ2 γδ T cells.
Frequency and MFI of indicated proteins in Vδ1 or Vδ2 cells treated with IL-2, and IL-15 (control), and with IL-27 as indicated (n = 4 cells from one healthy human PBMC donor). Data information: All data are represented as mean ± SD. P values were calculated by paired t test. *P < 0.05, **P < 0.01.
Figure EV1
Figure EV1. Expression of cytotoxic markers and TCR usage by CD27+Ly6C and CD27+Ly6C+ γδ T cells.
(A) Flow cytometry plots for expression of indicated proteins in CD27+Ly6C and CD27+Ly6C+ γδ T cells from spleen of naive FVB/n mice. Fluorescence minus one (FMO) controls were used to set gating. (B) Flow cytometry plots of TCR chain usage on CD27+ γδ T cells and Ly6C expression of each population.
Figure EV2
Figure EV2. Phenotyping and cancer cell killing ability of CD27+Ly6C and CD27+Ly6C+ γδ T cells.
(A) Flow cytometry plots of Ly6C expression on sorted CD27+Ly6C and CD27+Ly6C+ γδ T-cell subsets expanded ex vivo over 4 days in the presence of CD3/CD28 Dynabeads, IL-2, and IL-15. (B) Flow cytometry plots for expression of indicated proteins in expanded CD27+Ly6C and CD27+Ly6C+ γδ T cells. Fluorescence minus one (FMO) controls were used to set gating. (C) Representative histograms of cancer cell death measured by DAPI uptake after co-culture with ex vivo-expanded CD27+Ly6C and CD27+Ly6C+ γδ T cells or cisplatin treatment.
Figure EV3
Figure EV3. Ly6C and Ki-67 expression in tumor-associated CD27+Ly6C and CD27+Ly6C+ γδ T cells.
(A) Flow cytometry plots of Ly6C expression on CD27+ γδ T cells in indicated tissue from B16-F1 tumor-bearing mice. (B) Frequency of PD-1+ cells in CD27+Ly6C and CD27+Ly6C+ γδ T cells in indicated tissues of tumor-bearing KP and KB1P mice (n = 3–4). Each dot represents one tumor-bearing mouse. *P < 0.05, **P < 0.01 (paired t test). Data are represented as mean ± SD. (C) Representative flow cytometry plots of PD-1 expression on CD27+Ly6C and CD27+Ly6C+ γδ T cells from lungs of tumor-bearing KP mice. (D) Frequency of CD69+ cells in CD27+Ly6C and CD27+Ly6C+ γδ T cells in indicated tissues of tumor-bearing KP and KB1P mice (n = 3–4). Each dot represents one tumor-bearing mouse. Data are represented as mean ± SD. (E) Representative flow cytometry plots of CD69 expression on CD27+Ly6C and CD27+Ly6C+ γδ T cells from lungs of tumor-bearing KP mice. (F) Flow cytometry plots of Ki-67 expression on CD27+Ly6C and CD27+Ly6C+ γδ T cells from FVB/n WT and KB1P tumor-bearing mice.
Figure EV4
Figure EV4. IL-27 regulates CD27+Ly6C+ γδ T cells.
(A) Flow cytometry plots of Ly6C expression on sorted CD27+Ly6C and CD27+Ly6C+ γδ T-cell subsets expanded ex vivo over 4 days in the presence of CD3/CD28 Dynabeads, IL-2, and IL-15, as well as IL-27 where indicated. (B) Median fluorescence intensity (MFI) of Ly6C expression after gating on Ly6C+ cells within sorted CD27+Ly6C or CD27+Ly6C+ γδ T-cell subsets expanded ex vivo over 4 days with CD3/CD28 beads, IL-2, and IL-15 (control), with IL-27 as indicated. Individual replicates are shown as pairs (n = 8). Each dot represents expanded cells from pooled LNs and spleens of 6 mice. *P < 0.05, **P < 0.01 (paired t test). (C, D) Proportion of CD160, NKG2A, and NKp46-expressing Ly6C and Ly6C+ cells in indicated tissues from C57BL/6 WT (n = 6 tumor-free, 7 tumor-bearing) or Il27ra−/− (n = 5 tumor-free, 7 tumor-bearing) mice. Each dot represents one mouse *P < 0.05, **P < 0.01, ***P < 0.001 (unpaired t test). Each dot represents one mouse. Data are represented as mean ± SD. *P < 0.05 (unpaired or paired student t test). (E) Densitometry graphs representing relative protein expression of indicated phosphorylated (p) STAT proteins after in vitro culture of CD27+Ly6C and CD27+Ly6C+ γδ T cells in the presence or absence of IL-27 from cells from (A). First condition was set to 1 in order to normalize between independent biological replicates (n = 3). Each dot represents one independent in vitro culture from a pool of 6 mice. Data are represented as mean ± SD. *P < 0.05 (repeated measures one-way ANOVA followed by Tukey’s posthoc test). (F) Representative histograms of IL-27RA expression in CD27+Ly6C and CD27+Ly6C+ γδ T cells from lymph node tissue of C57BL/6 WT mice.
Figure EV5
Figure EV5. Human Vδ2 cells respond to IL-27 stimulation.
(A) Flow cytometry plots of Vδ1 and Vδ2 T cells before expansion (left) and after culture for 14 days with IL-2 and IL-15. (B) Fold expansion of human Vδ1 and Vδ2 cells with IL-2 and IL-15 (control) or IL-2, IL-15, and IL-27 (n = 3 human PBMC donors/group). Data are represented as mean ± SD. (C) Flow cytometry plots of ex vivo-expanded cells from (A). Live CD3+ cells were gated on Vδ1 and Vδ2. Expression of CD107a, Granzyme B (GZMB), IFNγ, NKG2A and TNF was measured on Vδ1 and Vδ2 cells for both culture conditions. FMO controls were used to set gating.

References

    1. Baeyens A, Fang V, Chen C, Schwab SR. Exit strategies: S1P signaling and T cell migration. Trends Immunol. 2015;36:778–787. doi: 10.1016/j.it.2015.10.005. - DOI - PMC - PubMed
    1. Barros-Martins J, Schmolka N, Fontinha D, Pires de Miranda M, Simas JP, Brok I, Ferreira C, Veldhoen M, Silva-Santos B, Serre K. Effector γδ T cell differentiation relies on master but not auxiliary Th cell transcription factors. J Immunol. 2016;196:3642–3652. doi: 10.4049/jimmunol.1501921. - DOI - PubMed
    1. Beck BH, Kim HG, Kim H, Samuel S, Liu Z, Shrestha R, Haines H, Zinn K, Lopez RD. Adoptively transferred ex vivo expanded γδ T cells mediate in vivo antitumor activity in preclinical mouse models of breast cancer. Breast Cancer Res Treat. 2010;122:135–144. doi: 10.1007/s10549-009-0527-6. - DOI - PMC - PubMed
    1. Cao G, Wang Q, Li G, Meng Z, Liu H, Tong J, Huang W, Liu Z, Jia Y, Wei J, et al. mTOR inhibition potentiates cytotoxicity of Vγ4 γδ T cells via up-regulating NKG2D and TNF-alpha. J Leukoc Biol. 2016;100:1181–1189. doi: 10.1189/jlb.5A0116-053RR. - DOI - PubMed
    1. Chen L, He W, Kim ST, Tao J, Gao Y, Chi H, Intlekofer AM, Harvey B, Reiner SL, Yin Z, et al. Epigenetic and transcriptional programs lead to default IFN-γ production by γδ T cells. J Immunol. 2007;178:2730–2736. doi: 10.4049/jimmunol.178.5.2730. - DOI - PubMed

MeSH terms

Substances

LinkOut - more resources