. 2024 Jul;5(7):1082-1101.
doi: 10.1038/s43018-024-00782-5. Epub 2024 May 30.

Targeting a lineage-specific PI3Kɣ-Akt signaling module in acute myeloid leukemia using a heterobifunctional degrader molecule

Affiliations

Targeting a lineage-specific PI3Kɣ-Akt signaling module in acute myeloid leukemia using a heterobifunctional degrader molecule

Lois M Kelly et al. Nat Cancer. 2024 Jul.

Abstract

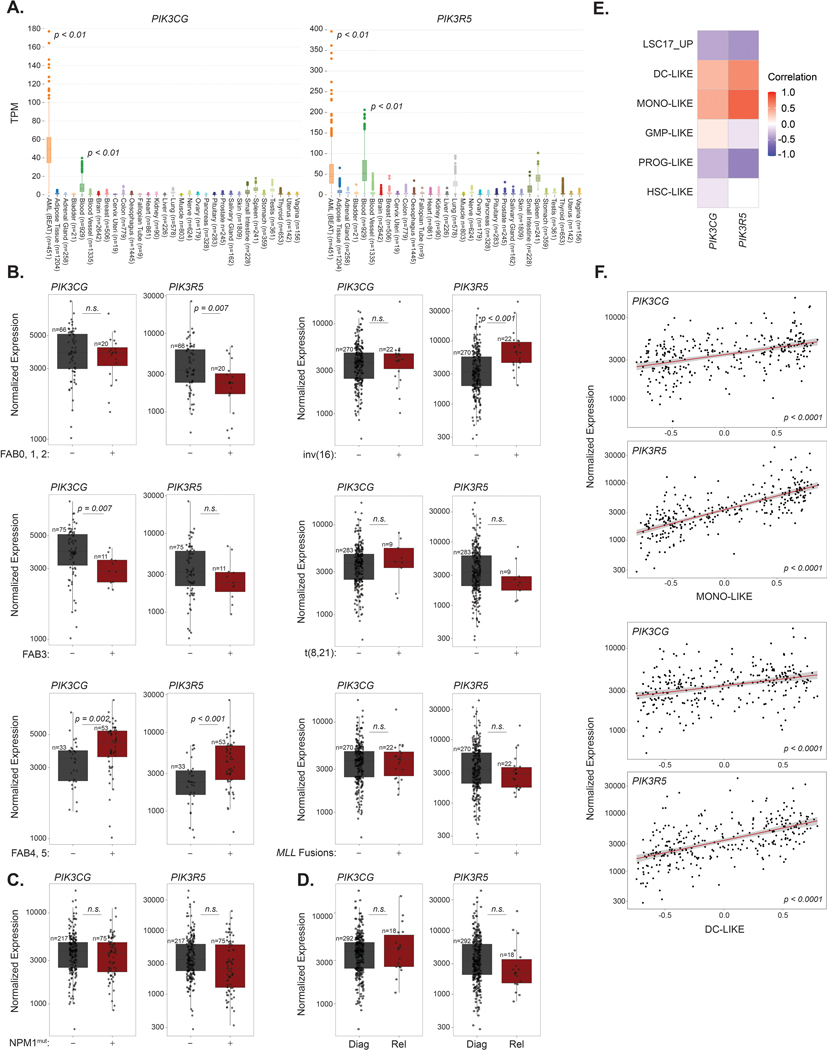
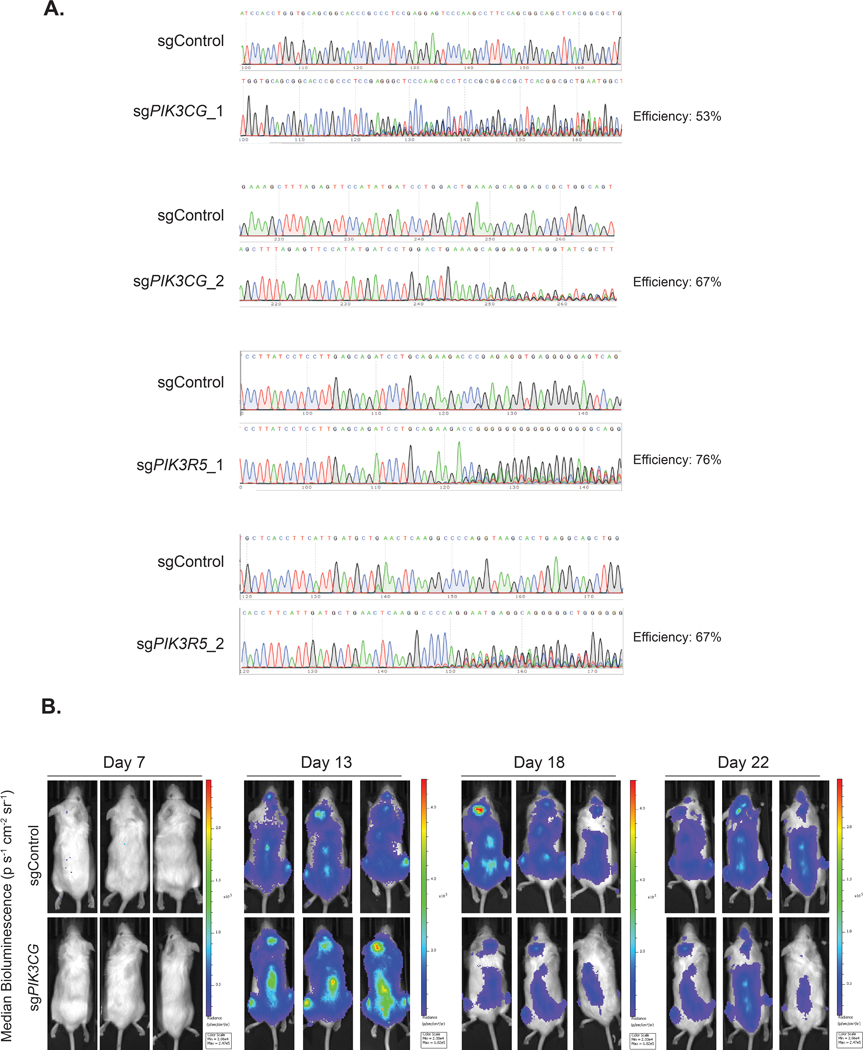
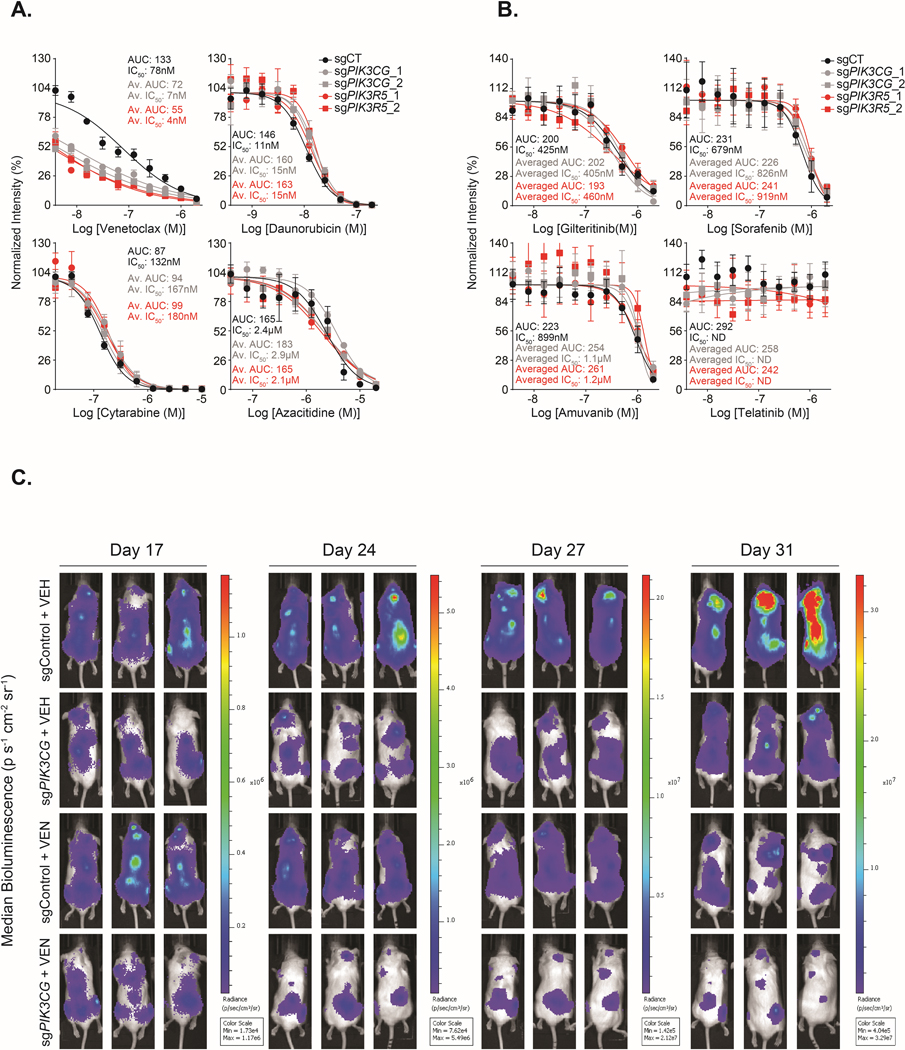
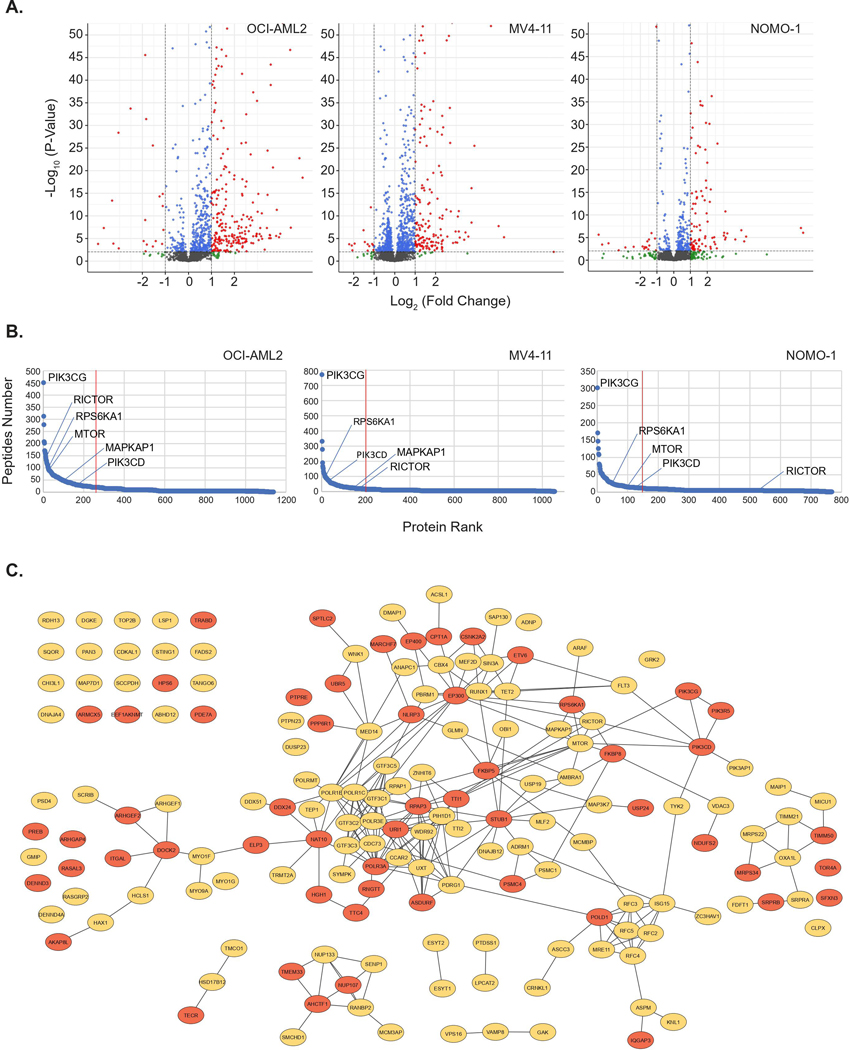
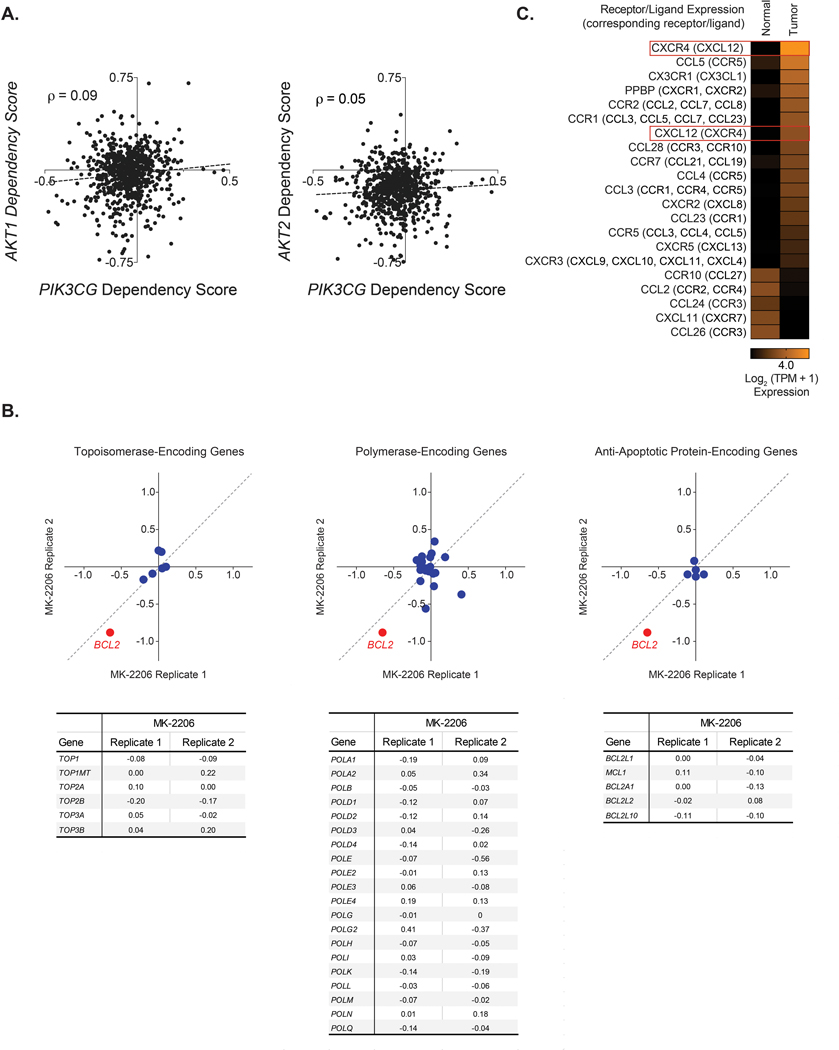
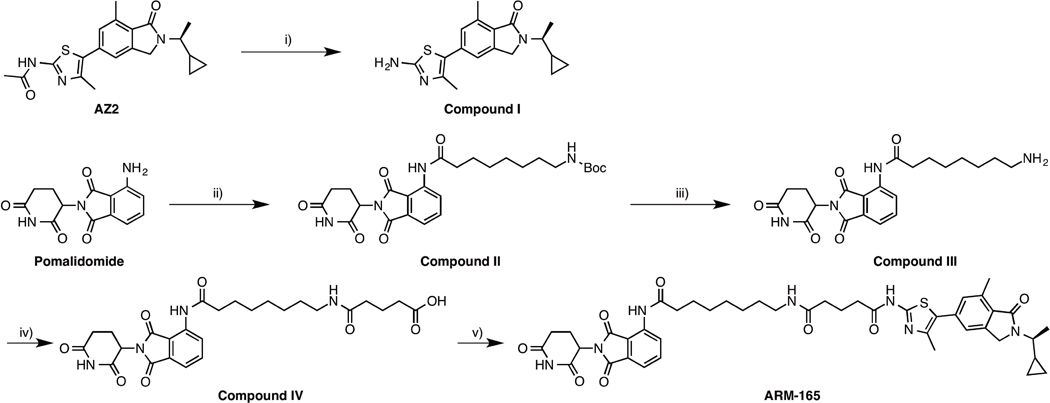
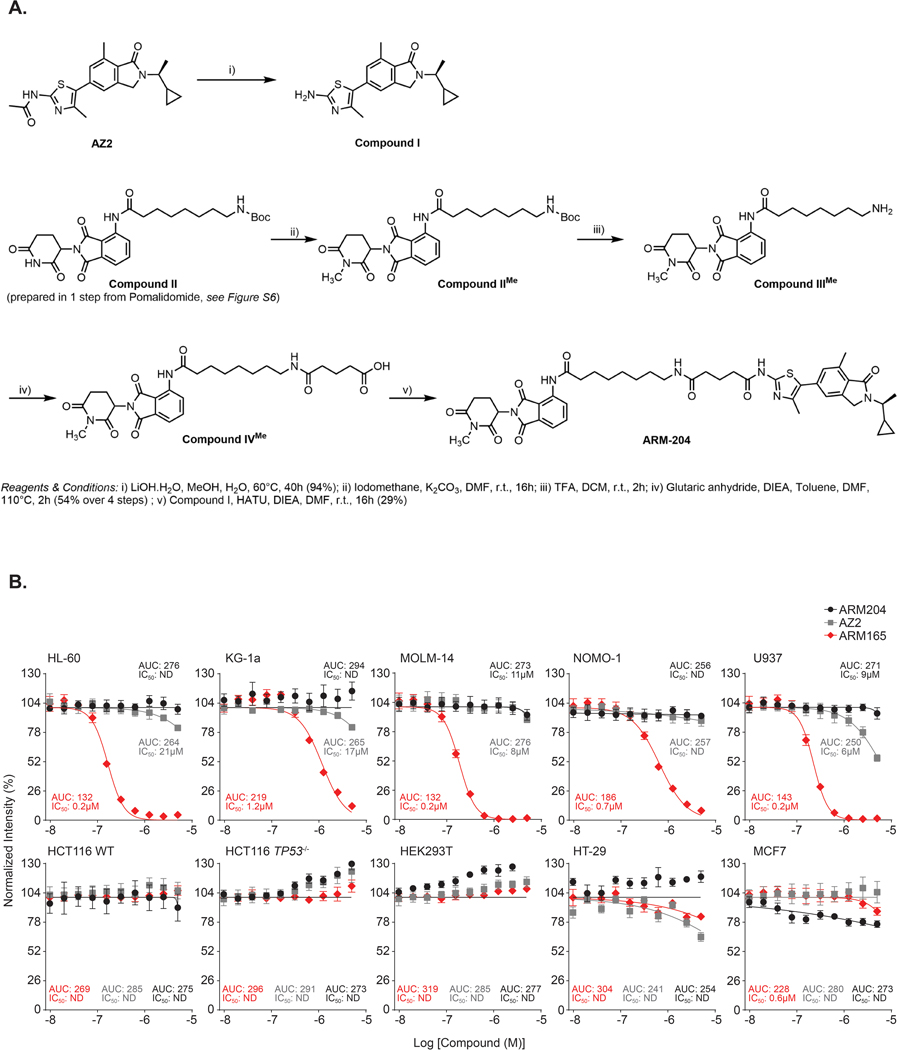
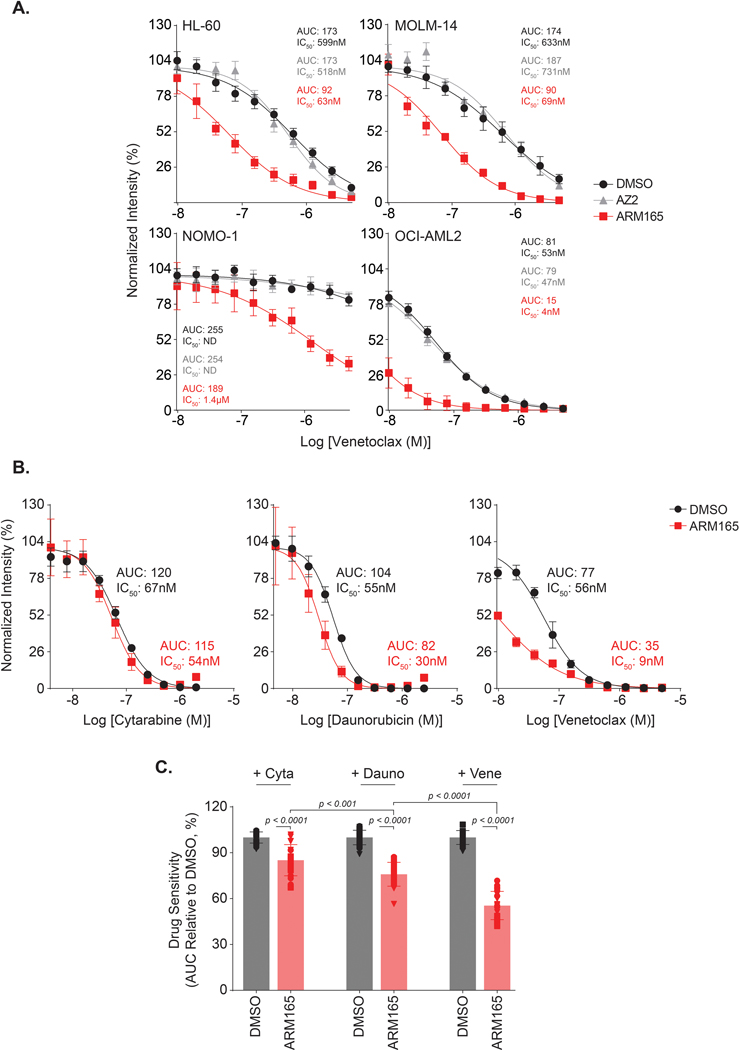
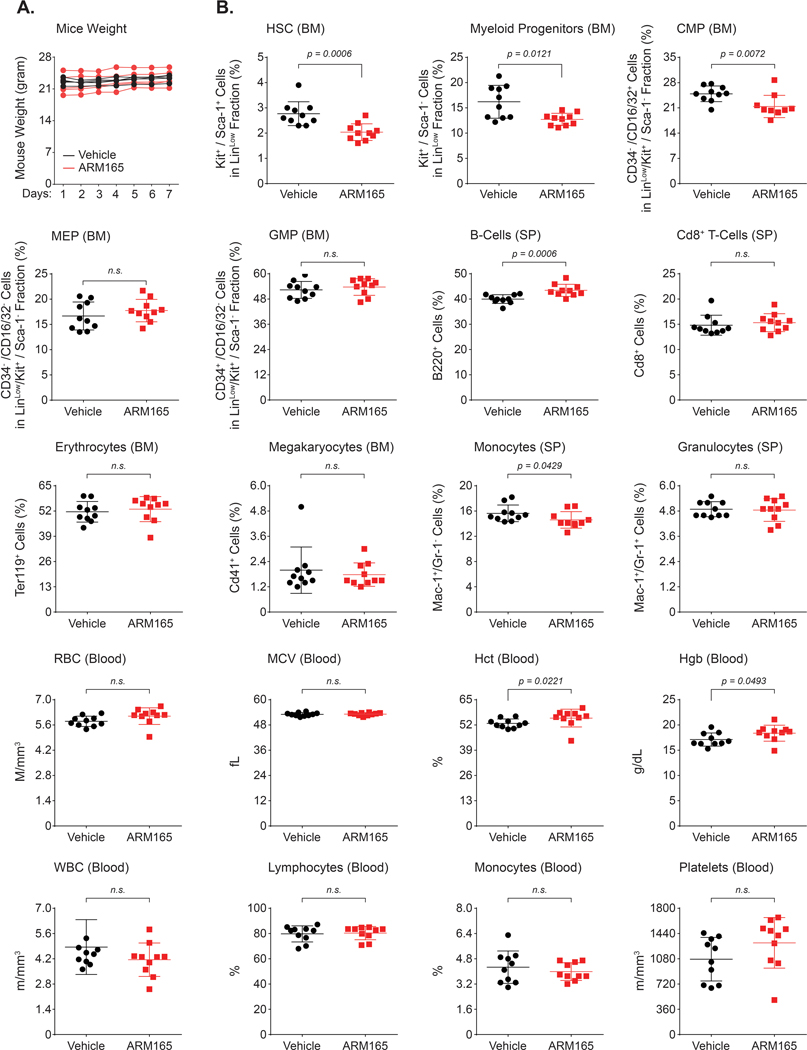
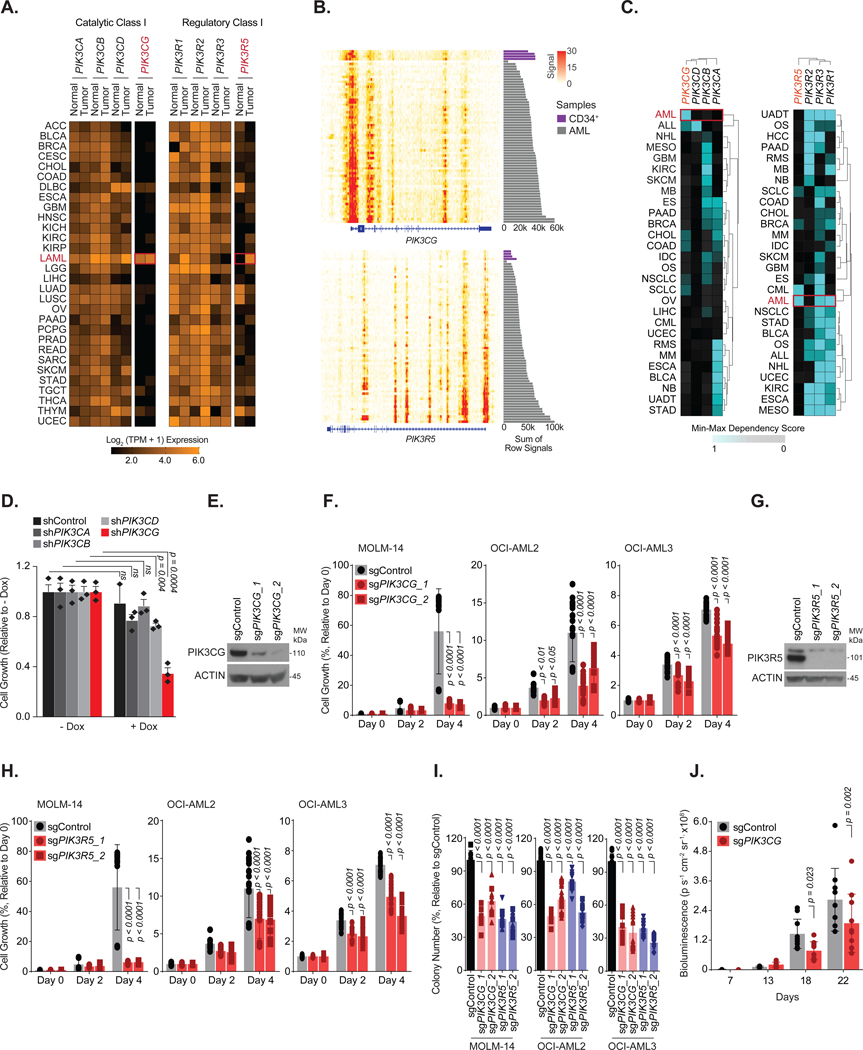
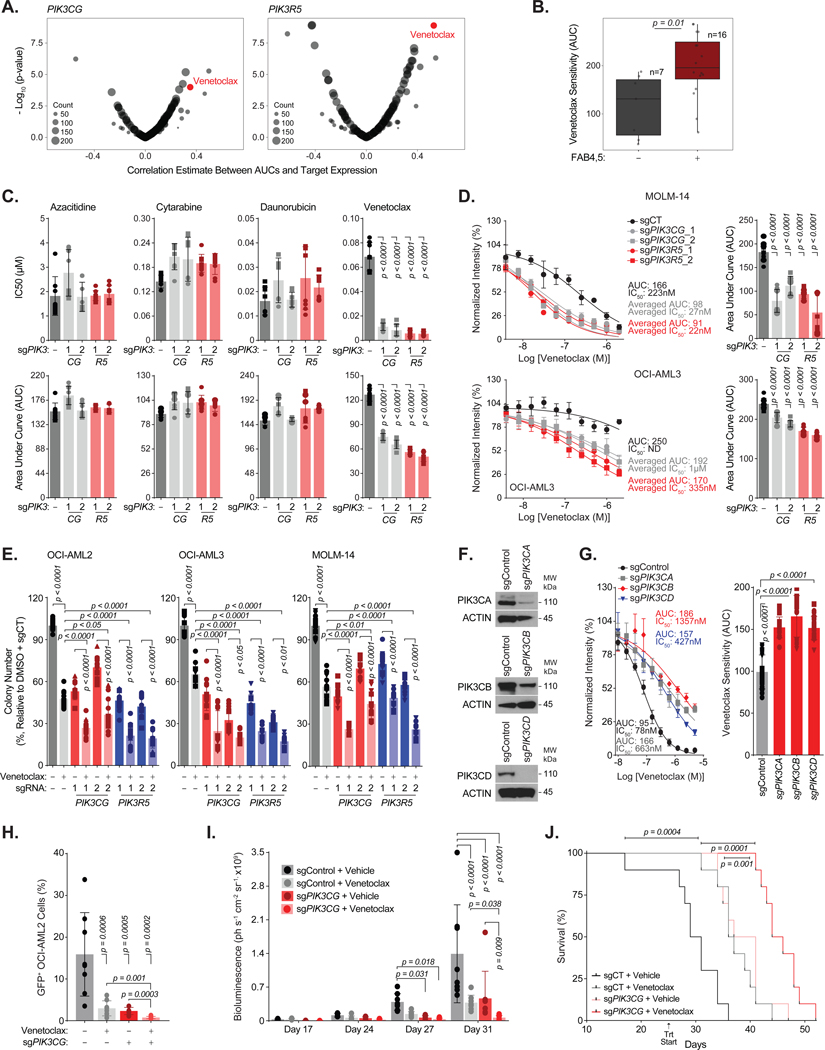
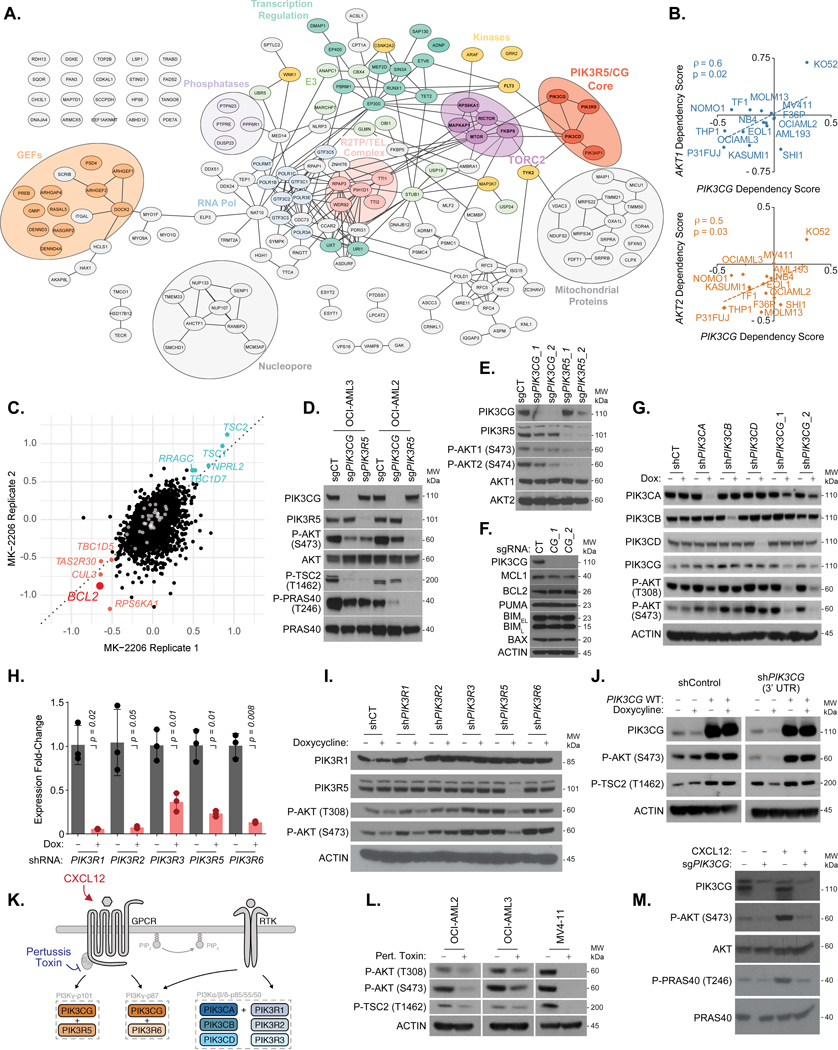
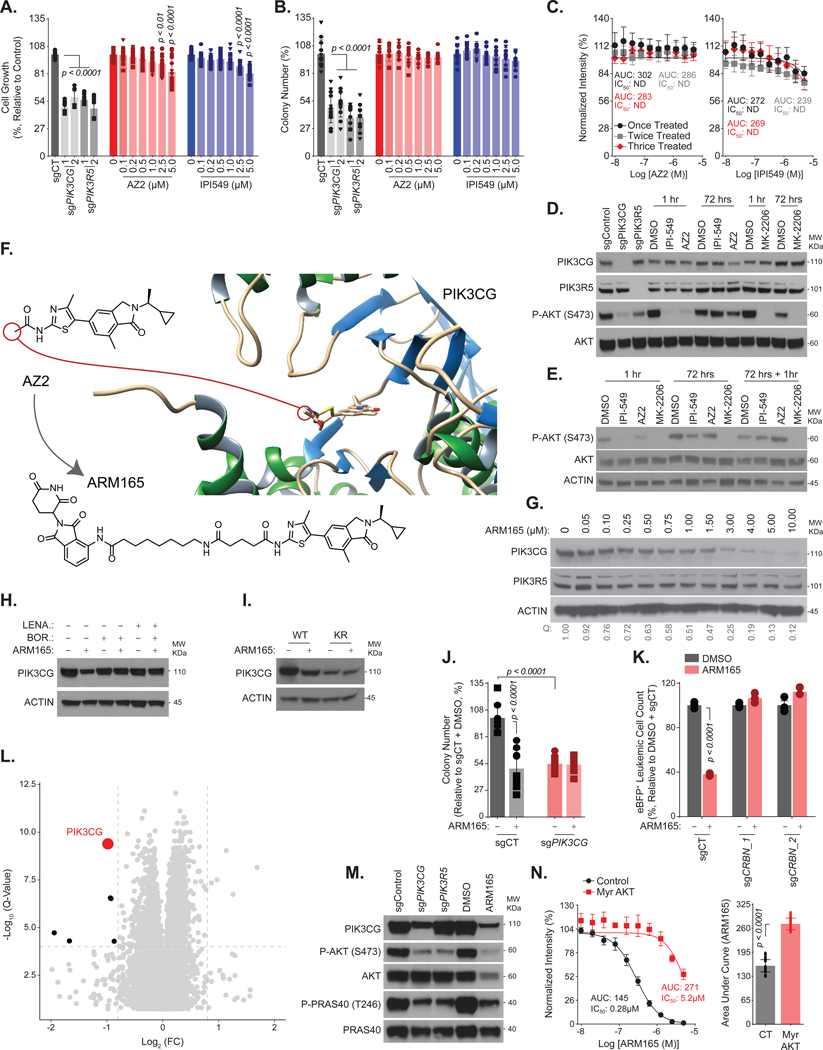
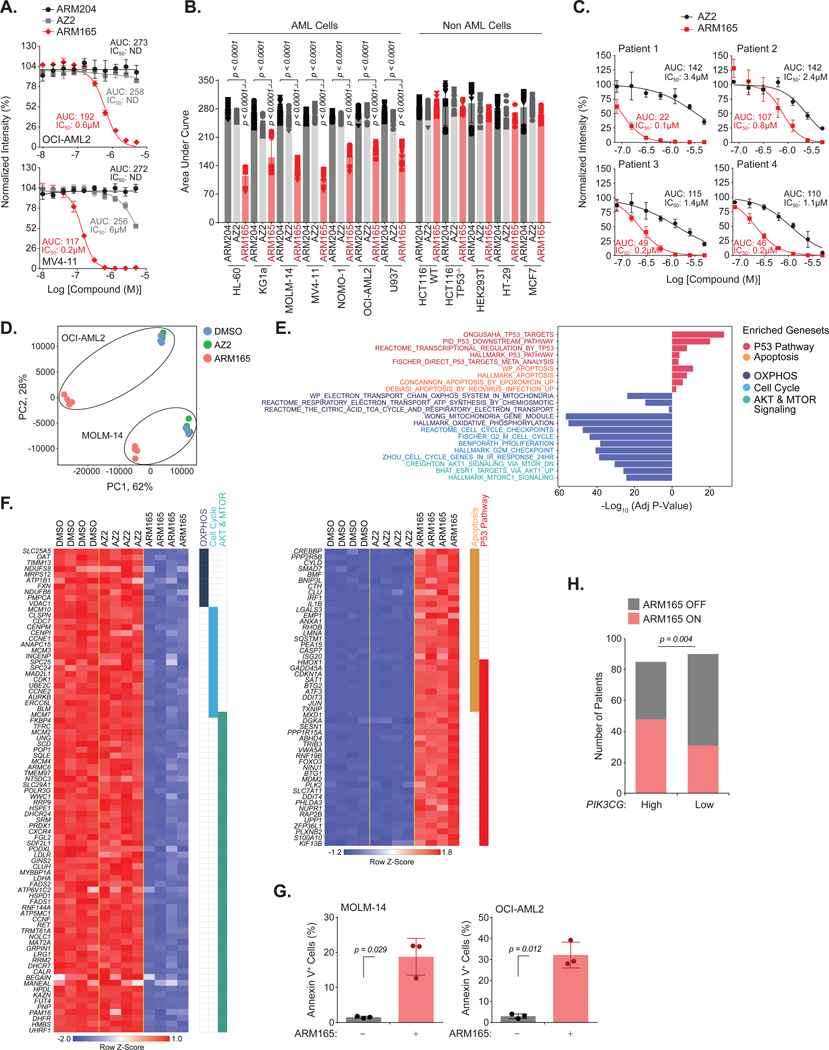
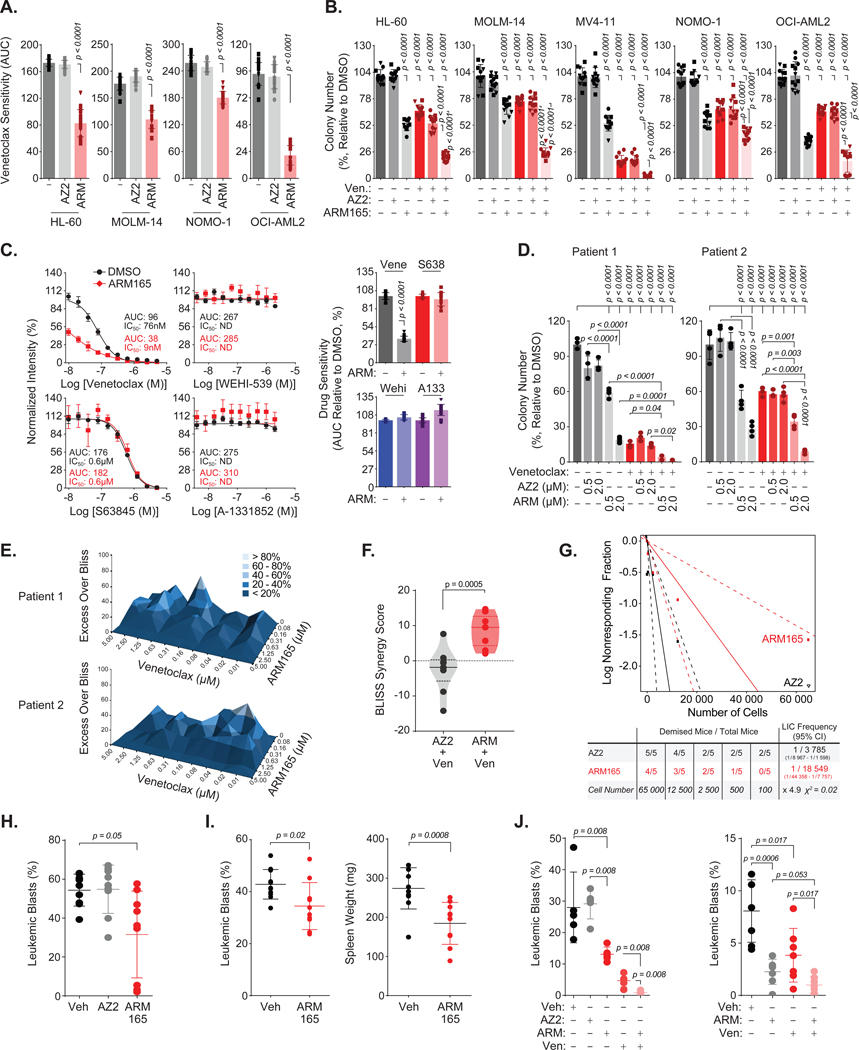
Dose-limiting toxicity poses a major limitation to the clinical utility of targeted cancer therapies, often arising from target engagement in nonmalignant tissues. This obstacle can be minimized by targeting cancer dependencies driven by proteins with tissue-restricted and/or tumor-restricted expression. In line with another recent report, we show here that, in acute myeloid leukemia (AML), suppression of the myeloid-restricted PIK3CG/p110γ-PIK3R5/p101 axis inhibits protein kinase B/Akt signaling and compromises AML cell fitness. Furthermore, silencing the genes encoding PIK3CG/p110γ or PIK3R5/p101 sensitizes AML cells to established AML therapies. Importantly, we find that existing small-molecule inhibitors against PIK3CG are insufficient to achieve a sustained long-term antileukemic effect. To address this concern, we developed a proteolysis-targeting chimera (PROTAC) heterobifunctional molecule that specifically degrades PIK3CG and potently suppresses AML progression alone and in combination with venetoclax in human AML cell lines, primary samples from patients with AML and syngeneic mouse models.


Conflict of interest statement

The Krogan Laboratory has received research support from Vir Biotechnology, F. Hoffmann-La Roche, and Rezo Therapeutics. N.J.K. has financially compensated consulting agreements with Maze Therapeutics. N.J.K. is the President and is on the Board of Directors of Rezo Therapeutics, and he is a shareholder in Tenaya Therapeutics, Maze Therapeutics, Rezo Therapeutics, and Interline Therapeutics. K.C.W. is a co-founder, consultant, and equity holder at Tavros Therapeutics and Celldom, is a consultant and equity holder at Simple Therapeutics and Decrypt Biomedicine, and has performed consulting work for Guidepoint Global, Bantam Pharmaceuticals, and Apple Tree Partners. The remaining authors declare no competing interests.

Figures

Extended Data Fig. 1:
A. Comparison of the expression levels of PIK3CG and PIK3R5 across AML and healthy tissues. P-values calculated using one-way ANOVA. Error bars represent mean + SD. B-D. Expression levels of PIK3CG and PIK3R5 in AML patients from various FAB (B) and genetic (C) subcategories, or at diagnosis versus relapse. Standard boxplot representation; median with lower and upper hinges corresponding to the first and third quartiles. The lower and upper whiskers represent the lowest and largest value within 1.5 times the lower and upper interquartiles, respectively. The points represent individual values. (D). P-values calculated using two-sided Wilcoxon test. E and F. Spearman correlation between AML cell differentiation state and the expression of PIK3CG and PIK3R5. B-F. Data generated using the BEAT-AML cohort. F. The smooth area corresponds to the 95% confidence interval of the linear regression model. Correlation between PI3K3CG or PIK3R5 expression and ssGSVA score was tested using Spearman’s rank correlation. Tests were two-sided, and p-values were corrected for multi-testing using the Benjamini & Hochberg method.
Extended Data Fig. 2:
A. DNA sanger sequencing of the PIK3CG and PIK3R5 genomic regions targeted by the CRISPR-Cas9 PIK3CG- and PIK3R5-directed guides in OCI-AML2 cells. Sequences were aligned using TIDE online tool to determine the relative efficiency of each sgRNA. B. Bioluminescence pictures of three representative mice from Figure 1J injected with OCI-AML2 infected with either a non-targeting control or a PIK3CG-directed sgRNA. Median bioluminescence is depicted in radiance on days 7, 13, 18 and 22.
Extended Data Fig. 3:
A and B. Representative growth inhibition curves, and corresponding IC50 and AUC values from Figure 2C of OCI-AML2 cells transduced with either a non-targeting control, two PIK3CG-directed, or two PIK3R5-directed sgRNAs and treated with increasing concentrations of the indicated targeted therapies or chemotherapy drugs (A), FLT3 inhibitors, gilteritinib and sorafenib, or KIT inhibitors, amuvanib and telatinib (B). Error bars represent mean ± SD of four (A) and seven (B) replicates after three days of seeding. Av. = Averaged. C. Bioluminescence pictures of three representative mice from Figure 2I injected with OCI-AML2 cells harboring a non-targeting control or PIK3CG-directed sgRNA. Median bioluminescence is depicted in radiance on days 17, 24, 27 and 31.
Extended Data Fig. 4:
A. Volcano plots of the PIK3R5-interacting protein pulled down in OCI-AML2, MV4–11, and NOMO-1 cells compared to control. B. Ranking of proteins with positive infinite ratios (only identified in PIK3R5 pull down) according to the number of peptides identified. Only proteins with a z-test score > 0.95 were included for further analysis. C. Network corresponding to Figure 3A depicting, in two colors, the PIK3R5-interacting proteins identified in two cell lines (in yellow) or all three cell lines (in orange).
Extended Data Fig. 5:
A. Correlation between gene dependency scores of AKT1 and AKT2 versus PIK3CG in a panel of non-AML cell lines. Data from DepMap CRISPR/Cas9 dependency profiling. Pearson correlation coefficient (ρ) provided to demonstrate no correlation. B. MK-2206 sensitizer and resistor topoisomerase-encoding genes, polymerase-encoding genes, and anti-apoptotic protein-encoding genes identified from a pooled drug-modifier screen conducted in OCI-AML2 cells. Gene-level scores were obtained by averaging sgRNA-level comparisons. Red dot denotes BCL2 identified as a sensitizer gene. All other genes included in the analysis are depicted as blue dots. C. Chemokine/receptor expression heatmap indicating upregulation of both CXCL12/CXCR4 in AML relative to normal tissue. Tumor expression data from TCGA database; normal expression data from GeTex expression database. Data accessed through Gepia gene expression portal.
Extended Data Fig. 6:
Synthetic scheme for the synthesis of the PIK3CG degrader, ARM165. Reagents and conditions: i) LiOH monohydrate, MeOH, H2O, 60°C, 40 h (94%) ; ii) Boc-AOc-OH, T3P 50% in ethyl acetate, pyridine, N,N-dimethylformamide, 80°C, 16 h ; iii) TFA, CH2Cl2, r.t. 2 h ; iv) Glutaric anhydride, N,N-diisopropylethylamine, toluene, N,N-dimethylformamide, 110°C, 2 h (62% over 3 steps, ii-iv) ; v) Compound I, HATU, N,N-diisopropylethylamine, N,N-dimethylformamide, r.t. 16 h (55%).
Extended Data Fig. 7:
A. Representative growth inhibition curves, with IC50s and AUCs, corresponding to the Figure 5B for AML and non-AML cells treated with increasing doses of ARM204, AZ2, and ARM165. Error bars represent mean ± SD of seven replicates after three days of seeding. B. Synthetic scheme for the synthesis of non-PIK3CG-targeting control compound for ARM165, ARM204. Reagents and conditions are provided below the synthesis scheme.
Extended Data Fig. 8:
A. Representative growth inhibition curves, IC50s, and AUC values, corresponding to Figure 6A of indicated AML cells treated with increasing doses of venetoclax in presence of AZ2 or ARM165. Error bars represent mean ± SD of seven replicates after three days of seeding. B-C. Growth inhibition curves, IC50s, and AUC values of OCI-AML2 cells treated with increasing doses of cytarabine, daunorubicin, or venetoclax in combination with 500nM ARM165. Error bars represent mean ± SD of seven technical replicates after three days of seeding in three biological repeats. P-values calculated using one-way ANOVA.
Extended Data Fig. 9:
A-B. Toxicity profile of ARM165 treatment in naive mice. Mice were treated with IV injection of 0.051mg/kg ARM165 for seven consecutive days. Individual mouse weight was measured daily (n=5 mice per group) (A) and the proportion of each indicated hematopoietic cell fraction (B) was established in blood using an MS9 instrument, and in bone marrow (BM) and spleen (SP) by flow cytometry (n=10 mice per group). Error bars represent mean ± SD. P-values calculated using Mann-Whitney.
Figure 1:
Figure 1:. AML Cells Exhibit a Selective Dependency on PIK3CG and its Regulatory Subunit PIK3R5.
A. Expression of catalytic and regulatory Class I PI3K isoforms in normal and tumor tissue samples. Primary tumor expression data from TCGA database; normal expression data from GeTex expression database. Data accessed through Gepia gene expression portal. B. Heatmap of normalized read density of H3K27ac ChIP-seq of 66 AML patient samples and four CD34+ healthy donors’ samples. Bar graphs represent the sum of depicted region signal for each sample. C. DepMap CRISPR/Cas9 dependency profiling data depicting essentiality of the four catalytic and regulatory isoforms of PI3K. Data are ordered by unsupervised hierarchical clustering of Min-Max normalized averaged dependencies across cell lines in a given cancer type. Only cancer types with > 5 cell lines were included in analysis. D. Cell growth of OCI-AML2 cells following shRNA-mediated depletion of PIK3CA, PIK3CB, PIK3CD, or PIK3CG. Data were normalized to values obtained from the corresponding – doxycycline condition. Error bars represent mean ± SD of three biological replicates after three days of seeding. P-values calculated using two-tailed Welch t test. E. PIK3CG levels by western blot in OCI-AML2 cells transduced with a non-targeting control and two PIK3CG-directed sgRNAs. ACTIN used as a loading control. F. Cell growth over time of indicated AML cell lines transduced with either a non-targeting control or two PIK3CG-directed sgRNAs. Error bars represent mean ± SD of three biological replicates composed of seven technical repeats. G. PIK3R5 levels by western blot in OCI-AML2 cells transduced with a non-targeting control and two PIK3R5-directed sgRNAs. ACTIN used as a loading control. H. Cell growth over time of indicated AML cell lines transduced with either a non-targeting control or two PIK3CG-directed sgRNAs. Error bars represent mean ± SD of three biological replicates composed of seven technical repeats. I. Colony formation from indicated AML cell lines infected with either a control, or two sgRNAs directed against PIK3CG or PIK3R5. Error bars represent mean ± SD of three biological replicates composed of five technical repeats. J. Bioluminescence signal detected by in vivo IVIS imaging of OCI-AML2 cells infected with a control or a PIK3CG-directed sgRNA and injected into NSG mice (n=10 mice / group) across multiple time points (days 7, 13, 18, 22). Error bars represent mean ± SD. P-values calculated using two-way ANOVA. F, H, and I. P-values calculated using one-way ANOVA and reported on the figure panels. Different shapes of dots indicate distinct biological replicates. E and G. Experiments were performed at least twice with similar results.
Figure 2:
Figure 2:. PIK3CG and PIK3R5 Suppression Potentiates the Anti-Leukemia Effect of Venetolax.
A. Spearman correlation between PIK3CG and PIK3R5 expression and AUC responses to small- molecules screened as part of the BEAT-AML project. B. Venetoclax sensitivity in patients from the BEAT-AML cohort who are part, or not part, of the FAB4 and 5 subgroups. Median with hinges at first and third quartiles, whiskers extend to 1.5 times the interquartile range, points indicate individual values. n values displayed on graph. A and B. Two-sided p-values were corrected for multi-testing using the Benjamini & Hochberg and reported on the figure panels. C. Cell sensitivity represented as half-maximal inhibitory concentration (IC50s, top) and Area Under the Curves (AUCs, bottom) of OCI-AML2 cells transduced with either a non-targeting control, two PIK3CG-directed, or two PIK3R5-directed sgRNAs and treated with increasing concentrations of the indicated targeted therapies or chemotherapy drugs. Error bars represent mean ± SD of two biological replicates composed of four technical repeats after three days of seeding. D. Venetoclax sensitization effect (representative dose response curves, left panel, and AUCs, right panel) of two PIK3CG- and PIK3R5-directed sgRNAs in MOLM-14 and OCI-AML3 cell lines treated with increasing doses of venetoclax. Error bars represent mean ± SD of two biological replicates composed of five technical repeats after three days of seeding. E.Colony formation from various AML cell lines infected with either a control, or two sgRNAs directed against PIK3CG or PIK3R5, and treated with 250nM, 5μM, or 150nM venetoclax in OCI-AML2, OCI-AML3, and MOLM-14, respectively. Error bars represent mean ± SD of three biological replicates composed of four technical repeats after seven days of seeding. F. PIK3CA, PIK3CB and PIK3CD levels by western blot in OCI-AML2 cells transduced with a non-targeting control and two PIK3CG-directed sgRNAs. ACTIN used as a loading control. Experiment performed at least twice with similar results. G. Representative growth inhibition curve (left panel) and AUCs (right panel) of OCI-AML2 cells infected with a non-targeting control and a PIK3CA-, PIK3CB-, or PIK3CD-directed sgRNA and treated with increasing venetoclax. Error bars represent mean ± SD of three biological replicates composed of seven technical repeats after three days of seeding. C-E, G. P-values calculated using one-way ANOVA and reported on the figure panels. Different shapes of dots indicate distinct biological replicates. H. Proportion of GFP-positive OCI-AML2 cells infected with a control or a PIK3CG-directed sgRNA and injected in NSG mice treated with either vehicle or 100mg/kg venetoclax (n=8 mice / group, mean ± SD). P-values calculated using two-tailed Mann-Whitney and reported on the figure panel. I. Bioluminescence signal detected over multiple indicated time points of OCI-AML2 cells infected with a control or a PIK3CG-directed sgRNA and injected into NSG mice (n=8 mice / group, mean ± SD) and treated with either vehicle or 100mg/kg venetoclax. P-values calculated using two-way ANOVA and reported on the figure panel. J. Overall survival of mice transplanted with either OCI-AML2 cells infected with a non-targeting or a PIK3CG-direct sgRNA alone or in combination with 100 mg/kg venetoclax daily from day 25 (n=10 mice/ group). Statistical significance by log-rank (Mantel-Cox) test and reported on the figure panel. C-E, G. Different shapes of dots indicate distinct biological replicates.
Figure 3:
Figure 3:. PIK3CG and PIK3R5 Selectively Control AKT Signaling in AML.
A. Network of the top PIK3R5-interacting proteins in at least two AML cell lines from a tandem affinity purification of PIK3R5/p101. Known physical interaction from StringDB (score > 0.5). B. Correlation between gene dependency scores of AKT1 and AKT2 versus PIK3CG in a panel of 15 AML cell lines. Data from DepMap CRISPR/Cas9 dependency profiling. Pearson correlation coefficient (ρ) and two-tailed p-value are reported on the figure panel. C. Top MK-2206 sensitizer and resistor candidate genes identified from a pooled drug-modifier screen conducted in OCI-AML2 cells. Gene-level scores were obtained by averaging sgRNA-level comparisons. Genes with a log2 depletion of < - 0.5 or enrichment of > 0.5 designated in orange and blue dots, respectively. Red dot denotes BCL2. Non-targeting control genes depicted as grey dots. D. Expression and phosphorylation levels of PIK3CG, PIK3R5, AKT, and AKT substrates by western blot in OCI-AML2 and OCI-AML3 cells transduced with a non-targeting control, and one representative PIK3CG- and PIK3R5-directed sgRNA. E. AKT1 and AKT2 phosphorylation levels by western blot in OCI-AML2 cells following knockout of PIK3CG and PIK3R5. F. Indicated pro- and anti-apoptotic protein levels by western blot following knockout of PIK3CG and PIK3R5 using one representative sgRNA in OCI-AML2 cells. G. Catalytic PI3K subunit levels and phosphorylation of AKT by western blot following knockdown of indicated catalytic PIK3 subunits in OCI-AML2 cells. ACTIN used as a loading control. H. Fold-change in mRNA expression levels of each regulatory PI3K subunit following their knockdown. Error bars represent mean ± SD of three biological replicates. P-values calculated using two-tailed Welch t test and reported on the figure panel. I. AKT phosphorylation levels by western blot following knockdown of regulatory subunits of AKT in OCI-AML2 cells. J. Phosphorylation levels of AKT and a downstream substrate, TSC2, by western blot following ectopic expression of wild-type PIK3CG in OCI-AML2 cells infected with an shRNA targeting the 3’ UTR region of PIK3CG. K. Schematic of the PI3K signaling downstream G-coupled protein receptors (GPCR) and tyrosine kinase receptors (RTK). CXCL12 activates GPCRs whereas pertussis toxin blocks their activity. L. AKT and TSC2 phosphorylation levels by western blot in indicated human AML cell lines treated with 100ng/mL pertussis toxin Ptx for 24 hours. M. Phosphorylation levels of AKT and its downstream substrate PRAS40 by western blot in control or PIK3CG-depleted OCI-AML2 cells treated with 200ng/mL SDF1𝛼 in serum-free media for 30 minutes. D-G, I-J, L-M: Experiments were performed at least twice with similar results.
Figure 4:
Figure 4:. PROteolysis Targeting Chimera (PROTAC)-Based PIK3CG Degradation Is a Promising Strategy to Durably Suppress AKT Signaling in AML.
A-B. Relative cell growth (A) and colony formation capacity (B) of OCI-AML2 cells following sgRNA-mediated suppression of PIK3CG or PIK3R5, or treated with indicated concentrations of small-molecule inhibitors of PIK3CG, IPI-549 and AZ2. Error bars represent mean ± SD of two biological replicates composed of seven technical repeats (A) for the knockout experiment and (B) three biological replicates composed of four technical repeats for the pharmacological study.. C. Growth inhibition, IC50 and AUC values, of OCI-AML2 cells treated once, twice or thrice iteratively with increasing concentrations of IPI-549, or AZ2. Error bars represent mean ± SD of two biological replicates composed of seven technical repeats. D. AKT phosphorylation levels by western blot in OCI-AML2 cells either infected with PIK3CG- and PIK3R5-directed sgRNAs for 72 hours or treated with 500nM IPI-549, AZ2, or the AKT inhibitor, MK-2206, for one and 72 hours. E. AKT phosphorylation levels by western blot of OCI-AML2 cells treated for one hour, 72 hours, or 72 hours followed by fresh addition of 500nM IPI-549, AZ2, or MK-2206 for one hour. F. Simulation of the docking of AZ2 in the PIK3CG pocket. The parental AZ2 inhibitor is shown to be converted to ARM165 degrader by capitalizing on the presence of the acetyl moiety, that is orientated towards the outside of the kinase pocket, to which a linker and subsequent CEREBLON recruiting moiety is attached to generate the PIK3CG degrader compound, ARM165. G. PIK3CG and PIK3R5 levels by western blot in OCI-AML2 cells treated with increasing concentrations of ARM165. ACTIN used as a loading control. Q: quantification of PIK3CG levels. H. PIK3CG expression level by western blot in OCI-AML2 cells treated with 1μM ARM165 in combination with either 10nM bortezomib or 10μM lenalidomide for 24 hours. I. PIK3CG expression level by western blot in HEK293T cells expressing either wild-type or a lysine to arginine mutant form of PIK3CG (K437R, K444R, K455R, K457R, K490R, K510R, K531R, K553R, K572R, K584R, K587R, and K597R). ACTIN used as a loading control. J. Colony formation from OCI-AML2 cells harboring either a control or a PIK3CG-directed sgRNA and treated with 600nM ARM165. Error bars represent mean ± SD of two biological replicates composed of four and five technical repeats after seven days of seeding. K. Proportion of mTagBFP-positive OCI-AML2 cells infected with a control (sgCT), and two CRBN-directed sgRNAs (sgCRBN_1 and sgCRBN_2) and treated with 3μM ARM165. Error bars represent mean ± SD of three biological replicates after three days of seeding. P-values calculated using two–tailed Welch t test and reported on the figure panel. L. Quantitative proteomics analysis of PIK3CG-expressing HEK293T cells treated with 2μM ARM165 for 24 hours. Volcano plot threshold applied at p-value ≤ 10−4 and absolute log2 (FC) ≥ 0.8. M. Phosphorylation levels of AKT and its substrate PRAS40 by western blot in OCI-AML2 cells infected with a control, a representative PIK3CG-, or PIK3R5-directed sgRNA or treated with 1μM ARM165 for 72 hours. N. Representative growth inhibition curves (left panel), IC50s, and AUCs (right panel) in response to increasing concentrations of ARM165 of OCI-AML2 cells infected with either a control or a myristoylated form of AKT. Error bars represent mean ± SD of three biological replicates composed of seven technical repeats after three days of seeding. P-values calculated using two-tailed Mann Whitney and reported on the figure panel. Different shapes of dots indicate distinct biological replicates. A, B, J, K. P-values calculated using one-way ANOVA and reported on the figure panels. Different shapes of dots indicate distinct biological replicates. D-E, G-I, M. Experiments were performed at least twice with similar results.
Figure 5:
Figure 5:. Degradation of PIK3CG Demonstrated Superior Cytotoxic Performance Relative to Existing Small-Molecule Inhibitors of PIK3CG.
A. Representative growth inhibition curves, with IC50s and AUCs (n=7, mean ± SD) of two human AML cell lines treated with increasing doses of ARM204 (a non-PIK3CG targeting inactive small-molecule analog to ARM165), AZ2, and ARM165. B. AUCs reflecting viability of multiple indicated human AML and non-AML cell lines treated with increasing ARM204, AZ2, and ARM165. Error bars represent mean ± SD of three biological replicates composed of seven technical repeats after three days of seeding. P-values calculated using one-way ANOVA and reported on the figure panel. Different shapes of dots indicate distinct biological replicates. C. Growth inhibition, IC50 and AUC values, of four primary samples (n=4, mean ± SD) from patients with AML treated with increasing AZ2 and ARM165after five days of seeding. D. Principal component analysis of OCI-AML2 and MOLM-14 cells treated with DMSO, 1μM and 500nM AZ2 or ARM-165 for 24 hours, respectively. E. Representative upregulated and downregulated pathways along with their respective biological functions, using the top dysregulated genes (with q-values < 0.001) common to ARM165-treated OCI-AML2 and MOLM-14 cells. F. Heatmaps of leading-edge genes of biological pathways reported in panel E and their expression levels compared to DMSO following AZ2 and ARM165 treatments of MOLM-14 cells. G. Proportion of Annexin V-positive MOLM-14 and OCI-AML2 cells treated with 500nM and 1μM ARM165, respectively, for 48 hours. Error bars represent mean ± SD of three biological replicates. P-values calculated using two-tailed Welch t test and reported on the figure panel. H. ARM165 gene signature representation in AML patients from the BEAT-AML cohort with low versus high PIK3CG expression. ON versus OFF ARM165 signatures were assigned for each patient based on their ES score below or above the median, respectively. The number of ARM165-ON patients in the PIK3CG high subset versus the PIK3CG low subset was compared. P-values using two-tailed Fisher’s t-test and reported on the figure panel.
Figure 6.
Figure 6.. PIK3CG Degradation Potentiates the Effect of Venetoclax in Multiple AML Models.
A. Venetoclax sensitization effect of AZ2, or ARM165 across indicated human AML cell lines. Error bars represent mean ± SD of three biological replicates composed of seven technical repeats after three days of seeding. B. Colony formation from five human AML cell lines treated with AZ2 or ARM165 in combination with venetoclax (MOLM-14: 0.75μM AZ2 or ARM165, and 375nM venetoclax; MV4–11: 0.5μM AZ2 or ARM, and 75nM venetoclax; OCI-AML2: 1μM AZ2 or ARM165, and 500nM venetoclax; NOMO-1: 0.625μM ARM165 or AZ2, and 10μM venetoclax; HL60: 1μM ARM or AZ2, and 2.5μM venetoclax). Error bars represent mean ± SD of three biological replicates composed of four technical repeats after seven days of seeding. C. Growth inhibition curves (left panel), IC50 values, and AUCs (right panel) of OCI-AML2 cells treated with DMSO or 500nM ARM165 in combination with increasing doses of either venetoclax, an MCL1 inhibitor, S63845, or two BCL-XL inhibitors, WEHI-539 and A-1331852. Error bars represent mean ± SD of three biological replicates composed of seven technical repeats after three days of seeding. D. Colony formation from two human AML primary samples (n=4, mean ± SD) treated with indicated AZ2 or ARM165 concentrations in combination with 375nM venetoclax after seven days of seeding. A-D. P-values calculated using one-way ANOVA and reported on the figure panel. Different shapes of dots indicate distinct biological replicates. E. Bliss synergy plots for two primary patient samples with AML and treated with ARM165 and venetoclax across a drug-dilution matrix for five days. Delta scores from high synergy (lighter blue) to no synergy (dark blue). F. Bliss synergy scores for 9 primary patient samples with AML and treated with a drug-dilution matrix of AZ2 and venetoclax, or ARM165 and venetoclax. Bars represent median and violin plots represent range. P-values calculated using two-tailed Mann-Whitney test and reported on the figure panel. G. In vivo limiting dilution assay performed with primary murine Cbfb-MYH11 leukemic cells treated for 24h with 0.5μM AZ2 or ARM165 and injected into sublethally-irradiated recipient animals at decreasing cell concentrations. Determination of Leukemia-Initiating Cell (LIC) frequency with a 95% confidence interval in each group using Extreme Limiting Dilution Analysis (ELDA). Two-sided chi-squared test used for statistics and reported on the figure panel. H. Proportion of Cbfb-MYH11-driven GFP-positive leukemic blasts in bone marrow of euthanized animals treated by intravenous injection with vehicle (Veh), 0.051mg/kg AZ2, or 0.051mg/kg ARM165 for five consecutive days (n=9 mice per group, mean ± SD). I. Proportion of Cbfb-MYH11-driven GFP-positive leukemic blasts in spleen (left panel) and corresponding spleen weight (right panel) of euthanized animals treated by intravenous injection with vehicle (Veh) or 0.051mg/kg ARM165 for five consecutive days (n=11 mice in vehicle and n=10 mice in ARM165 group, mean ± SD). J. Left panel Proportion of blood circulating Cbfb-MYH11-driven GFP-positive blasts in animals treated by intravenous injection with vehicle (Veh), 0.051mg/kg AZ2, or 0.051mg/kg ARM165 in combination with 100mg/kg venetoclax for five consecutive days (n=5 mice per group, mean ± SD). Right panel. Proportion of blood circulating CD45-positive human AML primary blasts in animals transplanted with a PDX for a month and then treated by intravenous injection with vehicle (Veh) or 0.051mg/kg ARM165 in combination with 100mg/kg venetoclax for consecutive days (n=5 mice per group, mean ± SD). H-J. P-values calculated using two-tailed Mann-Whitney test and reported on the figure panel.

Similar articles

Cited by

References

    1. Shimony S, Stahl M. & Stone RM Acute myeloid leukemia: 2023 update on diagnosis, risk-stratification, and management. American journal of hematology 98, 502–526, doi:10.1002/ajh.26822 (2023). - DOI - PubMed
    1. Appelbaum FR et al. Age and acute myeloid leukemia. Blood 107, 3481–3485, doi:10.1182/blood-2005-09-3724 (2006). - DOI - PMC - PubMed
    1. Bhansali RS, Pratz KW & Lai C. Recent advances in targeted therapies in acute myeloid leukemia. Journal of hematology & oncology 16, 29, doi:10.1186/s13045-023-01424-6 (2023). - DOI - PMC - PubMed
    1. DiNardo CD et al. Venetoclax combined with decitabine or azacitidine in treatment-naive, elderly patients with acute myeloid leukemia. Blood 133, 7–17, doi:10.1182/blood-2018-08-868752 (2019). - DOI - PMC - PubMed
    1. DiNardo CD et al. Azacitidine and Venetoclax in Previously Untreated Acute Myeloid Leukemia. The New England journal of medicine 383, 617–629, doi:10.1056/NEJMoa2012971 (2020). - DOI - PubMed

References to the Methods section

    1. Langmead B, Trapnell C, Pop M. & Salzberg SL Ultrafast and memory-efficient alignment of short DNA sequences to the human genome. Genome biology 10, R25, doi:10.1186/gb-2009-10-3-r25 (2009). - DOI - PMC - PubMed
    1. Ramirez F. et al. deepTools2: a next generation web server for deep-sequencing data analysis. Nucleic acids research 44, W160–165, doi:10.1093/nar/gkw257 (2016). - DOI - PMC - PubMed
    1. Pohl A. & Beato M. bwtool: a tool for bigWig files. Bioinformatics 30, 1618–1619, doi:10.1093/bioinformatics/btu056 (2014). - DOI - PMC - PubMed
    1. Martz CA et al. Systematic identification of signaling pathways with potential to confer anticancer drug resistance. Science signaling 7, ra121, doi:10.1126/scisignal.aaa1877 (2014). - DOI - PMC - PubMed
    1. Su A. et al. The Folate Cycle Enzyme MTHFR Is a Critical Regulator of Cell Response to MYC-Targeting Therapies. Cancer discovery 10, 1894–1911, doi:10.1158/2159-8290.CD-19-0970 (2020). - DOI - PMC - PubMed

MeSH terms

Substances