. 2024 May 31;24(1):481.
doi: 10.1186/s12870-024-05194-2.

Evolutionary origin and gradual accumulation with plant evolution of the LACS family

Affiliations

Evolutionary origin and gradual accumulation with plant evolution of the LACS family

Siyuan Zhou et al. BMC Plant Biol. .

Abstract

Background: LACS (long-chain acyl-CoA synthetase) genes are widespread in organisms and have multiple functions in plants, especially in lipid metabolism. However, the origin and evolutionary dynamics of the LACS gene family remain largely unknown.

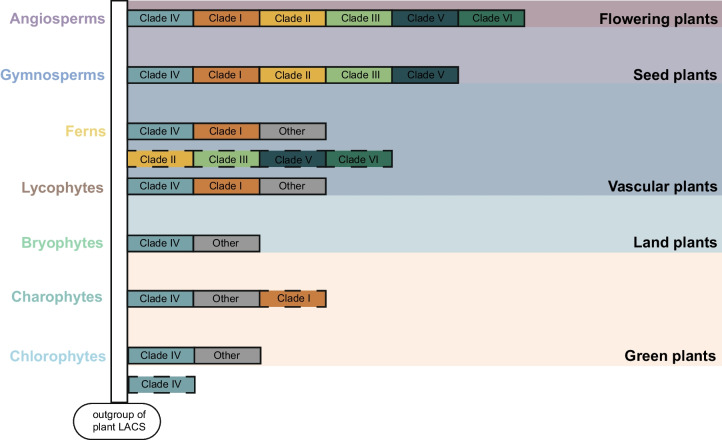
Results: Here, we identified 1785 LACS genes in the genomes of 166 diverse plant species and identified the clades (I, II, III, IV, V, VI) of six clades for the LACS gene family of green plants through phylogenetic analysis. Based on the evolutionary history of plant lineages, we found differences in the origins of different clades, with Clade IV originating from chlorophytes and representing the origin of LACS genes in green plants. The structural characteristics of different clades indicate that clade IV is relatively independent, while the relationships between clades (I, II, III) and clades (V, VI) are closer. Dispersed duplication (DSD) and transposed duplication (TRD) are the main forces driving the evolution of plant LACS genes. Network clustering analysis further grouped all LACS genes into six main clusters, with genes within each cluster showing significant co-linearity. Ka/Ks results suggest that LACS family genes underwent purifying selection during evolution. We analyzed the phylogenetic relationships and characteristics of six clades of the LACS gene family to explain the origin, evolutionary history, and phylogenetic relationships of different clades and proposed a hypothetical evolutionary model for the LACS family of genes in plants.

Conclusions: Our research provides genome-wide insights into the evolutionary history of the LACS gene family in green plants. These insights lay an important foundation for comprehensive functional characterization in future research.

Keywords: Evolutionary origin; LACS family; Phylogeny.


Conflict of interest statement

The authors declare that they have no competing interests.

Figures

Fig. 1
Fig. 1
The phylogenetic relationships and distribution of LACS gene family members among 166 species. A Classification and phylogenetic tree of 166 species; B Diagram of the developmental relationship between major plant lineages and the distribution of the number of LACS gene family members in each clade
Fig. 2
Fig. 2
A phylogenetic tree of members of the LACS gene family. A phylogenetic tree of LACS gene family members identified from 166 species clustered into six main clades (I, II, III, IV, V, VI), with different background colors used to distinguish plant lineages belonging to different clades. The LACS gene of red algae (Cyanidioschyzon merolae) is marked with a red circle, and the LACS genes of Arabidopsis thaliana are marked with a red star
Fig. 3
Fig. 3
The distribution of LACS genes on different clades. A The developmental relationship pattern of plant lineages mainly focuses on the relationships between families. B Stacked plot of the percentage of LACS genes on different clades of each family, with each clade distinguished by a different color and each bar corresponding to the family in (A). C A heatmap of the number of LACS genes on different clades of each family, with colors ranging from white to blue representing the number from least to greatest and horizontally corresponding to each row in (A) and (B)
Fig. 4
Fig. 4
Analysis of the phylogenetic relationship of each clade origin. Different background colors represent different clades, and the different clade colors and fonts represent different plant groups. A The origin of Clade IV; B the origin of Clade I; C. the origin of Clade (II, III, V); D the origin of Clade VI. AtLACSs are represented in red font. The species selected for each phylogenetic tree (A-D) can be found in Supplementary Tables S5-S8
Fig. 5
Fig. 5
Analysis of conserved motifs and conserved domains of the six clades. A A pattern diagram of conserved motifs on six clades was obtained and statistically analyzed using the MEME tool, and similar genes with 10 or more conserved motif categories and positions were counted and classified into one type. A pie chart displaying the proportion of each type; B Each motif represents the base sequence; C Differential pattern diagram of six clades for the two conserved domains (AMP-binding domain signature and ACS signature motif)
Fig. 6
Fig. 6
The number of pairs of LACS gene family members from five duplication events in 166 species genomes. The classification tree of 166 species was obtained from the NCBI Taxonomy Common Tree (https://www.ncbi.nlm.nih.gov/Taxonomy/CommonTree/wwwcmt.cgi). The bar chart shows the number of LACS gene pairs for each species in five duplication events: whole-genome duplication (WGD), tandem duplication (TD), proximal duplication (PD), transposed duplication (TRD), and dispersed duplication (DSD)
Fig. 7
Fig. 7
The collinearity network and collinearity relationships of LACS gene family members within and between different clades, as well as the proportion of Ka/Ks values in LACS gene family members. A The network clustering relationship of LACS gene family members based on the Clique percolation method with a K value of 4. The size of each node represents the number of connected edges. The network also clustered into six Clades (I, II, III, IV, V, a. VI), consistent with the phylogenetic tree in Fig. 2. B The collinearity relationship between species and within species of the LACS gene family in the phylogenetic tree. The line within the phylogenetic tree represents the collinearity of two LACS genes. C The pie chart represents the proportion of Ka/Ks values greater than or less than 1 for all LACS gene pairs
Fig. 8
Fig. 8
An evolutionary model of the LACS gene family in green plants. The solid-line box represents different clades, while the dotted-line box represents the ancestors of different clades. The LACS gene originated in green algae and was retained in green plants, with only one clade continuing to land plants. During the evolution of land plants toward vascular plants, the gene family expanded into two clades, followed by five clades in seed plants, and finally expanded into the current six clades in flowering plants

Similar articles

Cited by

References

    1. Hu T, Zhang JL. Mass-spectrometry-based lipidomics. J Sep Sci. 2018;41(1):351–372. doi: 10.1002/jssc.201700709. - DOI - PubMed
    1. De Carvalho C, Caramujo MJ. The various roles of fatty acids. Molecules. 2018;23(10):2583. doi: 10.3390/molecules23102583. - DOI - PMC - PubMed
    1. Schönfeld P, Wojtczak L. Short- and medium-chain fatty acids in energy metabolism: the cellular perspective. J Lipid Res. 2016;57(6):943–954. doi: 10.1194/jlr.R067629. - DOI - PMC - PubMed
    1. Wang J, Li XX, Zhao XC, Na C, Liu HL, Miao HR, Zhou JH, Xiao JL, Zhao X, Han YP. Genome-wide identification and characterization of the abiotic-stress-responsive LACS gene family in soybean (Glycine max) Agronomy-Basel. 2022;12(7):18.
    1. Khurana P, Gokhale RS, Mohanty D. Genome scale prediction of substrate specificity for acyl adenylate superfamily of enzymes based on active site residue profiles. BMC Bioinformatics. 2010;11: 57. - PMC - PubMed

LinkOut - more resources