. 2024 May 30;22(1):521.
doi: 10.1186/s12967-024-05309-1.

Immune cell infiltration and inflammatory landscape in primary brain tumours

Affiliations

Immune cell infiltration and inflammatory landscape in primary brain tumours

Amalia Luce et al. J Transl Med. .

Abstract

Background: Primary malignant brain tumours are more than one-third of all brain tumours and despite the molecular investigation to identify cancer driver mutations, the current therapeutic options available are challenging due to high intratumour heterogeneity. In addition, an immunosuppressive and inflammatory tumour microenvironment strengthens cancer progression. Therefore, we defined an immune and inflammatory profiling of meningioma and glial tumours to elucidate the role of the immune infiltration in these cancer types.

Methods: Using tissue microarrays of 158 brain tumour samples, we assessed CD3, CD4, CD8, CD20, CD138, Granzyme B (GzmB), 5-Lipoxygenase (5-LOX), Programmed Death-Ligand 1 (PD-L1), O-6-Methylguanine-DNA Methyltransferase (MGMT) and Transglutaminase 2 (TG2) expression by immunohistochemistry (IHC). IHC results were correlated using a Spearman correlation matrix. Transcript expression, correlation, and overall survival (OS) analyses were evaluated using public datasets available on GEPIA2 in Glioblastoma (GBM) and Lower Grade Glioma (LGG) cohorts.

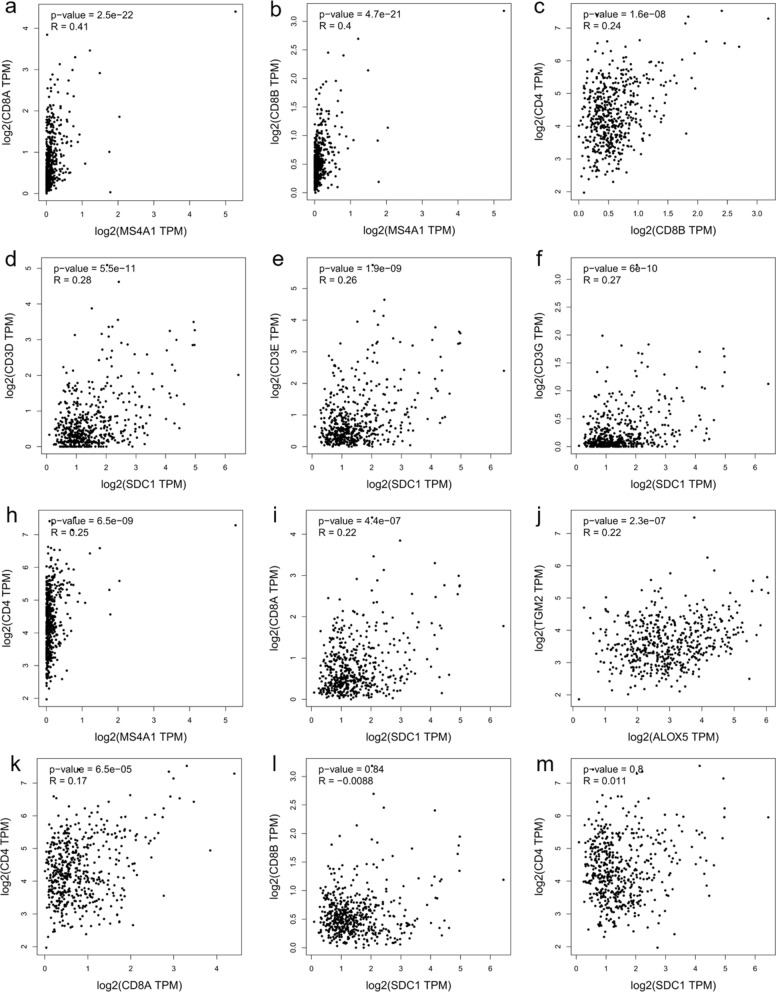
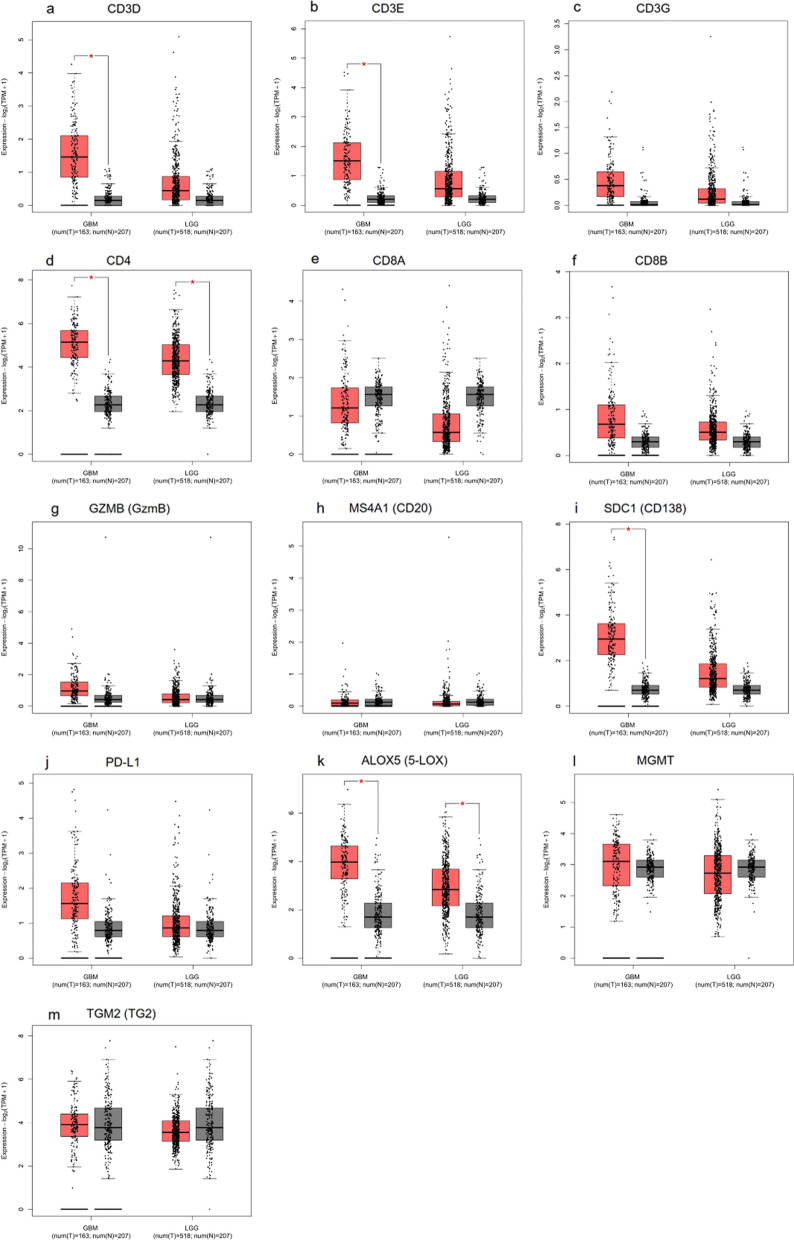
Results: Seven out of ten markers showed a significantly different IHC expression in at least one of the evaluated cohorts whereas CD3, CD4 and 5-LOX were differentially expressed between GBMs and astrocytomas. Correlation matrix analysis revealed that 5-LOX and GzmB expression were associated in both meningiomas and GBMs, whereas 5-LOX expression was significantly and positively correlated to TG2 in both meningioma and astrocytoma cohorts. These findings were confirmed with the correlation analysis of TCGA-GBM and LGG datasets. Profiling of mRNA levels indicated a significant increase in CD3 (CD3D, CD3E), and CD138 (SDC1) expression in GBM compared to control tissues. CD4 and 5-LOX (ALOX5) mRNA levels were significantly more expressed in tumour samples than in normal tissues in both GBM and LGG. In GBM cohort, GzmB (GZMB), SDC1 and MGMT gene expression predicted a poor overall survival (OS). Moreover, in LGG cohort, an increased expression of CD3 (CD3D, CD3E, CD3G), CD8 (CD8A), GZMB, CD20 (MS4A1), SDC1, PD-L1, ALOX5, and TG2 (TGM2) genes was associated with worse OS.

Conclusions: Our data have revealed that there is a positive and significant correlation between the expression of 5-LOX and GzmB, both at RNA and protein level. Further evaluation is needed to understand the interplay of 5-LOX and immune infiltration in glioma progression.

Keywords: 5-Lypoxygenase; Astrocytoma; Glioblastoma; Immune cell infiltration; Inflammation; Meningioma.


Conflict of interest statement

The authors have no relevant financial or non-financial interests to disclose.

Figures

Fig. 1
Fig. 1
Graphical representation of the correlation between age and PBTs. Average age of individuals diagnosed with meningioma, glioblastoma and astrocytoma expressed as mean ± SD
Fig. 2
Fig. 2
Immunohistochemical evaluation of TILs in PBTs. Box plot diagrams illustrating differences in median of a CD3, b CD4, c CD8, d GzmB, e CD20 and f CD138 expression
Fig. 3
Fig. 3
Representative panel of TILs in PTBs. Immunohistochemical images taken at 20X magnification, scale bar 100 µm, for (a–c) CD3, (d–f) CD4, (g–i) CD8, (j–l) CD20, (m–o) CD138 and (p–r) Granzyme B (GzmB) in meningioma, glioblastoma and astrocytoma cohorts. All markers are stained following the protocol provided by the producer with OptiView DAB IHC Detection Kit (Ventana, Roche)
Fig. 4
Fig. 4
Immunohistochemical evaluation of 5-Lipoxygenase expression (5-LOX) in PBTs. Box plot diagrams illustrating differences in median of a 5-LOX TILs and b 5-LOX cancer cells expression
Fig. 5
Fig. 5
Representative panel of 5-LOX in PTBs. Immunohistochemical images taken at 20X magnification, scale bar 100 µm, for (a–c) 5-LOX in meningioma, glioblastoma and astrocytoma cohorts. All markers are stained following the protocol provided by the producer with OptiView DAB IHC Detection Kit (Ventana, Roche)
Fig. 6
Fig. 6
Immunohistochemical evaluation of PD-L1, MGMT, and TG2 in PBTs. Box plot diagrams illustrating differences in median of a PD-L1, b MGMT, and c TG2 expression
Fig. 7
Fig. 7
Representative panel of of PD-L1, MGMT, and TG2 in PBTs. Immunohistochemical images taken at 20X magnification, scale bar 100 µm, for (ac) PD-L1, (df) MGMT, and (gi) TG2 in meningioma, glioblastoma and astrocytoma cohorts. All markers are stained following the protocol provided by the producer with OptiView DAB IHC Detection Kit (Ventana, Roche)
Fig. 8
Fig. 8
Graphical representation of the interaction between chosen markers in PTBs. Correlation matrix of the immunohistochemical expression of TILs and inflammatory markers in a meningioma (N = 66), b GBM (N = 60), and c astrocytoma (N = 32). The strength of the Spearman’s correlation analysis is represented by the color intensity of each spot, positive in blue and negative in red. *p < 0.05, **p < 0.01, and ***p < 0.001
Fig. 9
Fig. 9
Graphical representation of the interaction between chosen markers in GBM dataset. Scatter plots of the correlation analysis between a CD8A with CD4, b CD8B with CD4, c CD8A with SDC1, d CD4 with MS4A1, e CD4 with SDC1, f TGM2 with MGMT, h CD3D with TGM2, i CD3E with TGM2, j CD3G with TGM2, k GZMB with ALOX5, l CD8B with SDC1 and m SDC1 with MS4A1 are performed on expression data derived from the public cancer portal GEPIA2 using The Cancer Genome Atlas (TCGA)-GBM dataset. Non-log scale is used for calculation and the log-scale axis for visualization. Correlation results are expressed by Spearman’s rank correlation coefficient (R)
Fig. 10
Fig. 10
Graphical representation of the interaction between chosen markers in LGG dataset. Scatter plots of the correlation analysis between a CD3D with CD4, b CD3E with CD4, c CD3G with CD4, d CD3D with CD8A, e CD3E with CD8A, f CD3G with CD8A; h CD3D with CD8B, i CD3E with CD8B, j CD3G with CD8B; k CD3D with MS4A1, l CD3E with MS4A1, m CD3G with MS4A1 are performed on expression data derived from the public cancer portal GEPIA2 using The Cancer Genome Atlas (TCGA)-LGG dataset. Non-log scale is used for calculation and the log-scale axis for visualization. Correlation results are expressed by Spearman’s rank correlation coefficient (R)
Fig. 11
Fig. 11
Graphical representation of the interaction between chosen markers in LGG dataset. Scatter plots of the correlation analysis between a CD8A with MS4A1, b CD8B with MS4A1, c CD4 with CD8B, d CD3D with SDC1, e CD3E with SDC1, f CD3G with SDC1, h CD4 with MS4A1, i CD8A with SDC1, j TGM2 with ALOX5, k CD4 with CD8A l CD8B with SDC1 m CD4 with SDC1 are performed on expression data derived from the public cancer portal GEPIA2 using The Cancer Genome Atlas (TCGA)-LGG dataset. Non-log scale is used for calculation and the log-scale axis for visualization. Correlation results are expressed by Spearman’s rank correlation coefficient (R)
Fig. 12
Fig. 12
Graphical representation of chosen markers in GBM and LGG dataset. Gene expression analysis on RNA-seq data from TCGA and GTEx samples using GBM and LGG datasets performed with GEPIA2. Gene expression for a CD3D, b CD3E, c CD3G, d CD4, e CD8A, f CD8B, g GZMB (GzmB), h MS4A1 (CD20), i SDC1 (CD138), j PD-L1, k ALOX5 (5-LOX), l MGMT and m TGM2 (TG2) is reported as log2(TPM + 1) in tumour samples (GBM: red, T = 163; LGG: red, T = 518) and normal tissue (GBM: grey, N = 207; LGG: grey, N = 207). Significant differences are shown with an asterisk: *p-value ≤ 0.01
Fig. 13
Fig. 13
Kaplan–Meier plots for gene expression from the GEPIA2 tool in GBM and LGG cohorts. ‘N’ represents the size of the groups involved in the study with high (red) and low (blue) expression of a CD3D; b CD3E; c CD3G; d CD4; e CD8A; f CD8B; g GZMB (GzmB); h MS4A1 (CD20); i SDC1 (CD138)
Fig. 13
Fig. 13
Kaplan–Meier plots for gene expression from the GEPIA2 tool in GBM and LGG cohorts. ‘N’ represents the size of the groups involved in the study with high (red) and low (blue) expression of a CD3D; b CD3E; c CD3G; d CD4; e CD8A; f CD8B; g GZMB (GzmB); h MS4A1 (CD20); i SDC1 (CD138)
Fig. 14
Fig. 14
Kaplan–Meier plots for gene expression from the GEPIA2 tool in GBM and LGG cohorts. ‘N’ represents the size of the groups involved in the study with high (red) and low (blue) expression of a PD-L1; b ALOX5 (5-LOX); c MGMT; d TGM2 (TG2)

References

    1. DeAngelis LM. Brain tumors. N Engl J Med. 2001;344:114–123. doi: 10.1056/NEJM200101113440207. - DOI - PubMed
    1. Newton HB. Chapter 1—overview of brain tumor epidemiology. In: Newton HB, editor. Handbook of neuro-oncology neuroimaging (Second Edition) San Diego: Academic Press; 2016. pp. 3–8.
    1. Black PML. Brain tumors. N Engl J Med. 1991;324:1471–1476. doi: 10.1056/NEJM199105233242105. - DOI - PubMed
    1. Reynoso-Noverón N, Mohar-Betancourt A, Ortiz-Rafael J. Epidemiology of brain tumors. In: Monroy-Sosa A, Chakravarthi SS, de la Garza-Salazar JG, Meneses Garcia A, Kassam AB, editors. Principles of neuro-oncology: brain & skull base. Cham: Springer International Publishing; 2021. pp. 15–25.
    1. Lapointe S, Perry A, Butowski NA. Primary brain tumours in adults. The Lancet. 2018;392:432–446. doi: 10.1016/S0140-6736(18)30990-5. - DOI - PubMed

Publication types