. 2024 May 30;21(1):93.
doi: 10.1186/s12984-024-01385-y.

Neuromodulation of inhibitory control using phase-lagged transcranial alternating current stimulation

Affiliations

Neuromodulation of inhibitory control using phase-lagged transcranial alternating current stimulation

Yukyung Kim et al. J Neuroeng Rehabil. .

Abstract

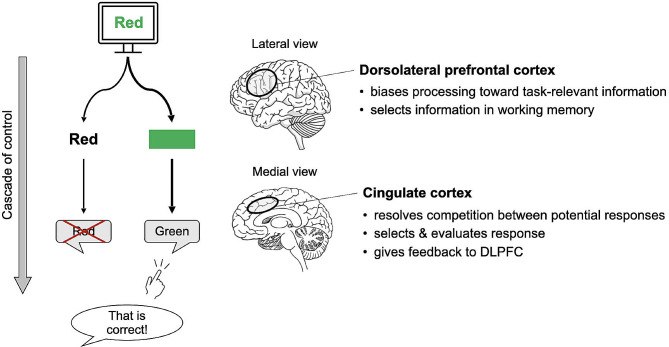
Background: Transcranial alternating current stimulation (tACS) is a prominent non-invasive brain stimulation method for modulating neural oscillations and enhancing human cognitive function. This study aimed to investigate the effects of individualized theta tACS delivered in-phase and out-of-phase between the dorsal anterior cingulate cortex (dACC) and left dorsolateral prefrontal cortex (lDLPFC) during inhibitory control performance.

Methods: The participants engaged in a Stroop task with phase-lagged theta tACS over individually optimized high-density electrode montages targeting the dACC and lDLPFC. We analyzed task performance, event-related potentials, and prestimulus electroencephalographic theta and alpha power.

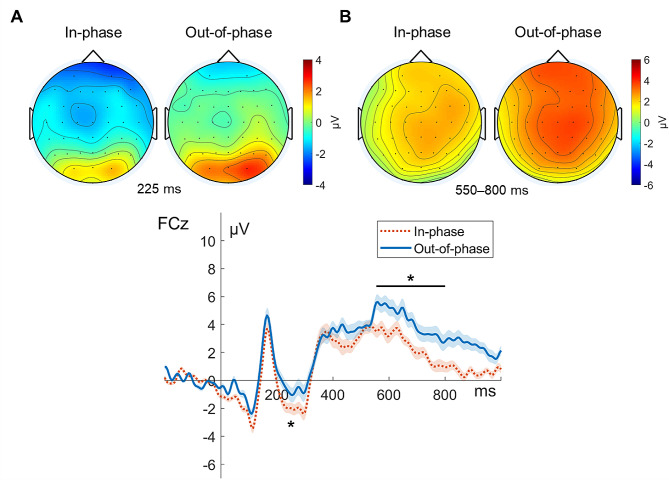
Results: We observed significantly reduced reaction times following out-of-phase tACS, accompanied by reduced frontocentral N1 and N2 amplitudes, enhanced parieto-occipital P1 amplitudes, and pronounced frontocentral late sustained potentials. Out-of-phase stimulation also resulted in significantly higher prestimulus frontocentral theta and alpha activity.

Conclusions: These findings suggest that out-of-phase theta tACS potently modulates top-down inhibitory control, supporting the feasibility of phase-lagged tACS to enhance inhibitory control performance.

Keywords: EEG; Inhibitory control; Non-invasive neuromodulation; Phase-lagging; Transcranial alternating current stimulation.


Conflict of interest statement

The authors declare no competing interests.

Figures

Fig. 1
Fig. 1
“Cascade of control” model of the Stroop effect (adapted from [27]). DLPFC, dorsolateral prefrontal cortex
Fig. 2
Fig. 2
Experimental procedure and the Stroop task. (A) The Stroop task paradigm. (B) Time flow of the experimental sessions. Each stimulation session was followed by the task session. The order of the stimulation sessions (in-phase/out-of-phase or out-of-phase/in-phase) was counterbalanced across the participants. tACS, transcranial alternating current stimulation
Fig. 3
Fig. 3
Stimulation protocol for in-phase and out-of-phase tACS. (A) In-phase stimulation waveforms to the lDLPFC (red solid line) and dACC (blue dashed line). (B) Out-of-phase stimulation waveforms to the lDLPFC (solid red line) and dACC (dashed blue line). (C) A sample simulation of the tACS-induced electric field at the lDLPFC and dACC. The unit |V/m| denotes the normalized strength of the induced electric field. (D) The simulated electric intensity (V/m) of each phase bin (eight bins for formula image—that is, by a step of formula image) is plotted in the lDLPFC (two upper plots in red) and in the dACC (two lower plots in blue; a left panel for the 0°-phase-lag and a right panel for the 180°-phase-lag tACS condition). Note that the phase of the lDLPFC stimulus advanced that of the dACC stimulus by approximately 180° (vertical green dashed lines indicate peak phases of the lDLPFC and dACC). dACC, dorsal anterior cingulate cortex; lDLPFC, left dorsolateral prefrontal cortex
Fig. 4
Fig. 4
Target-region identification and electrode-placement montage. (A) An example of target-region identification using individual functional magnetic resonance imaging data. (B) A sample montage of the optimized electrode placements used for high-definition transcranial alternating current stimulation. The stimulation input electrode for each region of interest (highlighted in green) is marked in red, and the three return electrodes are marked in blue. The montages of all participants are provided in Supplementary Figure S1. dACC, dorsal anterior cingulate cortex; lDLPFC, left dorsolateral prefrontal cortex
Fig. 5
Fig. 5
Phase-dependent tACS-mediated changes in reaction times and accuracies. (A) Reaction times following in-phase (red) and out-of-phase (blue) stimulation. (B) Task performance accuracies following in-phase (red) and out-of-phase (blue) stimulation. In the box plots, boxes are drawn from the first to the third quartile. The horizontal lines within boxes denote the median, and the whiskers extend from each quartile to the minimum or maximum with excluded outliers marked as small crosses. The asterisk represents statistical significance (*p < 0.05)
Fig. 6
Fig. 6
Phase-dependent tACS-mediated topographical maps and time courses of N1 and P1 components in the incongruent condition. (A) The upper panel illustrates the grand-averaged topographical distributions for the N1 component (at 90 ms poststimulus). The lower panel shows the grand-averaged ERP time courses for in-phase (orange dotted line) and out-of-phase (blue solid line) stimulation at electrode Cz. (B) The upper panel illustrates the grand-averaged topographical distributions for the P1 component (at 100 ms poststimulus). The lower panel shows the grand-averaged ERP time courses for in-phase (orange dotted line) and out-of-phase (blue solid line) stimulation at the O1 electrode. Topographies are displayed in the order of in-phase (left) and out-of-phase (right) tACS. The view of the topography is from the vertex perspective with the nose at the top of the image. For ERP time courses, time zero indicates stimulus onset. The error bands indicate the standard errors of the mean, and the asterisks represent statistical significance (*p < 0.05)
Fig. 7
Fig. 7
Phase-dependent tACS-mediated topographical maps and time courses of N2 and LSP in the incongruent condition. The upper panel illustrates the grand-averaged topographical distributions for the (A) N2 (at 225 ms poststimulus) and (B) LSP (averaged over 550 to 800 ms poststimulus). The lower panel shows the grand-averaged ERP time courses for the in-phase (orange dotted line) and out-of-phase (blue solid line) stimulation at the electrode FCz. Topographies are displayed in the order of in-phase (left) and out-of-phase (right) tACS. The view of the topography is from the vertex, with the nose at the top of the image. For ERP time courses, time zero indicates stimulus onset. The error bands indicate the standard errors of the mean, and the asterisks represent statistical significance (*p < 0.05)
Fig. 8
Fig. 8
Phase-dependent tACS-mediated topographical maps of prestimulus theta and alpha power in the incongruent condition. (A) The topographical maps show the grand-averaged prestimulus theta (500 to 200 ms prestimulus) and alpha (400 to 100 ms prestimulus) power distributions given in the order of in-phase (left) and out-of-phase (right) stimulation. The view of the topography is from the vertex perspective with the nose at the top of the image. (B) The time-frequency plots represent the spectral power of total activity at the electrode Fz. Time 0 indicates stimulus onset. The color bar indicates the power (µV2). (C) Comparison of prestimulus spectral power (µV2; in the frontocentral region averaged across Fz, F1, F2, and FCz, from 400 to 200 ms prestimulus) between in-phase (red bars) and out-of-phase (blue bars) tACS treatments across the delta (1–4 Hz), theta (4–8 Hz), alpha (8–13 Hz), beta (13–30 Hz), and gamma (30–50 Hz) bands. The error bars indicate the standard errors of the mean, and the asterisks represent statistical significance (*p < 0.05). Note the phase-dependent tACS-mediated significant differences particularly in theta and alpha bands

Similar articles

Cited by

References

    1. Miller EK, Cohen JD. An integrative theory of prefrontal cortex function. Annu Rev Neurosci. 2001;24:167–202. doi: 10.1146/annurev.neuro.24.1.167. - DOI - PubMed
    1. Fusco G, Scandola M, Feurra M, Pavone EF, Rossi S, Aglioti SM. Midfrontal theta transcranial alternating current stimulation modulates behavioural adjustment after error execution. Eur J Neurosci. 2018;48(10):3159–70. doi: 10.1111/ejn.14174. - DOI - PubMed
    1. Lehr A, Henneberg N, Nigam T, Paulus W, Antal A. Modulation of conflict processing by theta-range tacs over the dorsolateral prefrontal cortex. Neural Plast. 2019;2019:6747049. - PMC - PubMed
    1. Klirova M, Vorackova V, Horacek J, Mohr P, Jonas J, Dudysova DU, Kostylkova L, Fayette D, Krejcova L, Baumann S, et al. Modulating inhibitory control processes using Individualized High Definition Theta Transcranial Alternating current stimulation (HD theta-tACS) of the Anterior Cingulate and Medial Prefrontal Cortex. Front Syst Neurosci. 2021;15:611507. doi: 10.3389/fnsys.2021.611507. - DOI - PMC - PubMed
    1. Jones KT, Johnson EL, Gazzaley A, Zanto TP. Structural and functional network mechanisms of rescuing cognitive control in aging. NeuroImage. 2022;262:119547. doi: 10.1016/j.neuroimage.2022.119547. - DOI - PMC - PubMed

Publication types

LinkOut - more resources