

The Optimal Speech-to-Background Ratio for Balancing Speech Recognition With Environmental Sound Recognition
- PMID: 38816900
- PMCID: PMC11493516
- DOI: 10.1097/AUD.0000000000001532
The Optimal Speech-to-Background Ratio for Balancing Speech Recognition With Environmental Sound Recognition
Abstract
Objectives: This study aimed to determine the speech-to-background ratios (SBRs) at which normal-hearing (NH) and hearing-impaired (HI) listeners can recognize both speech and environmental sounds when the two types of signals are mixed. Also examined were the effect of individual sounds on speech recognition and environmental sound recognition (ESR), and the impact of divided versus selective attention on these tasks.
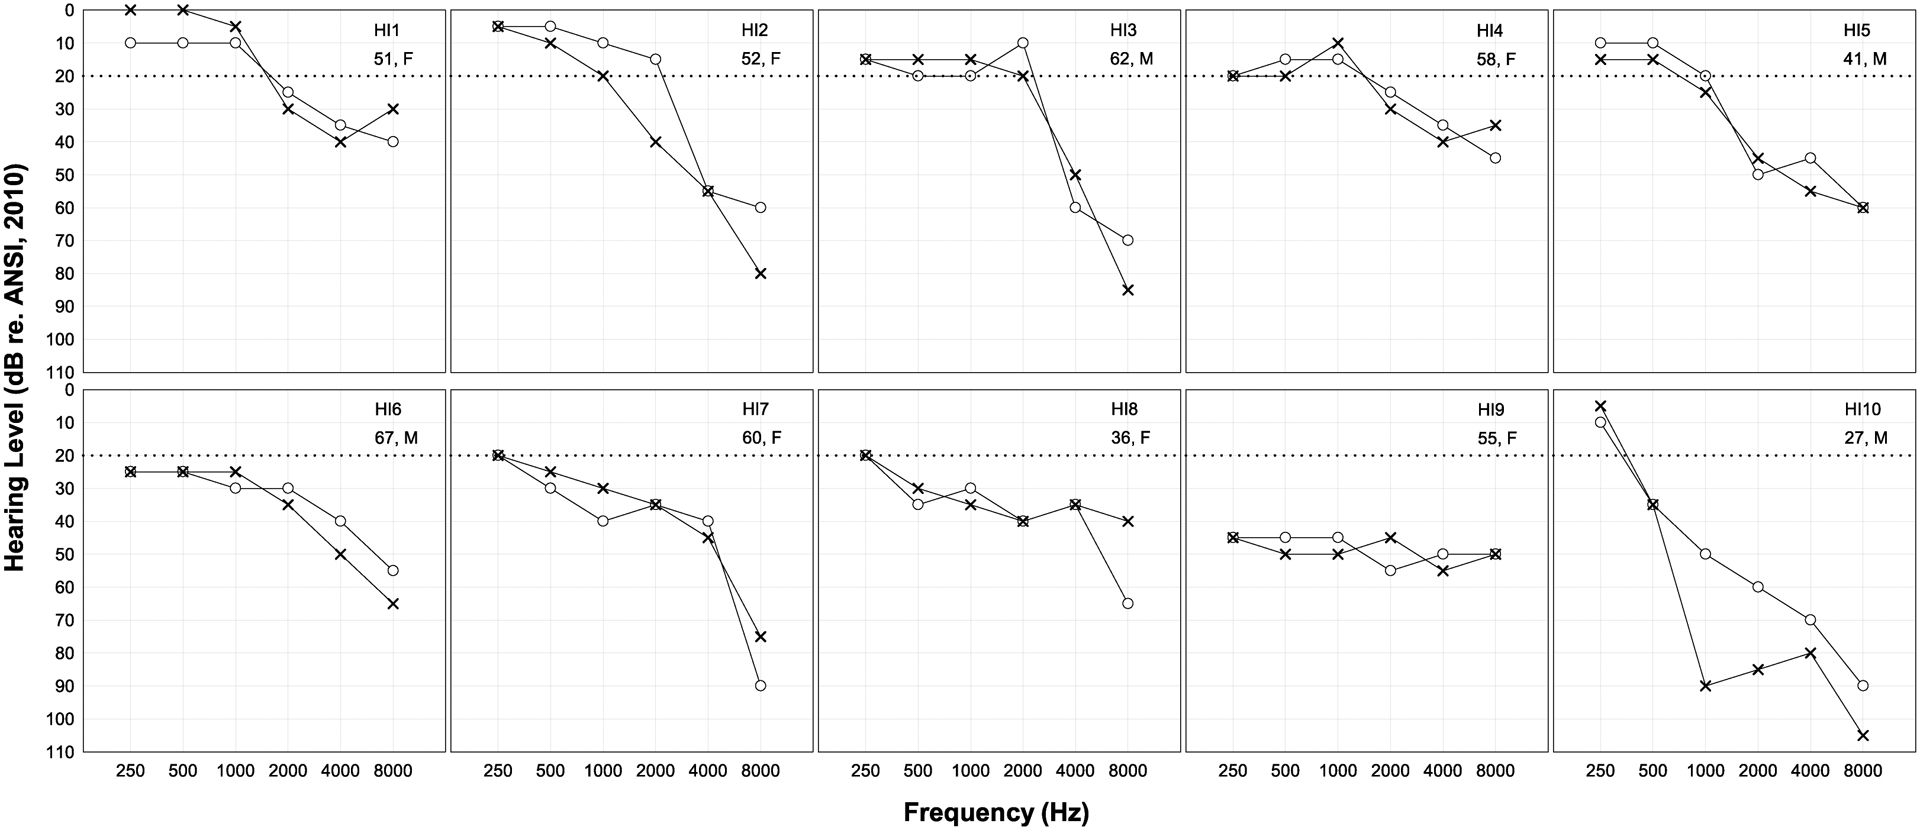
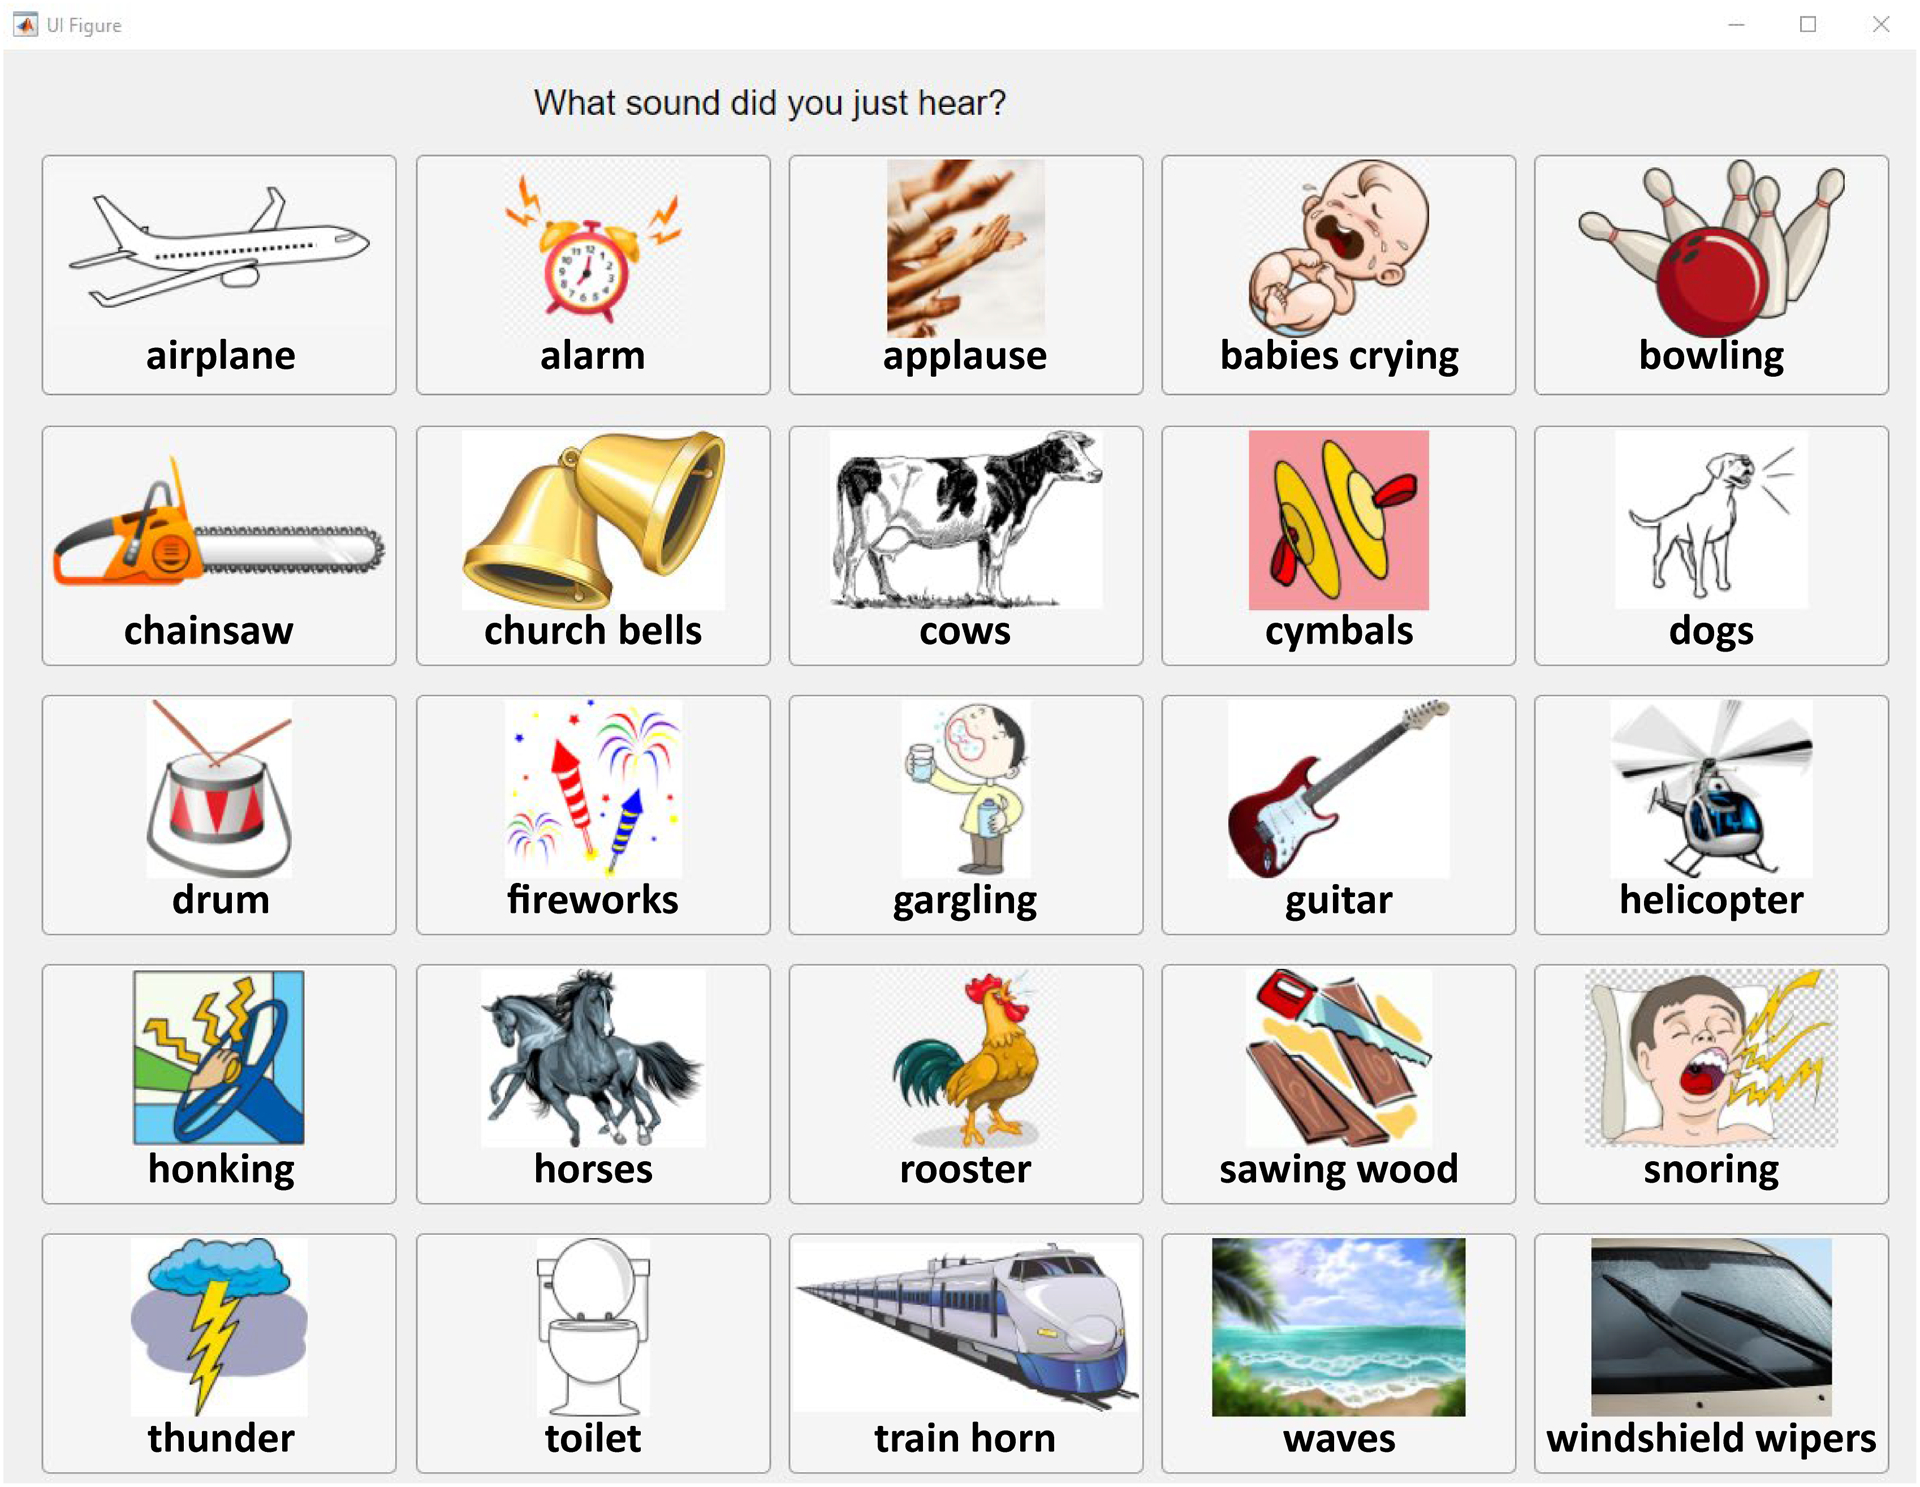
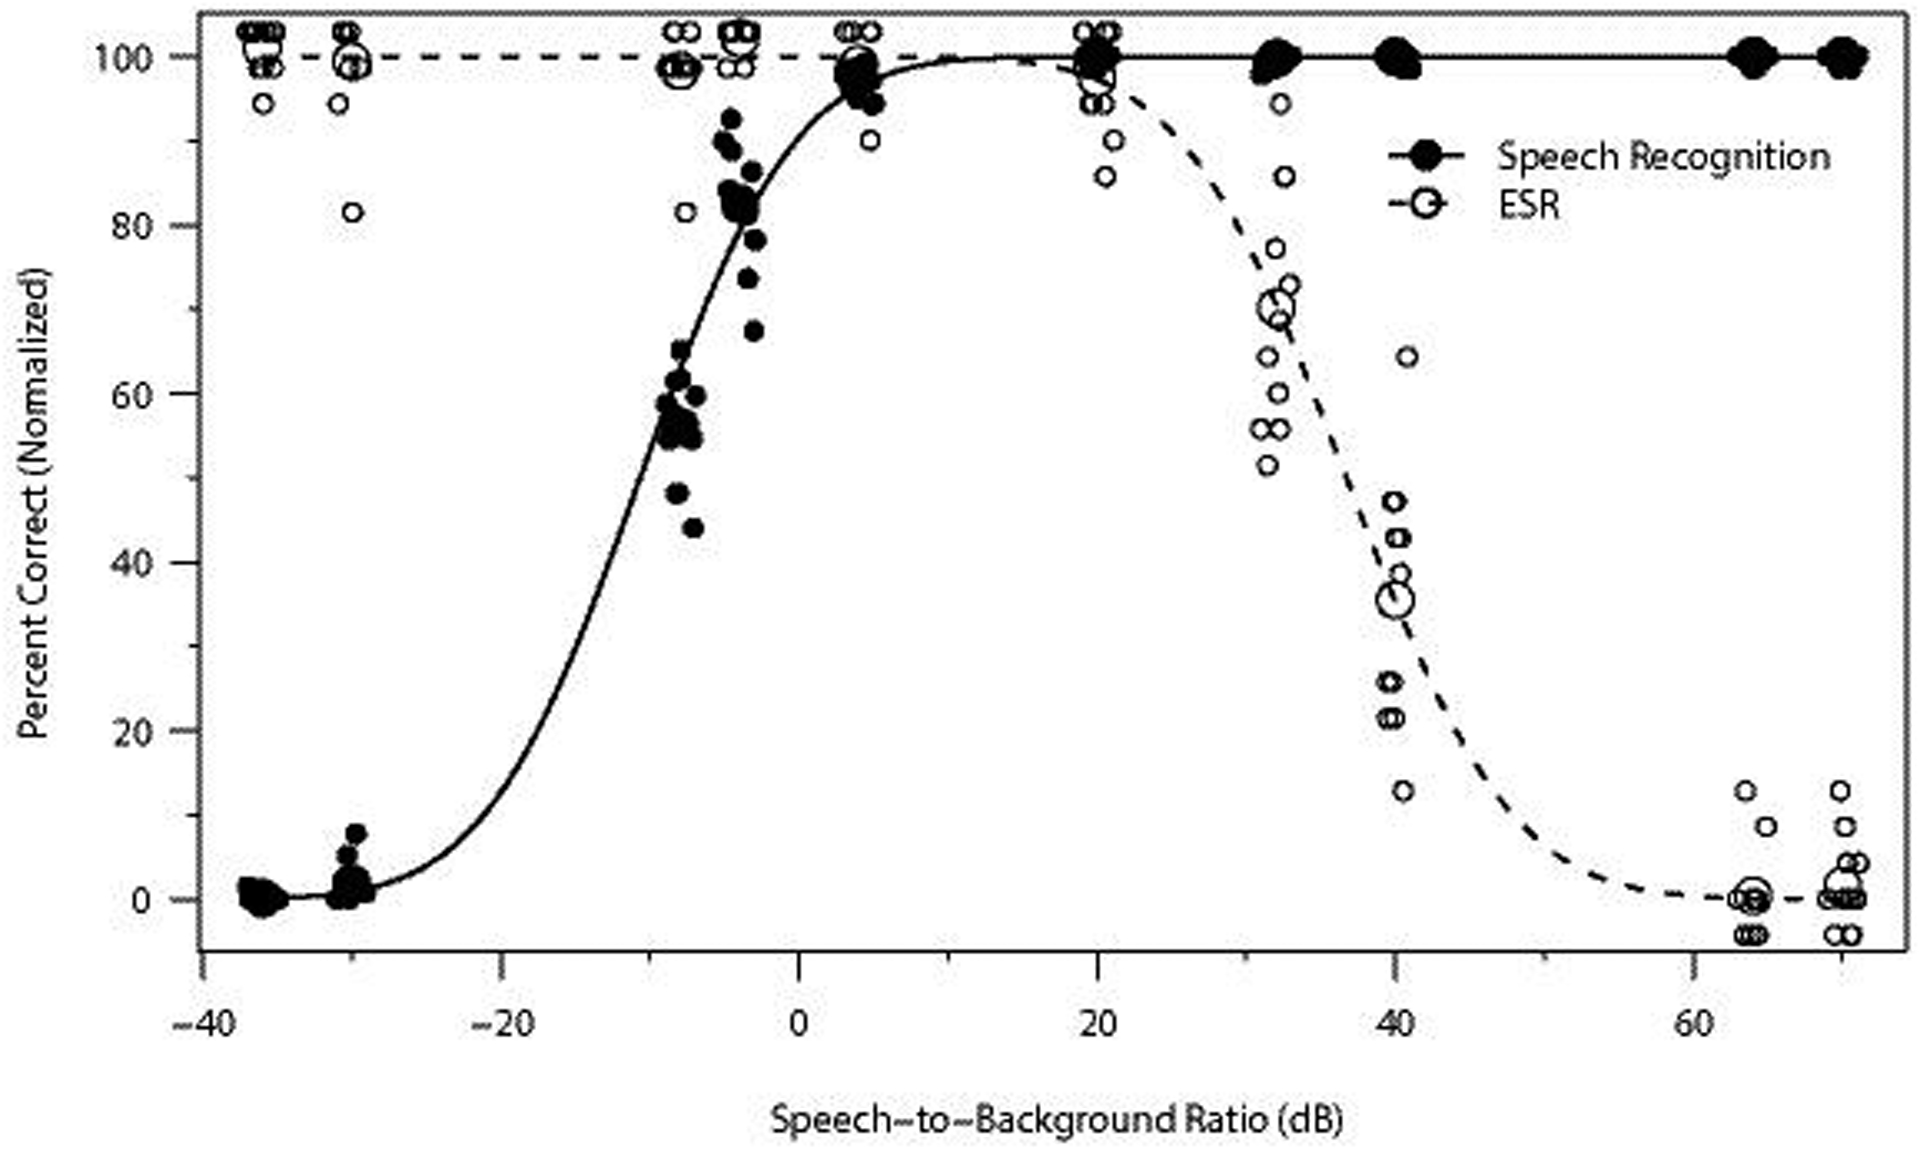
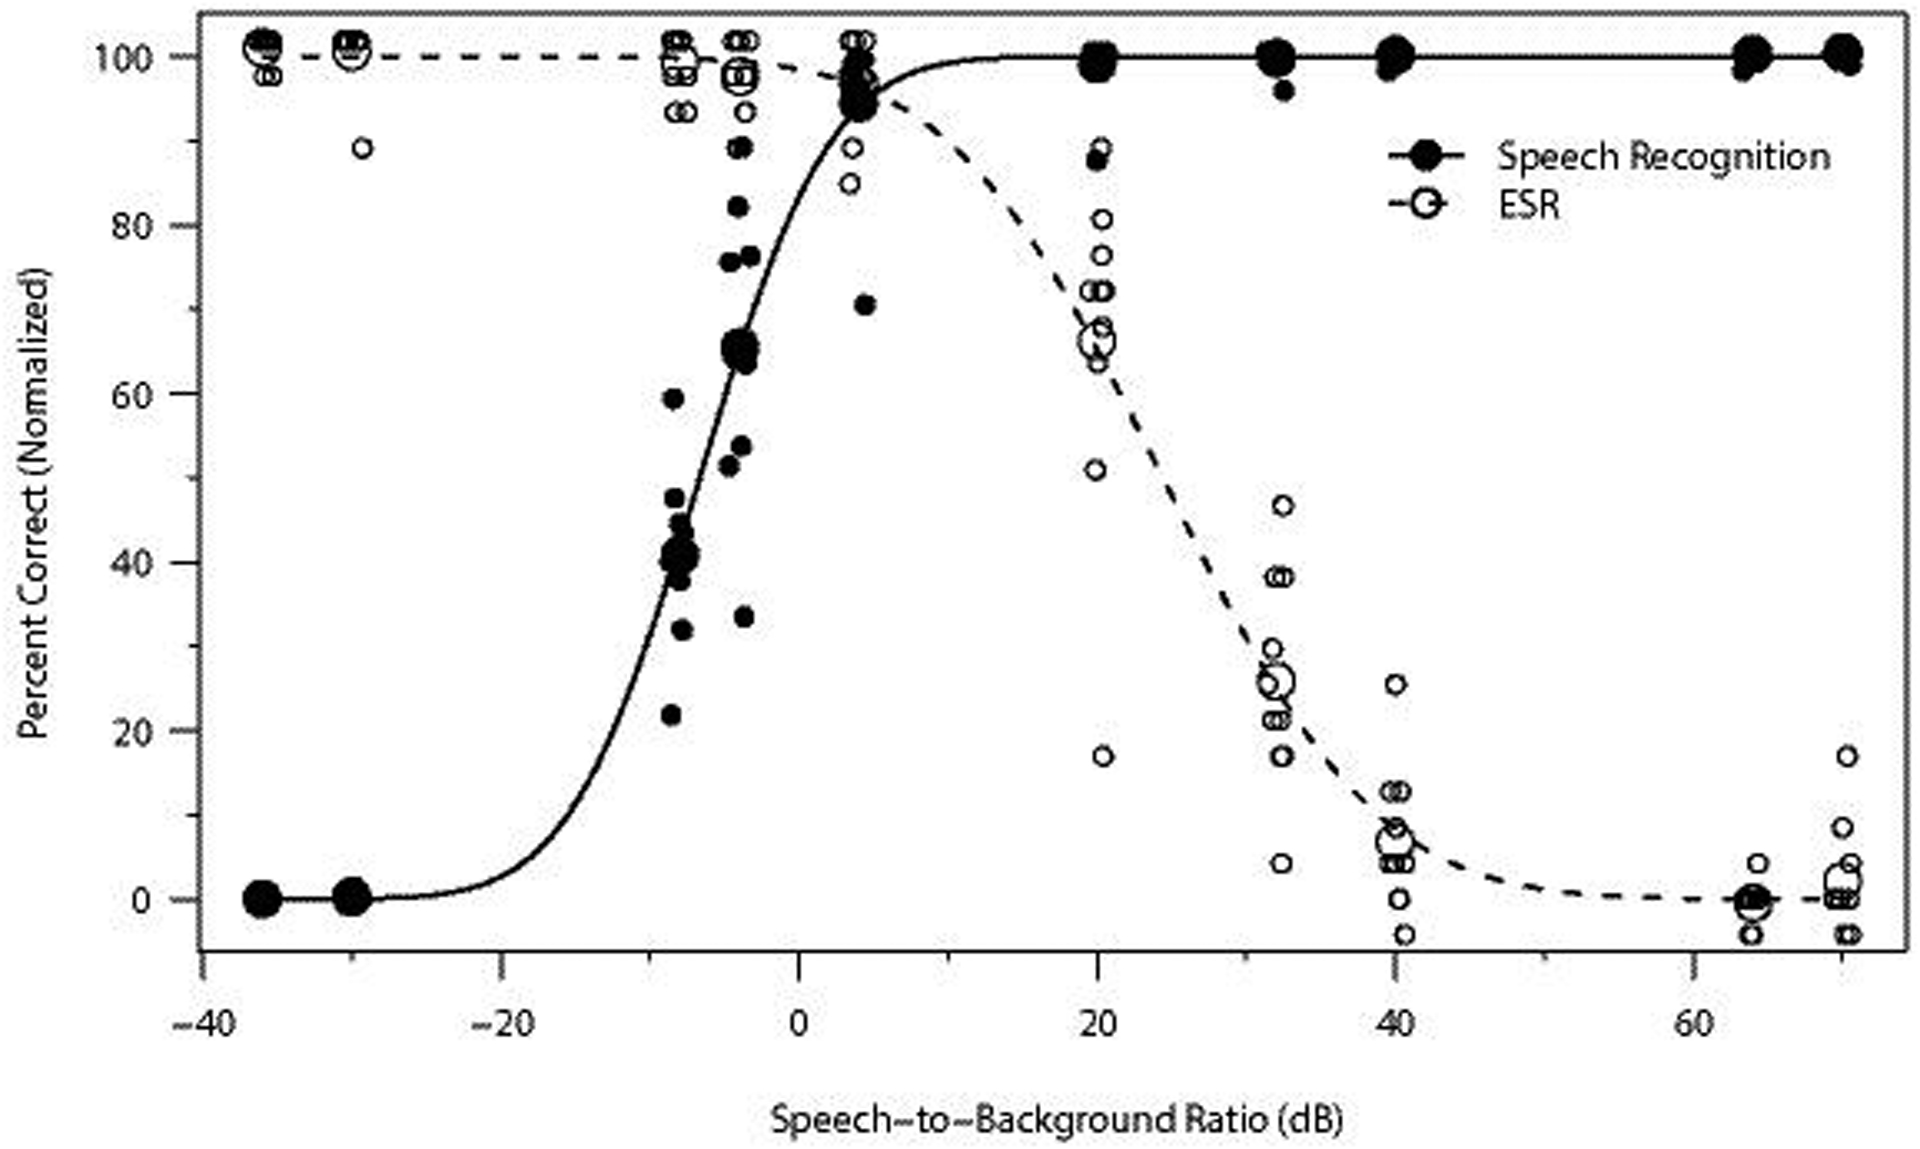
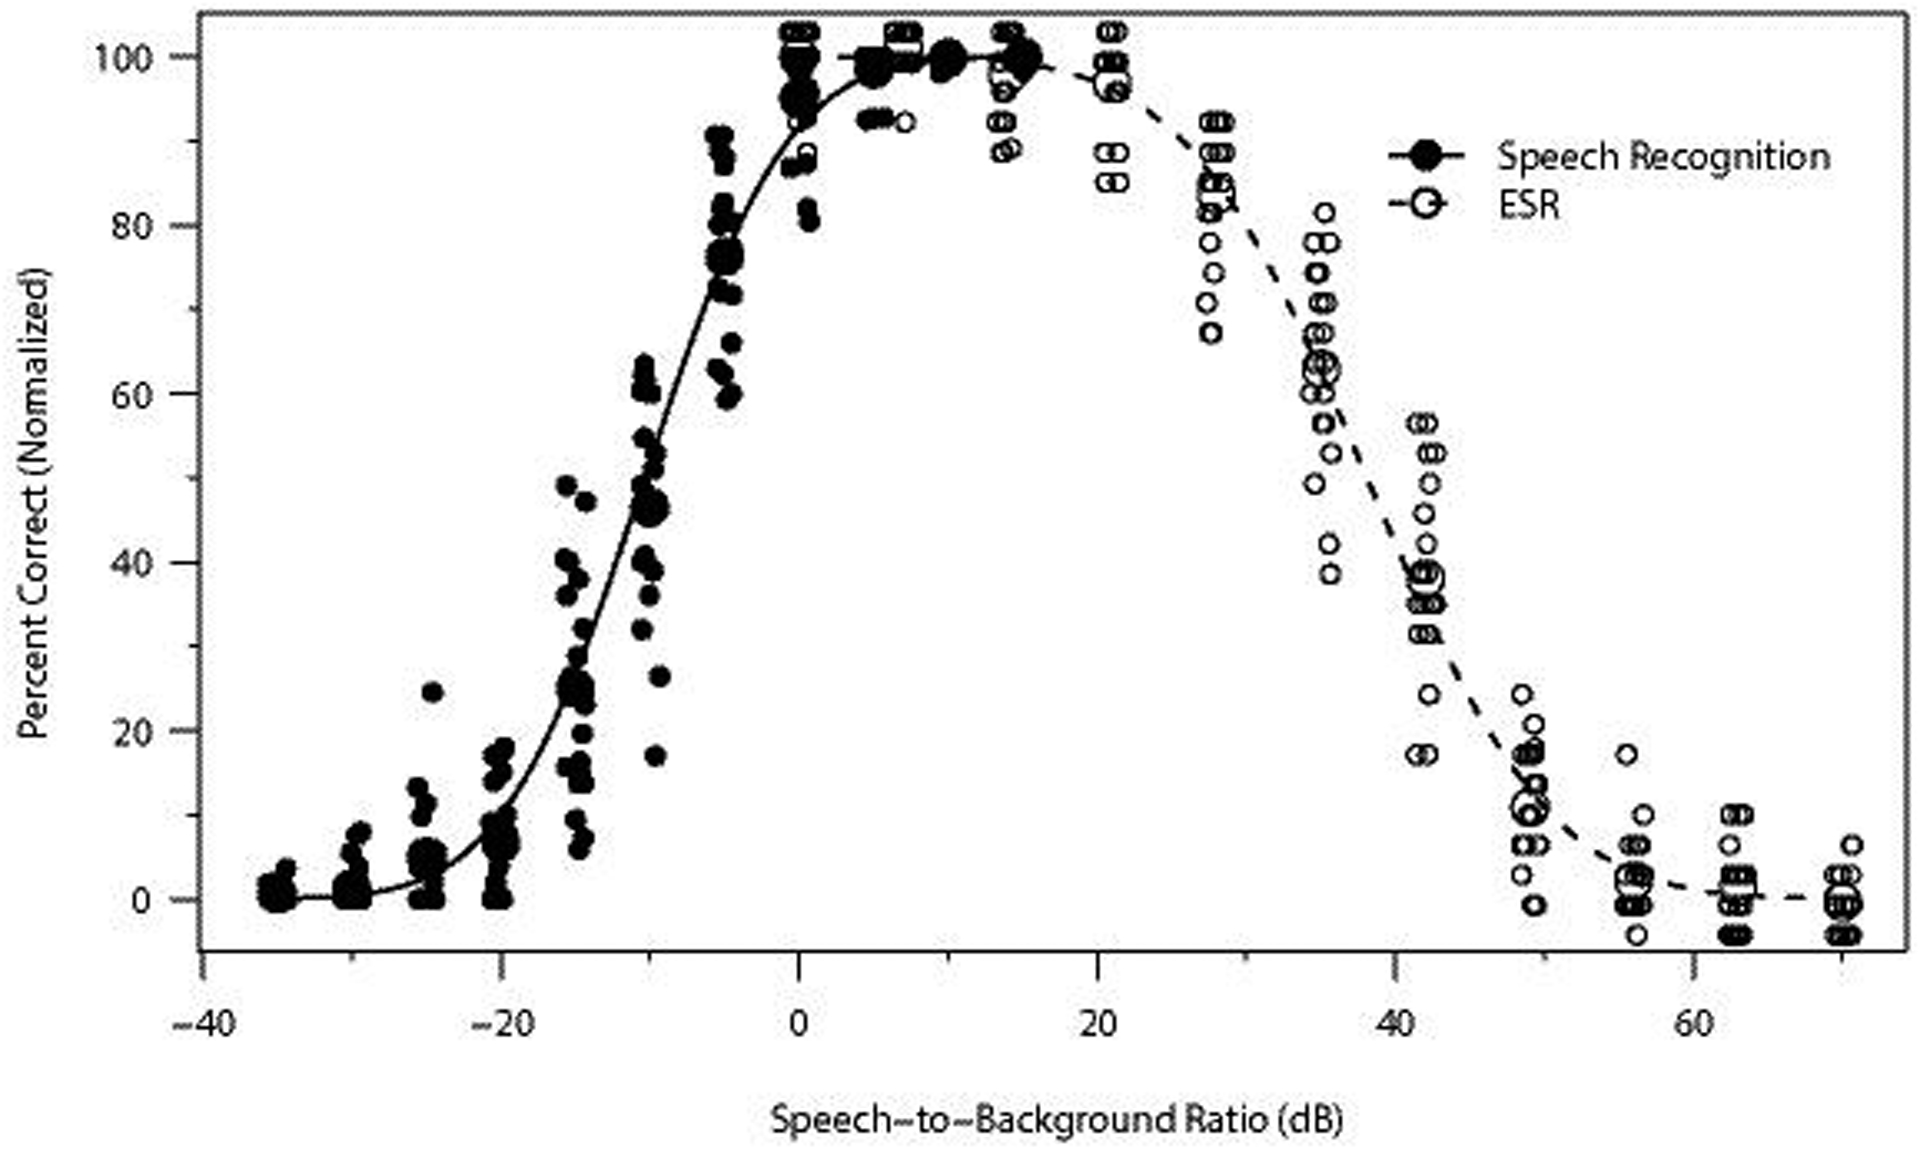
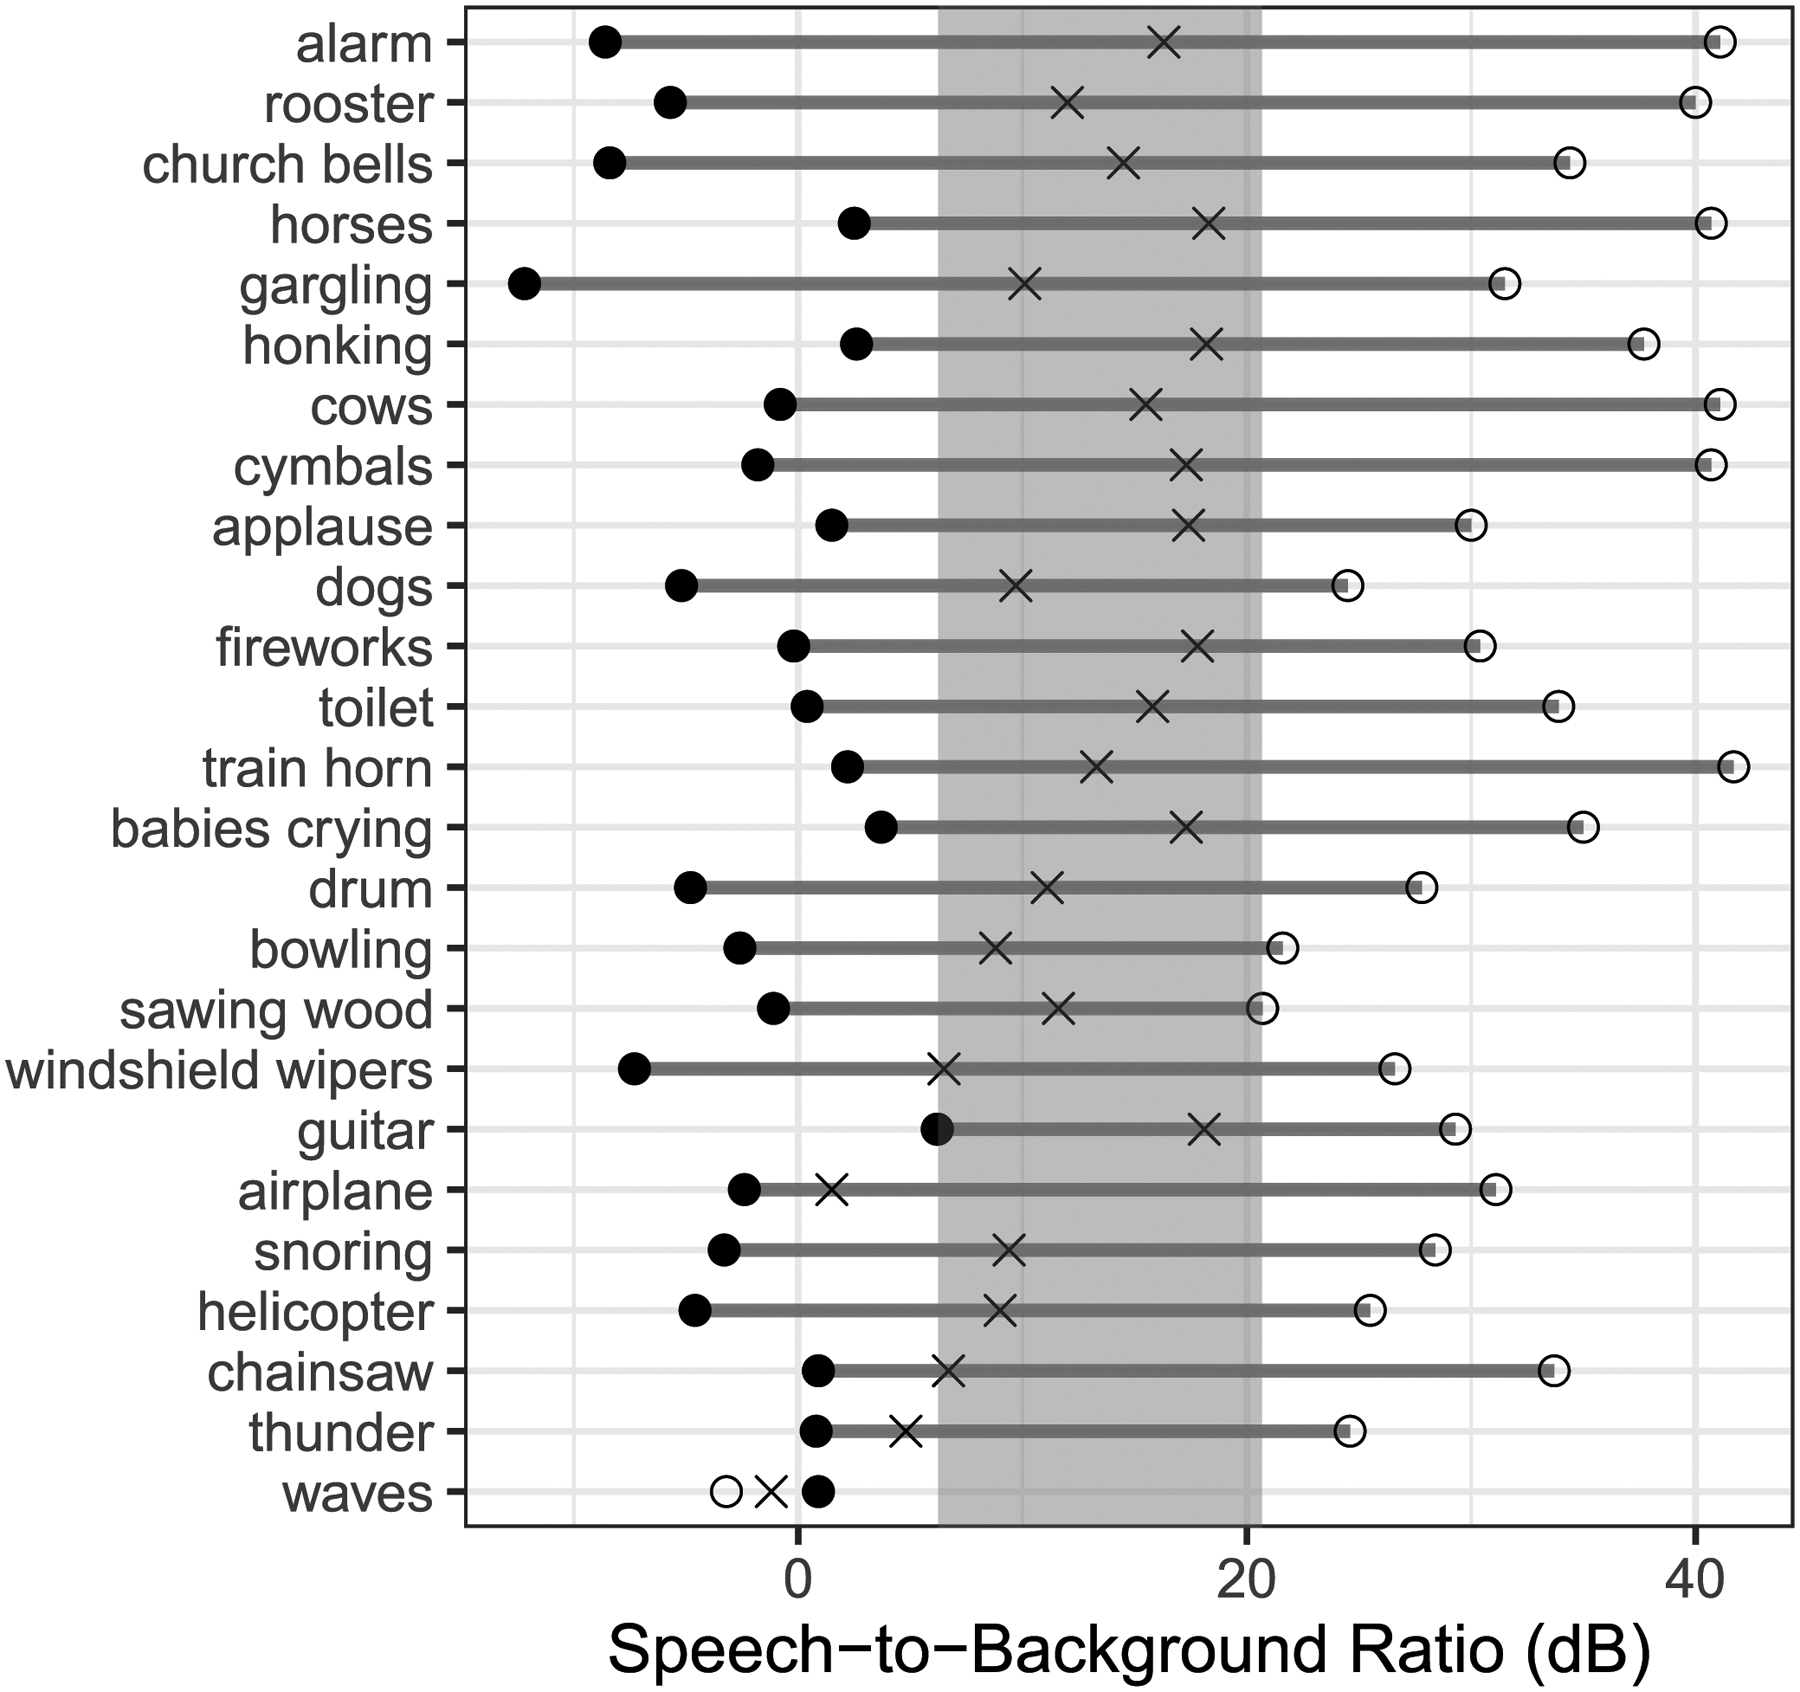
Design: In Experiment 1 (divided attention), 11 NH and 10 HI listeners heard sentences mixed with environmental sounds at various SBRs and performed speech recognition and ESR tasks concurrently in each trial. In Experiment 2 (selective attention), 20 NH listeners performed these tasks in separate trials. Psychometric functions were generated for each task, listener group, and environmental sound. The range over which speech recognition and ESR were both high was determined, as was the optimal SBR for balancing recognition with ESR, defined as the point of intersection between each pair of normalized psychometric functions.
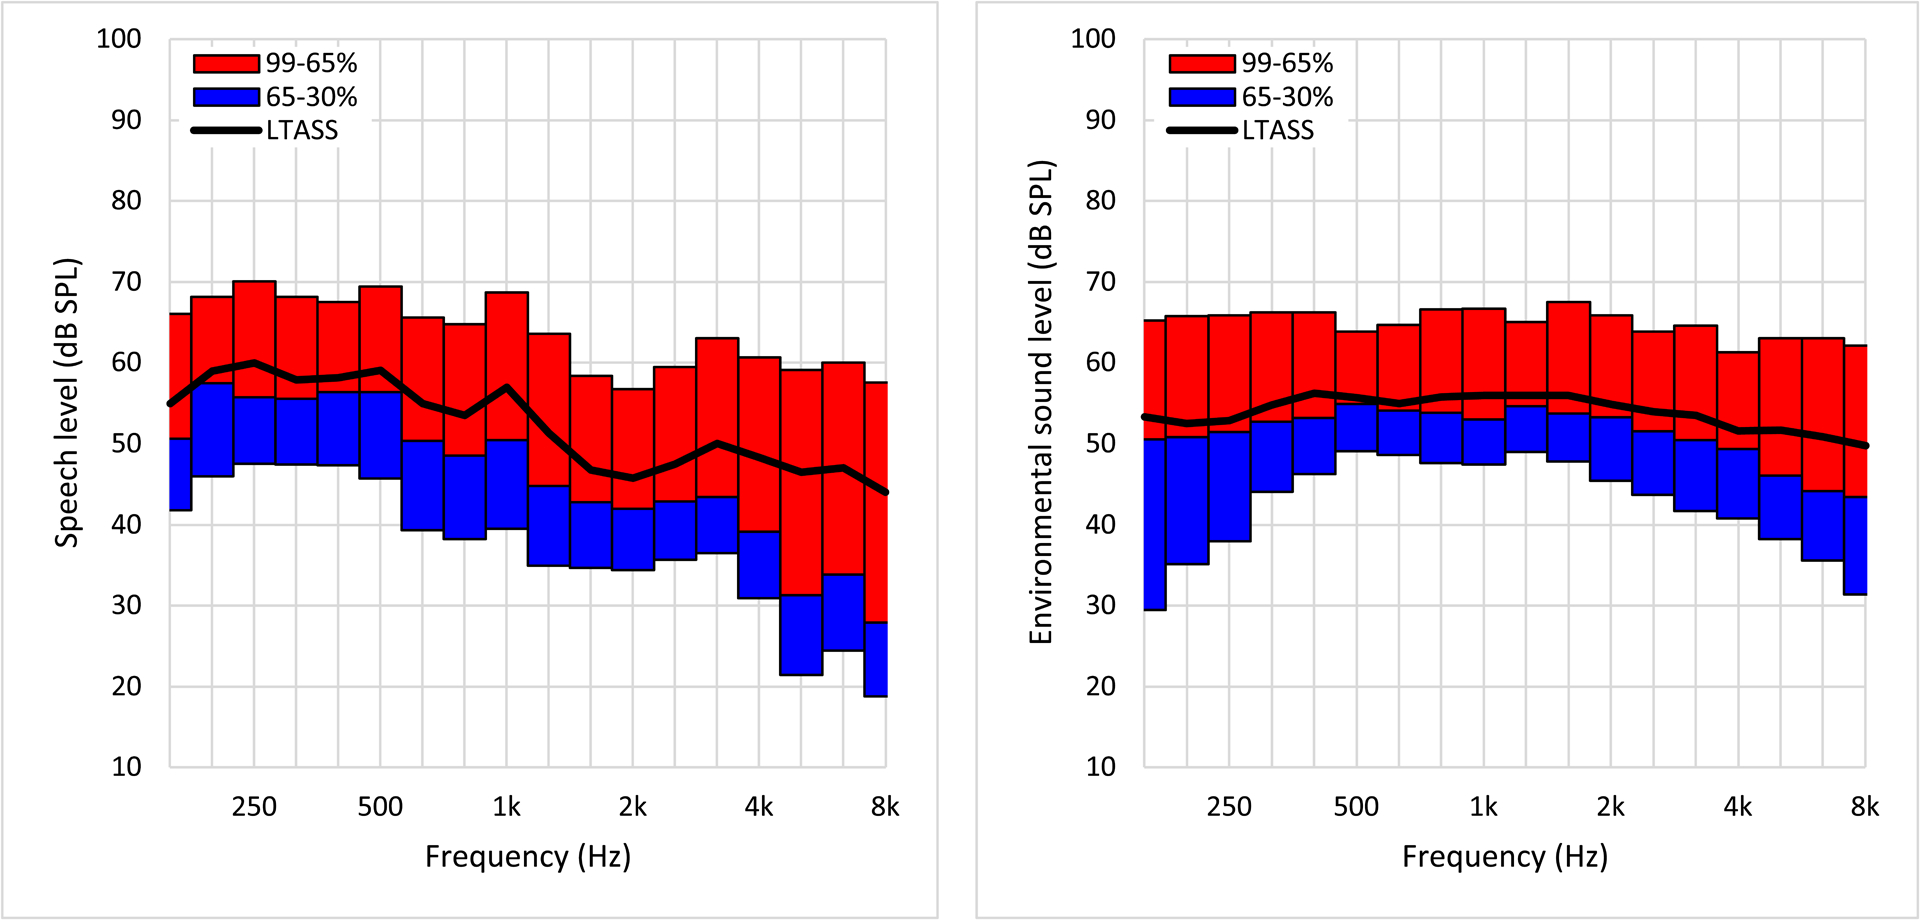
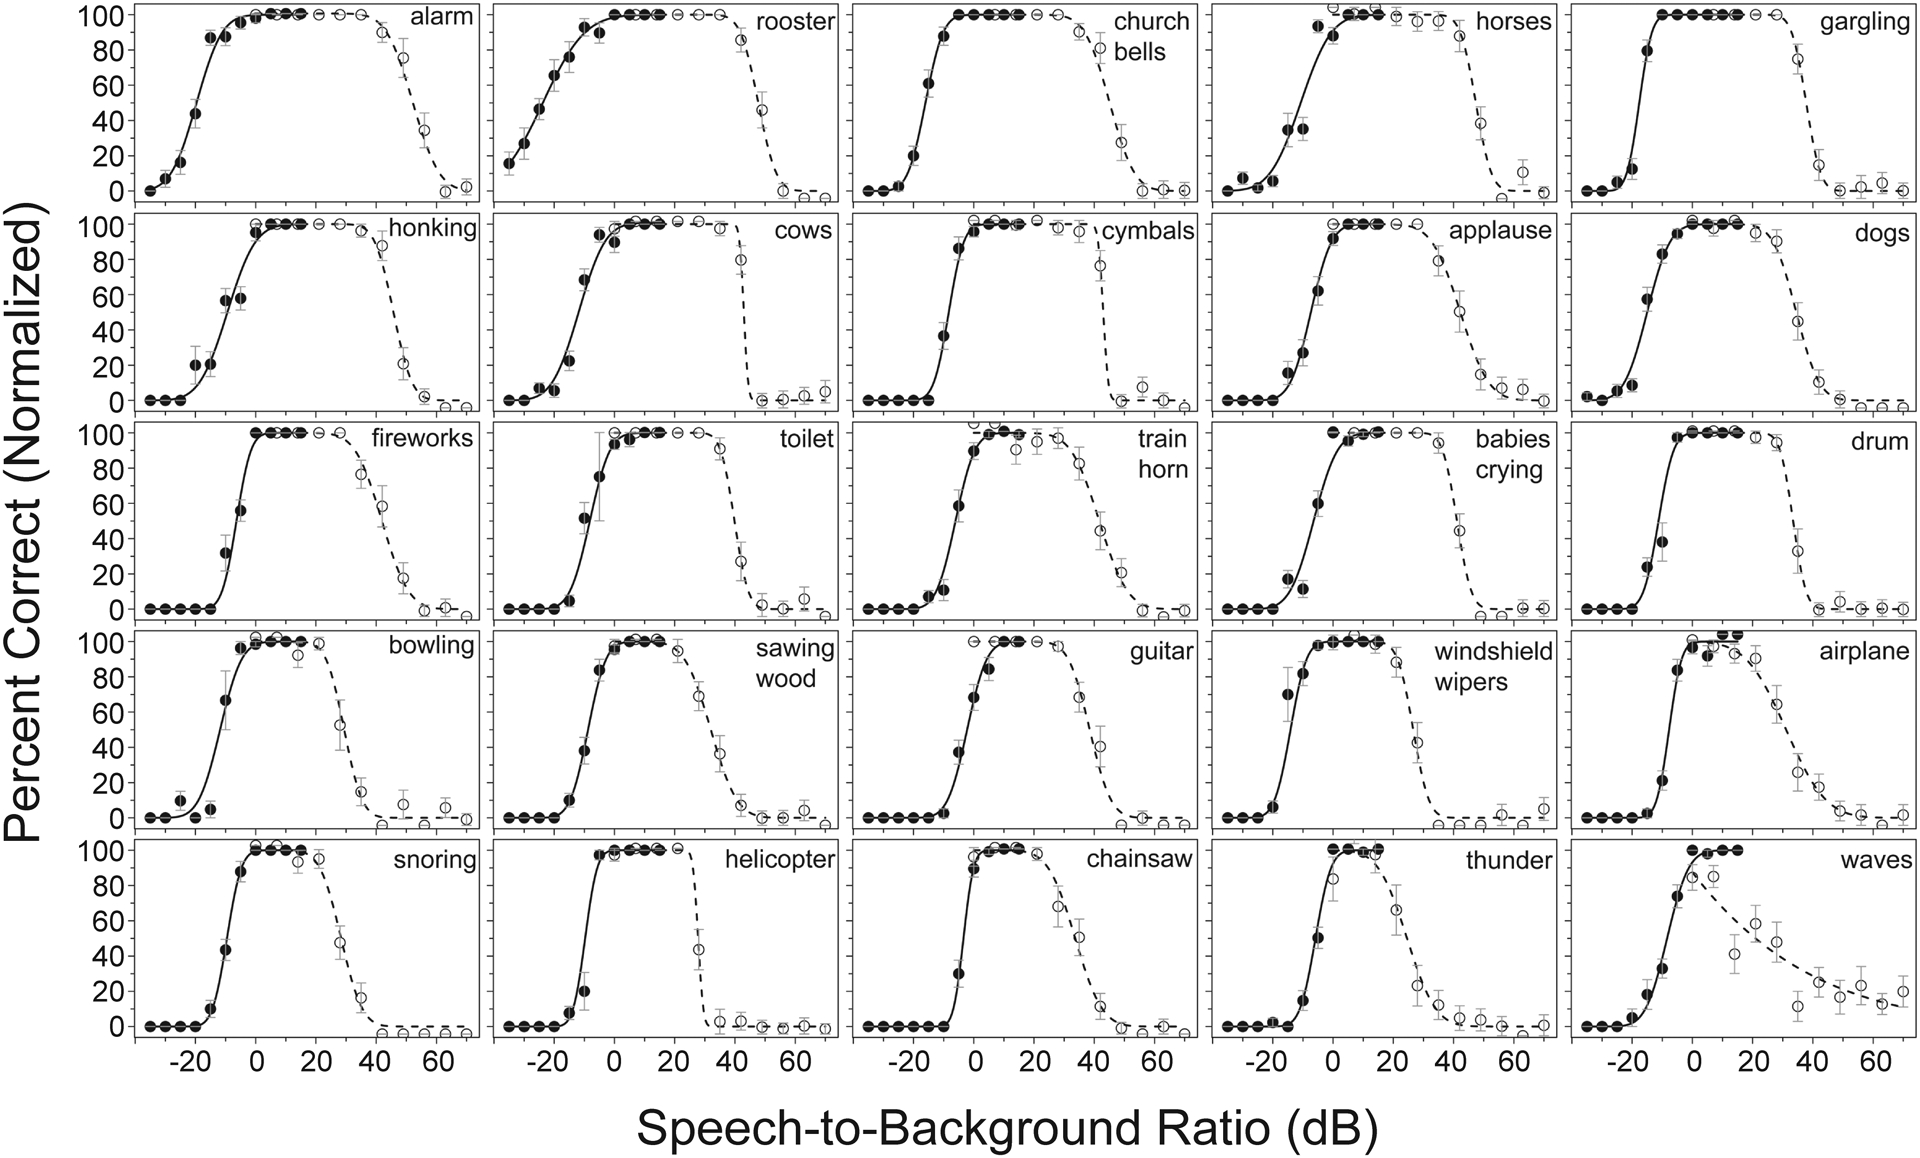
Results: The NH listeners achieved greater than 95% accuracy on concurrent speech recognition and ESR over an SBR range of approximately 20 dB or greater. The optimal SBR for maximizing both speech recognition and ESR for NH listeners was approximately +12 dB. For the HI listeners, the range over which 95% performance was observed on both tasks was far smaller (span of 1 dB), with an optimal value of +5 dB. Acoustic analyses indicated that the speech and environmental sound stimuli were similarly audible, regardless of the hearing status of the listener, but that the speech fluctuated more than the environmental sounds. Divided versus selective attention conditions produced differences in performance that were statistically significant yet only modest in magnitude. In all conditions and for both listener groups, recognition was higher for environmental sounds than for speech when presented at equal intensities (i.e., 0 dB SBR), indicating that the environmental sounds were more effective maskers of speech than the converse. Each of the 25 environmental sounds used in this study (with one exception) had a span of SBRs over which speech recognition and ESR were both higher than 95%. These ranges tended to overlap substantially.
Conclusions: A range of SBRs exists over which speech and environmental sounds can be simultaneously recognized with high accuracy by NH and HI listeners, but this range is larger for NH listeners. The single optimal SBR for jointly maximizing speech recognition and ESR also differs between NH and HI listeners. The greater masking effectiveness of the environmental sounds relative to the speech may be related to the lower degree of fluctuation present in the environmental sounds as well as possibly task differences between speech recognition and ESR (open versus closed set). The observed differences between the NH and HI results may possibly be related to the HI listeners' smaller fluctuating masker benefit. As noise-reduction systems become increasingly effective, the current results could potentially guide the design of future systems that provide listeners with highly intelligible speech without depriving them of access to important environmental sounds.
Copyright © 2024 Wolters Kluwer Health, Inc. All rights reserved.
Conflict of interest statement
The authors have no conflicts of interest to disclose.
Figures
Similar articles
-
Speech intelligibility benefits of hearing AIDS at various input levels.J Am Acad Audiol. 2015 Mar;26(3):275-88. doi: 10.3766/jaaa.26.3.7. J Am Acad Audiol. 2015. PMID: 25751695
-
Subjective Speech Intelligibility Drives Noise-Tolerance Domain Use During the Tracking of Noise-Tolerance Test.Ear Hear. 2024 Nov-Dec 01;45(6):1484-1495. doi: 10.1097/AUD.0000000000001536. Epub 2024 Jun 17. Ear Hear. 2024. PMID: 38880961
-
Impact of stimulus-related factors and hearing impairment on listening effort as indicated by pupil dilation.Hear Res. 2017 Aug;351:68-79. doi: 10.1016/j.heares.2017.05.012. Epub 2017 May 25. Hear Res. 2017. PMID: 28622894
-
Speech recognition in fluctuating and continuous maskers: effects of hearing loss and presentation level.J Speech Lang Hear Res. 2004 Apr;47(2):245-56. doi: 10.1044/1092-4388(2004/020). J Speech Lang Hear Res. 2004. PMID: 15157127
-
Suprathreshold auditory processing and speech perception in noise: hearing-impaired and normal-hearing listeners.J Am Acad Audiol. 2013 Apr;24(4):274-92. doi: 10.3766/jaaa.24.4.4. J Am Acad Audiol. 2013. PMID: 23636209
Cited by
-
An ideal compressed mask for increasing speech intelligibility without sacrificing environmental sound recognitiona).J Acoust Soc Am. 2024 Dec 1;156(6):3958-3969. doi: 10.1121/10.0034599. J Acoust Soc Am. 2024. PMID: 39666959
-
Sounds of Nature and Hearing Loss: A Call to Action.Ear Hear. 2025 Mar-Apr 01;46(2):298-304. doi: 10.1097/AUD.0000000000001601. Epub 2024 Nov 7. Ear Hear. 2025. PMID: 39506198 Free PMC article.
References
-
- Alhanbali S, Dawes P, Lloyd S, Munro KJ (2017). Self-reported listening-related effort and fatigue in hearing-impaired adults. Ear Hear, 38, e39–e48. - PubMed
-
- ANSI (1997). “ANSI S3.5–1997, American national standard methods for calculation of the speech intelligibility index” (American National Standards Institute, New York: ).
-
- ANSI (2004). S3.21 (R2009), American National Standard Methods for Manual Pure-Tone Threshold Audiometry (American National Standards Institute, New York: ).
-
- ANSI (2010). S3.6, American National Standard Specification for Audiometers (American National Standards Institute, New York: ).
-
- Aniansson G (1978). Speech intelligibility in and speech interference levels of traffic noise in hearing-impaired and normal listeners. Acta Oto-Laryngologica, 86, 109–112. - PubMed
Publication types
MeSH terms
Grants and funding
LinkOut - more resources
Full Text Sources
Research Materials
Miscellaneous
