. 2024 Mar 27;6(11):2838-2849.
doi: 10.1039/d3na00904a. eCollection 2024 May 29.

Demonstration of tritium adsorption on graphene

Affiliations

Demonstration of tritium adsorption on graphene

Genrich Zeller et al. Nanoscale Adv. .

Abstract

In this work, we report on studies of graphene exposed to tritium gas in a controlled environment. The single layer graphene on a SiO2/Si substrate was exposed to 400 mbar of T2, for a total time of ∼55 h. The resistivity of the graphene sample was measured in situ during tritium exposure using the van der Pauw method. We found that the sheet resistance increases by three orders of magnitude during the exposure, suggesting significant chemisorption of tritium. After exposure, the samples were characterised ex situ via spatio-chemical mapping with a confocal Raman microscope, to study the effect of tritium on the graphene structure (tritiation yielding T-graphene), as well as the homogeneity of modifications across the whole area of the graphene film. The Raman spectra after tritium exposure were comparable to previously observed results in hydrogen-loading experiments, carried out by other groups. By thermal annealing we also could demonstrate, using Raman spectral analysis, that the structural changes were largely reversible. Considering all observations, we conclude that the graphene film was at least partially tritiated during the tritium exposure, and that the graphene film by and large withstands the bombardment by electrons from the β-decay of tritium, as well as by energetic primary and secondary ions.


Conflict of interest statement

There are no conflicts to declare.

Figures

Fig. 1
Fig. 1. Experimental setup of the tritium loading-chamber. (a) 3D-view of technical drawing of the loading chamber, and cross-section view of the contacted and heated sample holder. (b) Sample holder with 4 graphene samples, one electrically contacted (centre) and three without contacts.
Fig. 2
Fig. 2. Measurement methodology for tritium-exposed graphene samples. Top – exposure of sample to tritium, followed by repeated heating cycles (monitored in situ by resistance measurement); bottom – ex situ characterisation measurements. For details, see text.
Fig. 3
Fig. 3. Change of graphene sheet resistance, Rs, during tritium exposure. (A) – Initial increase of Rs when the loading chamber is filled with tritium. (B) – Plateau reached for Rs after ∼50 h of tritium exposure. (C) – Full temporal evolution of Rs during tritium exposure (orange line = generalized logistic fit to the data).
Fig. 4
Fig. 4. Raman spectra of a graphene sample (A), and intensity ratio ID/IG and normalized (w2D-pristine = 1) width of the 2D-peak w2D (B) prior to tritium exposure (pristine), post-tritium exposure, and after heating the post-tritium-exposure sample: 1st for 3.5 h at 300 °C, 2nd for 21 h at 300 °C, and 3rd for 22 h at 500 °C. Raman spectra are shown with a fixed offset for clarity. Key Raman spectral features are annotated.
Fig. 5
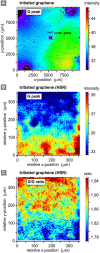
Fig. 5. Raman spectroscopic maps of a graphene-on-SiO2/Si sample (Graphenea). (A) Raman map of the graphene G-peak signal, for the full 10 × 10 mm2 sample, post-tritium exposure; step size ΔS = 62.5 μm. (B) Raman map of the graphene G-peak signal, for a 350 × 350 μm2 sample section, post-tritium exposure; step size ΔS = 5 μm. (C) Graphene D/G Raman peak ratio map, post-tritium exposure; step size ΔS = 5 μm. Note: HSR = high spatial resolution.

References

    1. Novoselov K. S. Geim A. K. Morozov S. V. Jiang D. Zhang Y. Dubonos S. V. et al., Electric field effect in atomically thin carbon films. Science. 2004;306:666–669. doi: 10.1126/science.1102896. doi: 10.1126/science.1102896. - DOI - DOI - PubMed
    1. Castellanos-Gomez A. Wojtaszek M. Arramel N. T. Tombros N. van Wees B. J. Reversible hydrogenation and bandgap opening of graphene and graphite surfaces probed by scanning tunneling spectroscopy. Small. 2012;8:1607–1613. doi: 10.1002/smll.201101908. doi: 10.1002/smll.201101908. - DOI - DOI - PubMed
    1. Fei Y. Fang S. Hu Y. H. Synthesis, properties and potential applications of hydrogenated graphene. Chem. Eng. J. 2020;397:125408. doi: 10.1016/j.cej.2020.125408. doi: 10.1016/j.cej.2020.125408. - DOI - DOI
    1. Elias D. C. Nair R. R. Mohiuddin T. M. G. Morozov S. V. Blake P. Halsall M. P. et al., Control of graphene's properties by reversible hydrogenation: evidence for graphane. Science. 2009;323:610–613. doi: 10.1126/science.1167130. doi: 10.1126/science.1167130. - DOI - DOI - PubMed
    1. Dzhurakhalov A. A. Peeters F. M. Structure and energetics of hydrogen chemisorbed on a single graphene layer to produce graphane. Carbon. 2011;49:3258–3266. doi: 10.1016/j.carbon.2011.03.052. doi: 10.1016/j.carbon.2011.03.052. - DOI - DOI