. 2024 Apr 22;15(21):8112-8126.
doi: 10.1039/d4sc00891j. eCollection 2024 May 29.

DNA-directed formation of plasmonic core-satellite nanostructures for quantification of hepatitis C viral RNA

Affiliations

DNA-directed formation of plasmonic core-satellite nanostructures for quantification of hepatitis C viral RNA

Siddhant Jaitpal et al. Chem Sci. .

Abstract

Hepatitis C virus (HCV) continues to be a significant public health challenge, affecting an estimated 71 million people globally and posing risks of severe liver diseases. Despite advancements in treatments, diagnostic limitations hinder the global elimination efforts targeted by 2030. This study introduces an innovative diagnostic approach, integrating catalytic hairpin assembly (CHA) with plasmonic core-satellite gold nanoparticle (AuNP) assemblies, to enable sensitive and specific detection of HCV RNA. We optimized the stoichiometry of DNA hairpins to form highly stable three-way junctions (3WJs), minimizing non-specific reactions in an enzyme-free, isothermal amplification process. The resulting dual-transduction biosensor combines colorimetric and surface-enhanced Raman spectroscopy (SERS) techniques, utilizing the Raman reporter malachite green isothiocyanate (MGITC) for signal generation. Our system targets a conserved 23-nucleotide sequence within the HCV 5'-UTR, essential for RNA replication, facilitating pan-genotypic HCV detection that complements direct-acting antiviral strategies. We evaluated the biosensor's efficacy using fluorescence spectroscopy, native PAGE, AFM, and TEM. Findings indicate that the 60 nm core AuNPs surrounded by 20 nm satellite AuNPs achieved a ten-fold increase in sensitivity over the 10 nm satellites, detecting HCV RNA concentrations as low as 1.706 fM. This sensitivity is crucial, given the extremely low viral loads present during early infection stages. Our research demonstrates the promise of enzyme-free molecular biosensors for HCV, with the potential to provide cost-efficient, rapid, point-of-care testing, although further sensitivity enhancements are needed to address the challenges of early-stage detection.


Conflict of interest statement

There are no conflicts to declare.

Figures

Fig. 1
Fig. 1. HCV-RNA catalyzed hairpin amplification (CHA) mechanism. This schematic illustrates the cyclic process of HCV-RNA target sequence (TS) recognition and amplification through a series of hairpin structures and intermediate complexes. The diagram is color-coded according to the 9 complementary domains and annotated to depict the step-by-step formation and transformation of CHA complexes.
Fig. 2
Fig. 2. 15% native PAGE image highlighting the tentative assignment of CHA products. We prepared a range of sample mixtures for analysis: lane 1 contains H1; lane 2 has H2; lane 3 features H3; lane 4 includes a mixture of H1 and H3; lane 5 combines H1 and H2; lane 6 is composed of H2 with HCV RNA; lane 7 has H3 with HCV RNA; lane 8 includes H1 with HCV RNA; lane 9 combines H1, H3, and HCV RNA; lane 10 is a mix of H2 and H3; lane 11 features H2, H3, and HCV RNA; lane 12 contains H1, H2, and HCV RNA; lane 13 includes all three hairpins H1, H2, and H3; and lane 14 has the full set: H1, H2, H3, and HCV RNA. Colored dotted boxes on the gel correspond to the tentative products formed, as depicted in the schematic.
Fig. 3
Fig. 3. AFM analysis of the 3WJ CHA reaction. All AFM measurements were collected in height mode across an area of 500 × 500 nm2 using a Z range of 4 nm using hairpin concentrations (H1, H2, H3) of 1 μM and an HCV-RNA concentration of 10 nM. (A) AFM image for H1 incubated with HCV-RNA. (B) AFM image for H1 incubated with H2, and HCV RNA. (C) AFM image for H1 incubated with H2, and H3. (D) AFM image for H1 incubated with H2, H3, and HCV-RNA. (E) The plot of contour length distributions acquired from the AFM images.
Fig. 4
Fig. 4. Refinement of 3WJ CHA reaction conditions. (A) The plot shows the fluorescence intensity of the 3WJ CHA reaction at two H2 concentrations (25 & 50 nM), in the presence of 500 nM FAM-H1-quencher and H3 across varying HCV RNA concentrations (0.04–25 nM, with three replicates per concentration). (B) Displays the percentage increase in fluorescence intensity for 3WJ CHA products in two scenarios: group 1 (500 nM H1, 50 nM H2, plus the target sequence), and group 2 (500 nM H1 with the target sequence). This comparison aims to assess the role of H2 in stabilizing intermediate structures at HCV RNA concentrations (16 pM–10 nM, with three replicates per concentration). (C) Depicts the percentage reduction in fluorescence intensity, signaling the completion of the 3WJ CHA reaction and the recycling of the target, under two H3-quencher concentrations (300 & 400 nM) for HCV RNA concentrations (16 pM–10 nM, with three replicates per concentration). (D) The plot illustrates the decline in fluorescence intensity of the 3WJ CHA reaction after a 6 hour incubation period using 500 nM FAM-H1-quencher and 50 nM H2, followed by the addition of H3-quencher (300 & 400 nM). Measurements were taken after 1 hour for low-range HCV RNA concentrations (0.04–400 pM, with three replicates per concentration).
Fig. 5
Fig. 5. Visualization of core–satellite assembly via 3WJ-CHA. (A) The schematic details the sequential stages of core–satellite assembly formation driven by the 3WJ-CHA mechanism. (B–E) TEM images sequentially illustrate the core–satellite assemblies ranging from 60–10 nm in size, capturing the progressive stages of the reaction, with (B) showing the initial stage and (E) showing the final stage.
Fig. 6
Fig. 6. Colorimetric detection of the HCV-RNA using the 3WJ CHA to facilitate the formation of core–satellite assemblies. (A) shows the absorbance spectra for 60–10 nm core–satellite assemblies following incubation with HCV RNA (100 fM–10 nM in 10× increments). A red-shift and peak broadening can be observed when higher concentrations of HCV-RNA are present. (B) The red-shift is emphasized when the ratio of absorbance intensities at 600 nm to 528 nm are plotted for 60–10 core–satellite assemblies. (C) Shows the absorbance spectra for 60–20 nm core–satellite assemblies following incubation with HCV RNA (100 fM–10 nM in 10× HCV-RNA are present. (D) A similar red-shift is emphasized when the ratio of increments). A red-shift and peak broadening can be observed when higher concentrations of absorbance intensities at 600 nm to 528 nm are plotted for 60–20 core–satellite assemblies.
Fig. 7
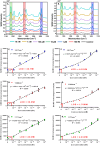
Fig. 7. SERS quantification of the HCV-RNA using the 3WJ CHA to facilitate the formation of core–satellite assemblies. The SERS intensity of vibrational modes at 1171, 1368, and 1617 cm−1 were analyzed to generate standard curves to relating to HCV-RNA concentrations. (A and B) shows the baseline corrected SERS spectra for the different concentrations (100 fM–10 nM) of HCV-RNA for 60–10 & 60–20 nm core–satellite assemblies respectively. The spectra displayed represent the averages of n = 3 independent samples. (C–E) displays the standard curves for LOD determination based on the SERS intensities of the three vibrational modes using the 60–10 nm core–satellite assemblies. (F–H) displays the standard curves for LOD determination based on the SERS intensities of the three vibrational modes using the 60–20 nm core–satellite assemblies.

Similar articles

Cited by

References

    1. Stasi C. Silvestri C. Voller F. Update on Hepatitis C Epidemiology: Unaware and Untreated Infected Population Could Be the Key to Elimination. SN Compr. Clin. Med. 2020;2(12):2808–2815. doi: 10.1007/s42399-020-00588-3. doi: 10.1007/s42399-020-00588-3. - DOI - DOI - PMC - PubMed
    1. Dhiman R. K. Premkumar M. Hepatitis C Virus Elimination by 2030: Conquering Mount Improbable. Clin. Liver Dis. 2021;16(6):254–261. doi: 10.1002/cld.978. doi: 10.1002/cld.978. - DOI - DOI - PMC - PubMed
    2. . PMID: 33489098; PMCID: PMC7805299.

    1. Fierer D. S. Wyles D. L. Re-treatment of Hepatitis C Infection After Multiple Failures of Direct-Acting Antiviral Therapy. Open Forum Infect. Dis. 2020;7(4):ofaa095. doi: 10.1093/ofid/ofaa095. doi: 10.1093/ofid/ofaa095. - DOI - DOI - PMC - PubMed
    2. . PMID: 32296728; PMCID: PMC7148001.

    1. Spaulding A. C. Anderson E. J. Khan M. A. Taborda-Vidarte C. A. Phillips J. A. HIV and HCV in U.S. Prisons and Jails: The Correctional Facility as a Bellwether Over Time for the Community's Infections. AIDS Rev. 2017;19(3):134–147. doi: 10.24875/AIDSRev.M17000006. - DOI - PubMed
    1. Stanaway J. D. Flaxman A. D. Naghavi M. et al., The global burden of viral hepatitis from 1990 to 2013: findings from the Global Burden of Disease Study 2013. Lancet. 2016;388(10049):1081–1088. doi: 10.1016/S0140-6736(16)30579-7. doi: 10.1016/S0140-6736(16)30579-7. - DOI - DOI - PMC - PubMed