

Malignancy pattern analysis of breast ultrasound images using clinical features and a graph convolutional network
- PMID: 38817843
- PMCID: PMC11138200
- DOI: 10.1177/20552076241251660
Malignancy pattern analysis of breast ultrasound images using clinical features and a graph convolutional network
Abstract
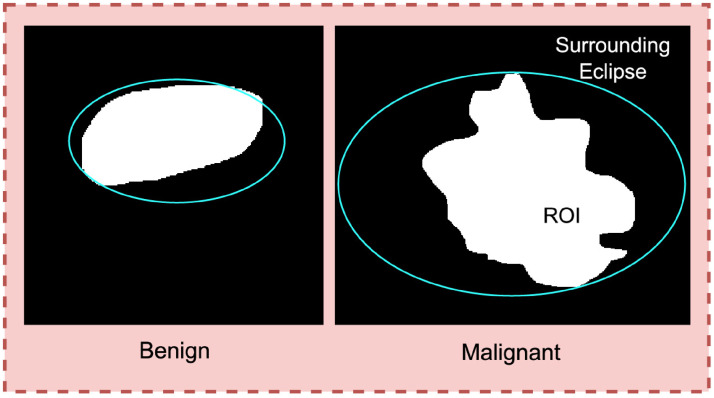
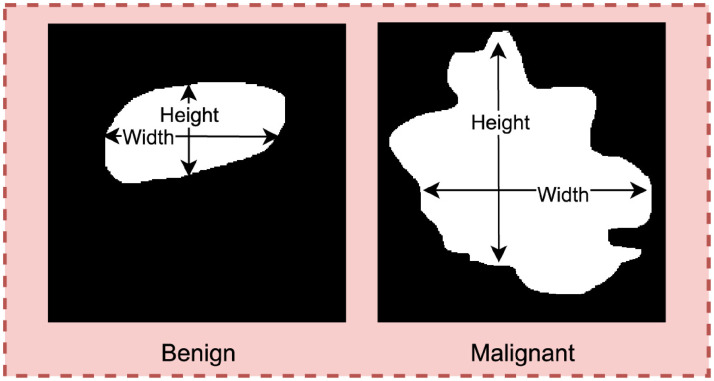
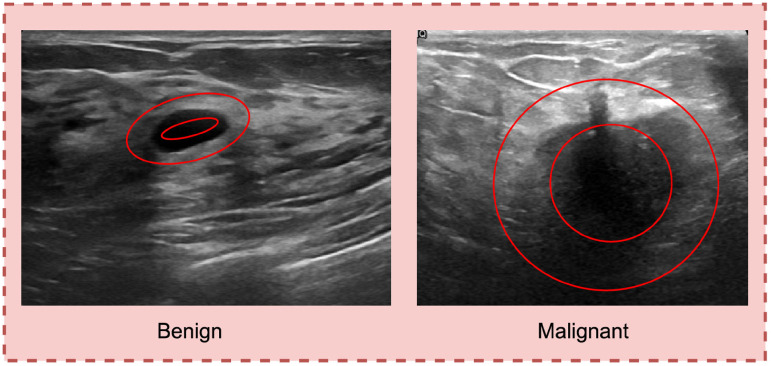
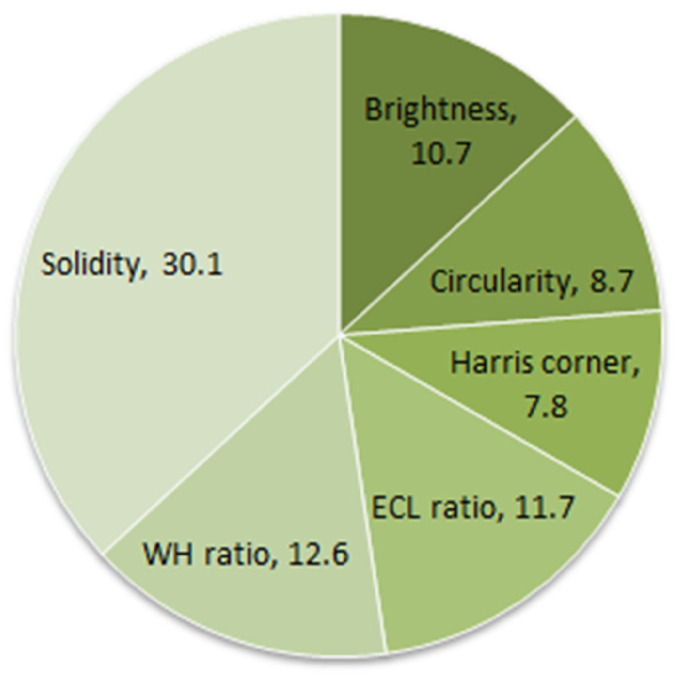
Objective: Early diagnosis of breast cancer can lead to effective treatment, possibly increase long-term survival rates, and improve quality of life. The objective of this study is to present an automated analysis and classification system for breast cancer using clinical markers such as tumor shape, orientation, margin, and surrounding tissue. The novelty and uniqueness of the study lie in the approach of considering medical features based on the diagnosis of radiologists.
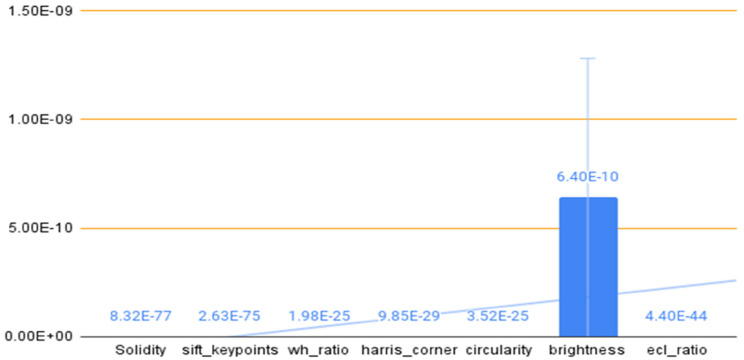
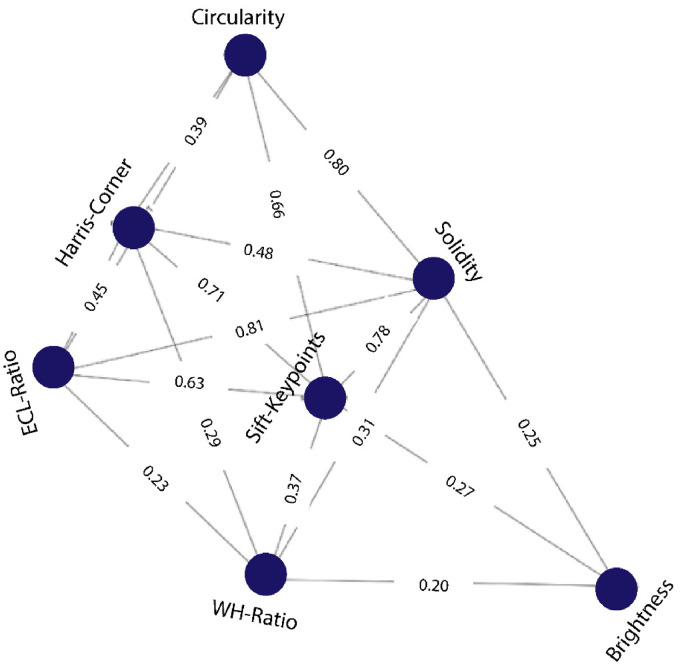
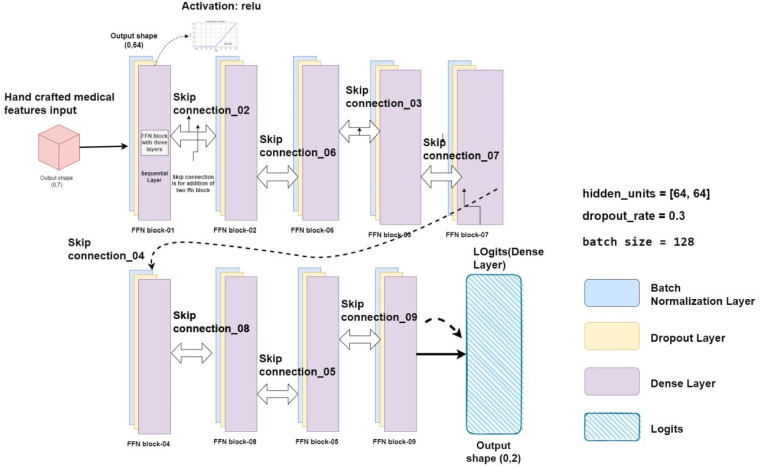
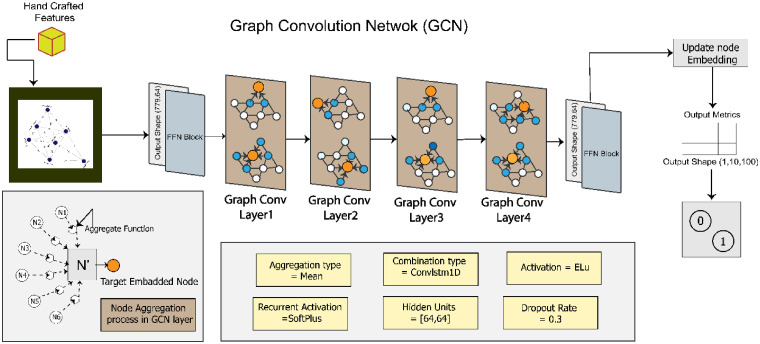
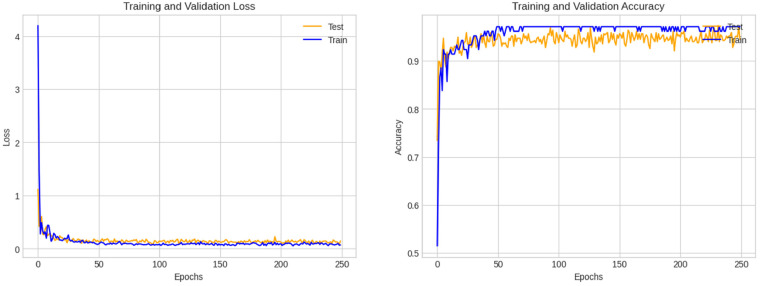
Methods: Using clinical markers, a graph is generated where each feature is represented by a node, and the connection between them is represented by an edge which is derived through Pearson's correlation method. A graph convolutional network (GCN) model is proposed to classify breast tumors into benign and malignant, using the graph data. Several statistical tests are performed to assess the importance of the proposed features. The performance of the proposed GCN model is improved by experimenting with different layer configurations and hyper-parameter settings.
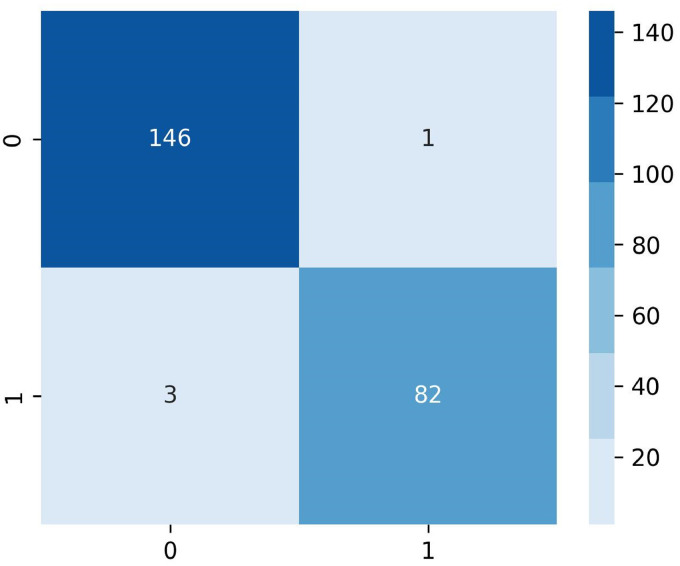
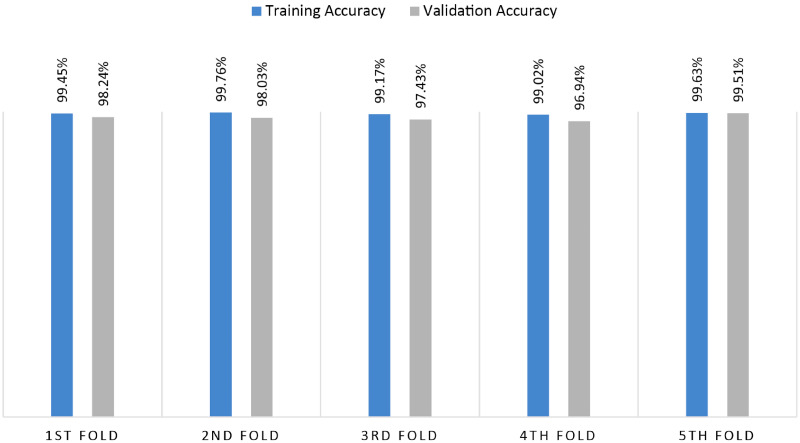
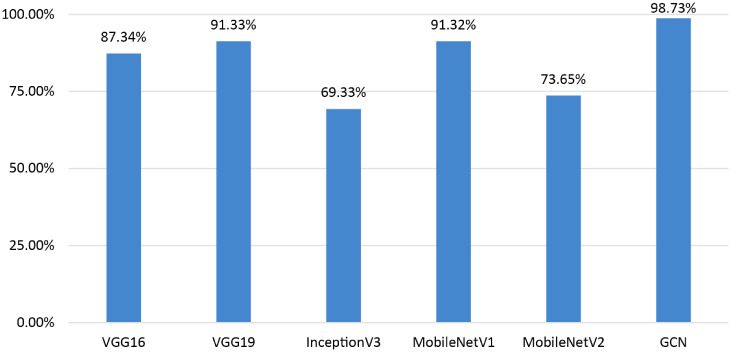
Results: Results show that the proposed model has a 98.73% test accuracy. The performance of the model is compared with a graph attention network, a one-dimensional convolutional neural network, and five transfer learning models, ten machine learning models, and three ensemble learning models. The performance of the model was further assessed with three supplementary breast cancer ultrasound image datasets, where the accuracies are 91.03%, 94.37%, and 89.62% for Dataset A, Dataset B, and Dataset C (combining Dataset A and Dataset B) respectively. Overfitting issues are assessed through k-fold cross-validation.
Conclusion: Several variants are utilized to present a more rigorous and fair evaluation of our work, especially the importance of extracting clinically relevant features. Moreover, a GCN model using graph data can be a promising solution for an automated feature-based breast image classification system.
Keywords: Breast ultrasound image; clinical features; ensemble learning; graph attention network; graph convolutional network.
© The Author(s) 2024.
Conflict of interest statement
The authors declared no potential conflicts of interest with respect to the research, authorship, and/or publication of this article.
Figures
Similar articles
-
Graph neural network-based breast cancer diagnosis using ultrasound images with optimized graph construction integrating the medically significant features.J Cancer Res Clin Oncol. 2023 Dec;149(20):18039-18064. doi: 10.1007/s00432-023-05464-w. Epub 2023 Nov 20. J Cancer Res Clin Oncol. 2023. PMID: 37982829 Free PMC article.
-
A Convolutional Neural Network and Graph Convolutional Network Based Framework for Classification of Breast Histopathological Images.IEEE J Biomed Health Inform. 2022 Jul;26(7):3163-3173. doi: 10.1109/JBHI.2022.3153671. Epub 2022 Jul 1. IEEE J Biomed Health Inform. 2022. PMID: 35196251
-
MAMF-GCN: Multi-scale adaptive multi-channel fusion deep graph convolutional network for predicting mental disorder.Comput Biol Med. 2022 Sep;148:105823. doi: 10.1016/j.compbiomed.2022.105823. Epub 2022 Jul 6. Comput Biol Med. 2022. PMID: 35872410
-
Improving the Automated Diagnosis of Breast Cancer with Mesh Reconstruction of Ultrasound Images Incorporating 3D Mesh Features and a Graph Attention Network.J Imaging Inform Med. 2024 Jun;37(3):1067-1085. doi: 10.1007/s10278-024-00983-5. Epub 2024 Feb 15. J Imaging Inform Med. 2024. PMID: 38361007 Free PMC article.
-
MVS-GCN: A prior brain structure learning-guided multi-view graph convolution network for autism spectrum disorder diagnosis.Comput Biol Med. 2022 Mar;142:105239. doi: 10.1016/j.compbiomed.2022.105239. Epub 2022 Jan 19. Comput Biol Med. 2022. PMID: 35066446
Cited by
-
Role of inter- and extra-lesion tissue, transfer learning, and fine-tuning in the robust classification of breast lesions.Sci Rep. 2024 Oct 1;14(1):22754. doi: 10.1038/s41598-024-74316-5. Sci Rep. 2024. PMID: 39354128 Free PMC article.
-
Leveraging advanced graph neural networks for the enhanced classification of post anesthesia states to aid surgical procedures.PLoS One. 2025 Apr 25;20(4):e0320299. doi: 10.1371/journal.pone.0320299. eCollection 2025. PLoS One. 2025. PMID: 40279343 Free PMC article.
References
-
- Zhang S., Xie W., Li W., Wang L., Feng C., “GAMB-GNN: Graph Neural Networks learning from gene structure relations and Markov Blanket ranking for cancer classification in microarray data,” Chemometrics and Intelligent Laboratory Systems, vol. 232, Jan. 2023, doi: 10.1016/j.chemolab.2022.104713. - DOI
-
- Gradishar W. J. et al., “Breast cancer, version 3.2020,” JNCCN Journal of the National Comprehensive Cancer Network, vol. 18, no. 4, pp. 452–478, Apr. 2020, doi: 10.6004/jnccn.2020.0016. - PubMed
-
- Myers E. R. et al., “Benefits and harms of breast cancer screening: A systematic review,” JAMA - Journal of the American Medical Association, vol. 314, no. 15. American Medical Association, pp. 1615–1634, Oct. 20, 2015. doi: 10.1001/jama.2015.13183. - PubMed
LinkOut - more resources
Full Text Sources
