. 2024 Mar 20;4(5):1763-1774.
doi: 10.1021/jacsau.3c00577. eCollection 2024 May 27.

Proline Isomerization and Molten Globular Property of TgPDCD5 Secreted from Toxoplasma gondii Confers Its Regulation of Heparin Sulfate Binding

Affiliations

Proline Isomerization and Molten Globular Property of TgPDCD5 Secreted from Toxoplasma gondii Confers Its Regulation of Heparin Sulfate Binding

Gloria Meng-Hsuan Lin et al. JACS Au. .

Abstract

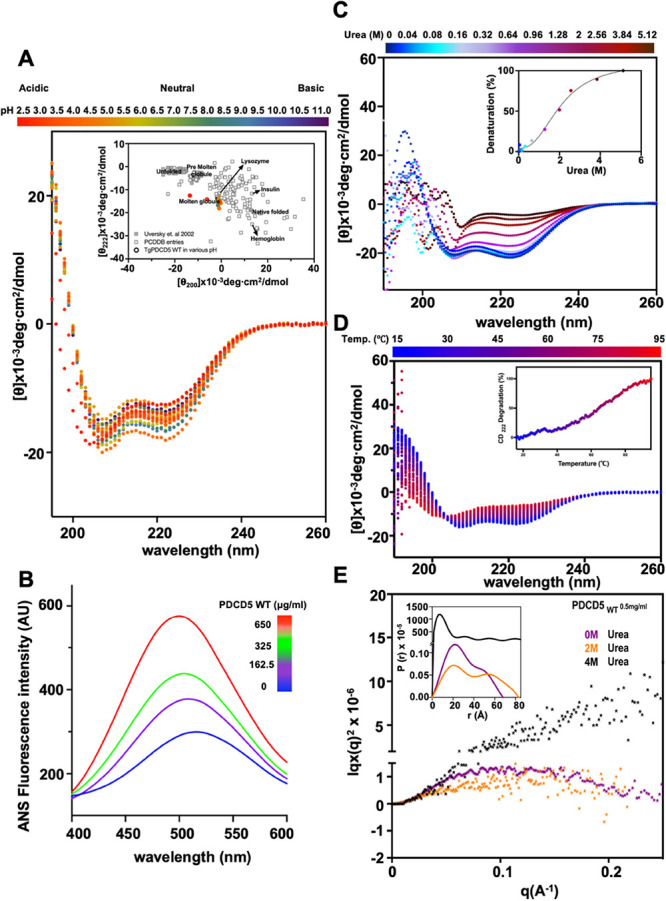
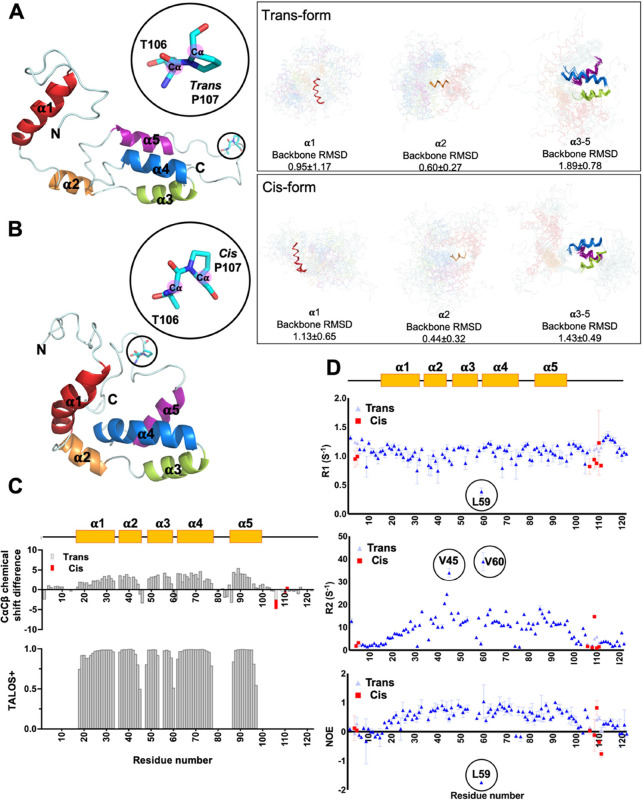
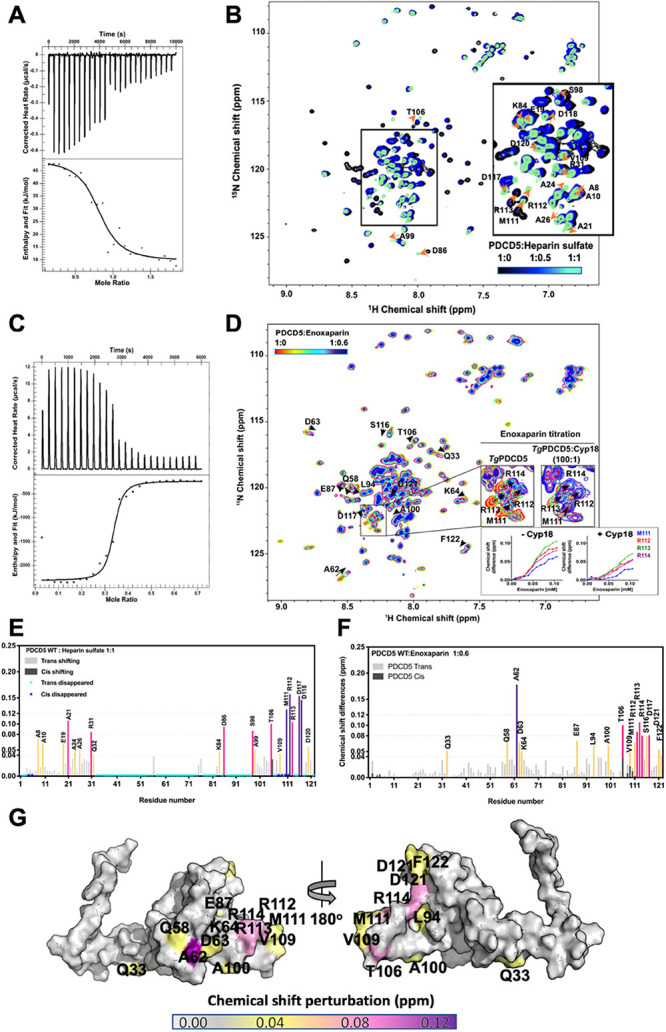
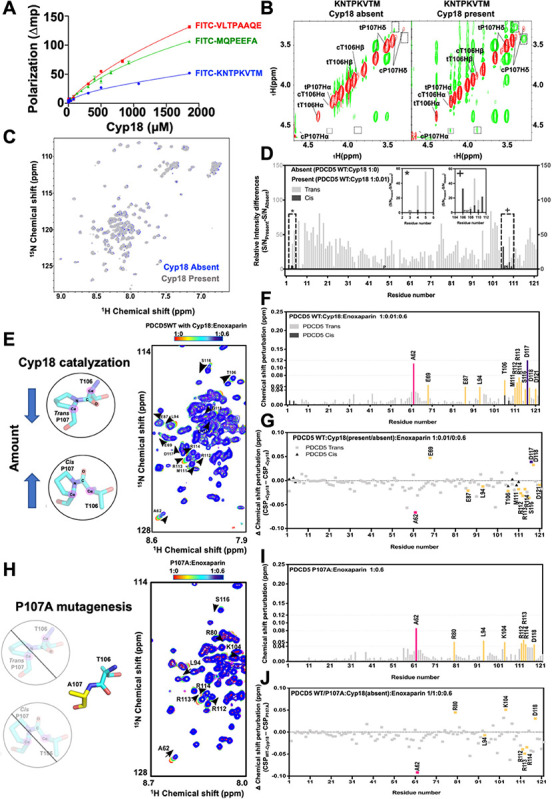
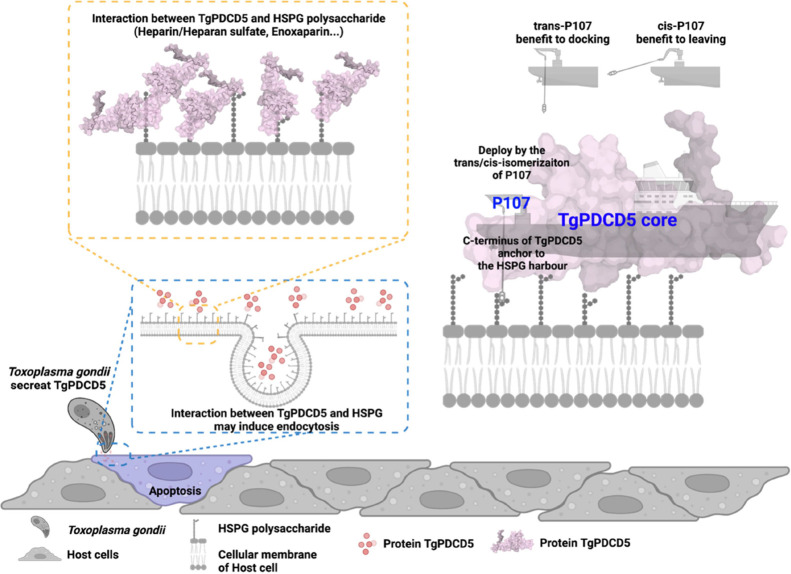
Toxoplasmosis, caused by Toxoplasma gondii, poses risks to vulnerable populations. TgPDCD5, a secreted protein of T. gondii, induces apoptosis through heparan sulfate-mediated endocytosis. The entry mechanism of TgPDCD5 has remained elusive. Here, we present the solution structure of TgPDCD5 as a helical bundle with an extended N-terminal helix, exhibiting molten globule characteristics. NMR perturbation studies reveal heparin/heparan sulfate binding involving the heparan sulfate/heparin proteoglycans-binding motif and the core region, influenced by proline isomerization of P107 residue. The heterogeneous proline recruits a cyclophilin TgCyp18, accelerating interconversion between conformers and regulating heparan/heparin binding. These atomic-level insights elucidate the binary switch's functionality, expose novel heparan sulfate-binding surfaces, and illuminate the unconventional cellular entry of pathogenic TgPDCD5.


Conflict of interest statement

The authors declare no competing financial interest.

Figures

Figure 1
Figure 1
Molten globular behavior of TgPDCD5. (A) CD spectra of TgPDCD5 under different pH conditions. The inset shows a double wavelength plot obtained from CD spectra at different pH values compared with the reference spectra recorded in the web server CAPITO. (B) ANS-fluorescence assay profile of TgPDCD5. Blue signals represent ANS alone, while purple, green, and red signals represent ANS incubated with different amounts of protein. (C) CD spectra of TgPDCD5 incubated with varying concentrations of urea. The inset shows the chemical unfolding of the protein, monitored by CD spectrometry at 222 nm. (D) Thermal denaturation of TgPDCD5 was monitored by CD spectrometry. The inset shows the thermal unfolding of the protein monitored at 222 nm. (E) Kartky-Porod plot of TgPDCD5 chemical unfolding by urea based on SAXS data. The P(r) vs r profiles from the data are inserted.
Figure 2
Figure 2
Solution structure and dynamics of TgPDCD5. The structures of TgPDCD5 with trans-form P107 (A) or with cis-form P107 (B) are depicted. The relative selected conformer with trans-P107 (A) or cis-P107 (B) is presented in the left panel as a representation, while the ensemble of the 20 lowest energy NMR-derived structures of TgPDCD5 with trans-P107 (A) or cis-P107 (B) is displayed in the right panel. The secondary structures of TgPDCD5, including helix α1, helix α2, helix α3, helix α4, and helix α5, are colored red, orange, green, blue, and deep purple, respectively. Due to its molten globular feature, solution conformers of TgPDCD5 can only be superimposed by the secondary structure elements: helix α1, helix α2, and helices α3−α5, rather than the full length. The relative RMSD numbers are labeled. (C) Secondary structures of TgPDCD5 are based on the Cα and Cβ chemical-shift difference and the TALOS+ prediction. (D) NMR dynamics information for TgPDCD5. The 15N-relaxation parameters (R1, R2, NOE) are presented. Residues in the trans-form are indicated by blue triangles, and residues in the cis-form are indicated by red squares.
Figure 3
Figure 3
Interactions with heparin sulfate polysaccharide determined by ITC and NMR. (A) Isothermal titration calorimetry analysis of TgPDCD5 titrated with heparin sulfate. Upper panel: raw data in μcal/s versus time, showing heat release during titration. Lower panel: integration of raw data yielding the heat per mole versus molar ratio. (B) Overlay of 2D 1H-15N HSQC spectrum of TgPDCD5 titrated with heparin sulfate. (C) Isothermal titration calorimetry analysis of TgPDCD5 titrated with Enoxaparin. Upper panel: raw data in μcal/s versus time showing heat release during titration. Lower panel: integration of raw data yielding the heat per mole versus molar ratio. (D) Overlay of the 2D 1H-15N HSQC spectrum of TgPDCD5 titrated with Enoxaparin. (E) Chemical-shift differences of each residue measured from heparin sulfate titration are shown. Residues with significant changes are labeled. Amino acids with broadened backbone amide signals are marked with stars. (F) Chemical-shift differences of each residue measured from Enoxaparin titration are shown. Residues with significant changes are labeled. Amino acids with broadened backbone amide signals are marked with stars. (G) Mapping of residues with significant chemical-shift changes onto the NMR solution structure of trans-form TgPDCD5 during Enoxaparin titration. Residues with CSPs between 0.04 and 0.08 ppm are colored in yellow, CSPs between 0.08 and 0.12 ppm are colored in magenta, and CSPs over 0.12 are colored in purple.
Figure 4
Figure 4
Isomerization of P107 regulates the interaction between TgPDCD5 and polysaccharides. (A) Binding affinities of the interaction between TgCyp18 and 150 μM C-terminal peptide (FITC-KNTPKVTM), middle-position peptide (FITC-VLTPAAQE), and N-terminal peptide (FITC-MQPEEFA) are derived from a one-site binding model using Prism. (B) 1H-1H ROESY spectrum at 298 K of the C-terminal peptide with the absence (ratio 40:0) and presence (ratio 40:1) of enzyme Cyp18 is shown in the left and right panel, respectively. The positive peaks are colored in red and negative peaks in green. The 1H resonances of T106 and P107 are marked. The resonances from the cis and trans forms are labeled as c and t, respectively. The dashed-line boxes indicate the signals indicating accelerations of the P107 peptidyl isomerization from the presence of the ROE signals of neighboring hydrogens. (C) Overlay of 1H-15N HSQC spectra of TgPDCD5 treated with TgCyp18. (D) Signal intensity difference of TgPDCD5 treated with TgCyp18. Paired backbone amide-signal intensity differences of cis-/trans-form residues (E4, E5, T106, K108, V109, T110, and M111) are highlighted by inset plots (*, + in D). (E) Illustration of TgCyp18 catalyzing the isomerization of TgPDCD5, and the overlay of 1H-15N HSQC spectra of Enoxaparin titrating TgPDCD5 with TgCyp18 at selected region. (F) Chemical-shift difference of TgPDCD5 while Enoxaparin is titrated in the presence of TgCyp18. (G) Delta chemical-shift difference of TgPDCD5, subtracting CSPs from titrations with the absence of TgCyp18 from the CSPs from titrations with the presence of TgCyp18. (H) Illustration of P107A mutation in TgPDCD5, and the overlay of 1H-15N HSQC spectra of Enoxaparin titrating TgPDCD5 P107A at selected region. (I) Chemical-shift difference of TgPDCD5 P107A while Enoxaparin is titrated. (J) Delta chemical-shift difference of TgPDCD5, subtracting CSPs from titrations with the absence of TgCyp18 toward TgPDCD5 WT to the CSPs from titrations toward P107A. Residues with CSPs over 0.12 are colored in purple. Residues with CSPs in the range of 0.08–0.12 and 0.04–0.08 ppm are colored strawberry pink and yellow, respectively. The delta chemical-shift difference represents the CSPs determined in the presence of TgCyp18 or P107A subtracted from the CSPs determined in the absence of TgCyp18.
Figure 5
Figure 5
Critical residues involved in Enoxaparin binding. 2D 1H-15N HSQC spectrum of TgPDCD5 mutants A62G and A62S titrated with Enoxaparin, respectively. The red spectrum represents backbone amides of TgPDCD5 mutants before titration, while the blue spectrum represents backbone amides of TgPDCD5 mutants after titration with a ratio of 1:0.6 (protein:Enoxaparin).
Figure 6
Figure 6
Mechanism of the interaction between TgPDCD5 and HS/heparin polysaccharide heparin. Structural mechanism of the interaction between the T. gondii tachyzoite secreted protein TgPDCD5 and HS/heparin polysaccharide. The T. gondii tachyzoite is represented by a gray crescent moon-shaped module, while the host cells are depicted as gray cloudy shapes. The purple host cell represents apoptosis induction. The host cell plasma membrane is shown as gray double layers with bean sprout-shaped phospholipid components. The gray bead streams on the plasma membrane represent HS/heparin polysaccharides. The pink pearls represent the TgPDCD5 protein, with its protein surface colored in pink.

Similar articles

References

    1. Maenz M.; Schluter D.; Liesenfeld O.; Schares G.; Gross U.; Pleyer U. Ocular toxoplasmosis past, present and new aspects of an old disease. Prog. Retin Eye Res. 2014, 39, 77–106. 10.1016/j.preteyeres.2013.12.005. - DOI - PubMed
    1. Martin S. Congenital toxoplasmosis. Neonatal Netw 2001, 20 (4), 23–30. 10.1891/0730-0832.20.4.23. - DOI - PubMed
    1. Saadatnia G.; Golkar M. A review on human toxoplasmosis. Scand J. Infect Dis 2012, 44 (11), 805–814. 10.3109/00365548.2012.693197. - DOI - PubMed
    1. Aleixo A. L.; Curi A. L.; Benchimol E. I.; Amendoeira M. R. Toxoplasmic Retinochoroiditis: Clinical Characteristics and Visual Outcome in a Prospective Study. PLoS Negl Trop Dis 2016, 10 (5), e000468510.1371/journal.pntd.0004685. - DOI - PMC - PubMed
    1. Morjaria S.; Epstein D. J.; Romero F. A.; Taur Y.; Seo S. K.; Papanicolaou G. A.; Hatzoglou V.; Rosenblum M.; Perales M. A.; Scordo M.; Kaltsas A. Toxoplasma Encephalitis in Atypical Hosts at an Academic Cancer Center.. Open Forum Infect Dis 2016, 3 (2), ofw070.10.1093/ofid/ofw070. - DOI - PMC - PubMed

LinkOut - more resources