. 2023 Dec 18;2(4):401-415.
doi: 10.1002/mlf2.12094. eCollection 2023 Dec.

Variation in resource competition traits among Microcystis strains is affected by their microbiomes

Affiliations

Variation in resource competition traits among Microcystis strains is affected by their microbiomes

Dylan Baker et al. mLife. .

Abstract

Freshwater harmful algal blooms are often dominated by Microcystis, a phylogenetically cohesive group of cyanobacteria marked by extensive genetic and physiological diversity. We have previously shown that this genetic diversity and the presence of a microbiome of heterotrophic bacteria influences competitive interactions with eukaryotic phytoplankton. In this study, we sought to explain these observations by characterizing Monod equation parameters for resource usage (maximum growth rate μ max, half-saturation value for growth K s, and quota) as a function of N and P levels for four strains (NIES-843, PCC 9701, PCC 7806 [WT], and PCC 7806 ΔmcyB) in presence and absence of a microbiome derived from Microcystis isolated from Lake Erie. Results indicated limited differences in maximum growth rates but more pronounced differences in half-saturation values among Microcystis strains. The largest impact of the microbiome was reducing the minimal nitrogen concentration sustaining growth and reducing half saturation values, with variable results depending on the Microcystis strain. Microcystis strains also differed from each other in their N and P quotas and the extent to which microbiome presence affected them. Our data highlight the importance of the microbiome in altering Microcystis-intrinsic traits, strain competitive hierarchies, and thus bloom dynamics. As quota, μ max, and K s are commonly used in models for harmful algal blooms, our data suggest that model improvement may be possible by incorporating genotype dependencies of resource-use parameters.

Keywords: cultivation‐dependent; fitness; harmful algal blooms; host–microbe interactions; phytoplankton.


Conflict of interest statement

The authors declare no conflict of interests.

Figures
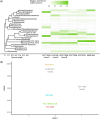
Figure 1
Figure 1
Phycosphere communities of created xenic and original seed Microcystis cultures. (A) Bacterial community composition, including the Microcystis host cells, determined by 16S rRNA gene sequencing of the V4 region. Heatmap colors indicate the relative abundance of ASVs ≥0.1% in at least one sample determined by DADA2. The seed cultures were filtered to 1.2 μm, combined, and added to the recipient axenic Microcystis strains, which each showed differences in the relative abundance of ASVs associated with them. (B) NMDS plot of phycosphere communities of the two seed Microcystis cultures (gray) and the four strains after exposure to the seed communities. The bacterial communities of mutant (ΔmcyB) and wild‐type PCC 7806 were nearly identical, whereas the bacterial communities of NIES‐843 and PCC 9701 were different from both the seed cultures and each other. Analysis was done in vegan (v2.6‐4) using a Bray–Curtis distance matrix. ASVs, amplicon sequence variant.
Figure 2
Figure 2
Growth curves of Microcystis strains based on phycocyanin fluorescence at varying P concentrations. In gray is the media control, while each color represents a different strain. Panels have been faceted by P concentration in PO4 3−, and xenic or axenic culture status. Zero growth is seen at 1.1 μg/l PO4 3− except for xenic and axenic PCC 7806 and xenic PCC 7806 ΔmcyB. No further increase in growth rate was observed after 171.1–309.5 μg/l PO4 3− for all strains. P, PO4 3−.
Figure 3
Figure 3
Growth curves of Microcystis aeruginosa strains based on phycocyanin fluorescence at varying N concentrations. In gray is the media control, while each color represents a different strain. Panels have been faceted by N concentration in NO3 , and xenic or axenic culture status. Zero growth was seen at 8, 40.5, and 87 μg/l NO3 except for xenic strains at 87 μg/l NO3 , when growth started to become apparent. There was a noticeable lag in growth for the two axenic, but not xenic, PCC 7806 strains starting at 425 μg/l NO3 , but this was not observed in a trial experiment, suggesting this difference in lag phases was not a replicable result. Maximum growth rate was reached at around 2760 μg/l NO3 for all strains. N, NO3 .
Figure 4
Figure 4
Response of each strain to increasing limiting nutrient concentrations and presence of a microbiome. Monod curves display the relationship between limiting nutrient concentration and maximum growth rate at that concentration for P (A) and N (B). Rows display the data for each of the four different Microcystis strains, while columns show the axenic and xenic versions of each strain. Points represent the average of the top five growth rates measured across measurement time intervals of the growth curve (±SE) for each replicate at each respective nutrient concentration.
Figure 5
Figure 5
P and N growth parameters of Microcystis cultures in the presence and absence of a microbiome. (A) Half‐saturation constant (K s) of N (±SE). (B) Maximum growth rate (μ max) of N (±SE). (C) Cellular quotas of (Q N). (D) Half‐saturation constant (K s) of P (±SE). (E) Maximum growth rates (μ max) of P (±SE). (F) Cellular quotas of P (Q P) for four M. aeruginosa cultures in xenic and axenic state. *, ** Significant differences between μ max and K s values of the axenic (dark green) and xenic (light green) states of the same strain (t‐test with FDR correction; *p ≤ 0.05, **p ≤ 0.01, respectively). Lower‐ and upper‐case letters show significant differences between different axenic strains or xenic strains, respectively (t‐test with FDR correction, p ≤ 0.05). No significance was assessed for quota as only technical replicates were included.

References

    1. Anderson DM, Cembella AD, Hallegraeff GM. Progress in understanding harmful algal blooms: paradigm shifts and new technologies for research, monitoring, and management. Ann Rev Marine Sci. 2012;4:143–176. - PMC - PubMed
    1. Huisman J, Codd GA, Paerl HW, Ibelings BW, Verspagen JMH, Visser PM. Cyanobacterial blooms. Nat Rev Microbiol. 2018;16:471–483. - PubMed
    1. Gobler CJ. Climate change and harmful algal blooms: insights and perspective. Harmful Algae. 2020;91:101731. - PubMed
    1. Michalak AM, Anderson EJ, Beletsky D, Boland S, Bosch NS, Bridgeman TB, et al. Record‐setting algal bloom in Lake Erie caused by agricultural and meteorological trends consistent with expected future conditions. Proc Natl Acad Sci USA. 2013;110:6448–6452. - PMC - PubMed
    1. Vanderploeg HA, Liebig JR, Carmichael WW, Agy MA, Johengen TH, Fahnenstiel GL, et al. Zebra mussel (Dreissena polymorpha) selective filtration promoted toxic Microcystis blooms in Saginaw Bay (Lake Huron) and Lake Erie. Can J Fish Aquat Sci. 2001;58:1208–1221.