. 2023 Jul 20;10(7):812-818.
doi: 10.1364/optica.489068. Epub 2023 Jun 22.

Adaptive time modulation technique for multiplexed on-chip particle detection across scales

Affiliations

Adaptive time modulation technique for multiplexed on-chip particle detection across scales

Vahid Ganjalizadeh et al. Optica. .

Abstract

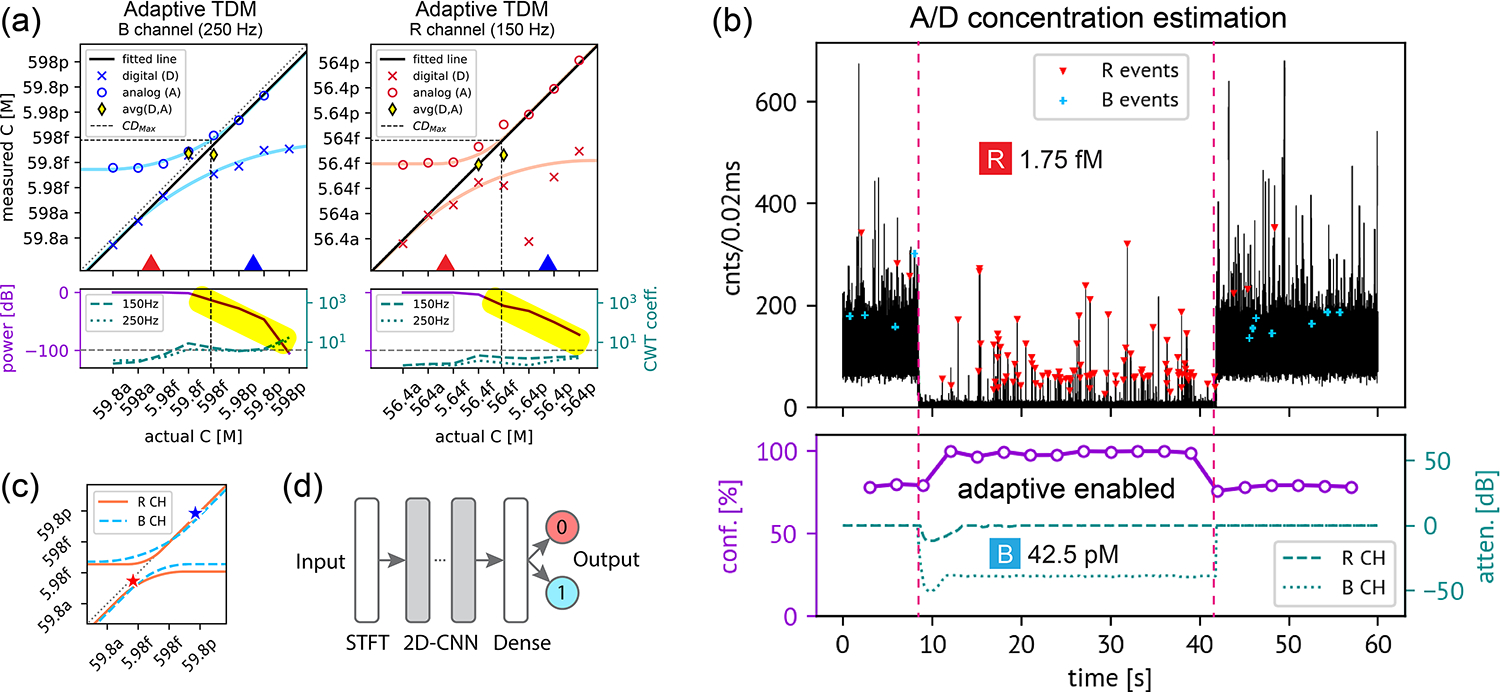
Integrated optofluidic biosensors have demonstrated ultrasensitivity down to single particle detection and attomolar target concentrations. However, a wide dynamic range is highly desirable in practice and can usually only be achieved by using multiple detection modalities or sacrificing linearity. Here, we demonstrate an analysis technique that uses temporal excitation at two different time scales to simultaneously enable digital and analog detection of fluorescent targets. We demonstrated the seamless detection of nanobeads across eight orders of magnitude from attomolar to nanomolar concentration. Furthermore, a combination of spectrally varying modulation frequencies and a closed-loop feedback system that provides rapid adjustment of excitation laser powers enables multiplex analysis in the presence of vastly different concentrations. We demonstrated this ability to detect across scales via an analysis of a mixture of fluorescent nanobeads at femtomolar and picomolar concentrations. This technique advances the performance and versatility of integrated biosensors, especially toward point-of-use applications.


Conflict of interest statement

Disclosures. Authors Aaron R. Hawkins and Holger Schmidt had a competing interest in Fluxus Inc., which commercializes optofluidic technology. Author Vahid Ganjalizadeh has no competing interests.

Figures

Fig. 1.
Fig. 1.
(a) Optofluidic fluorescence detection setup. Two lasers are coupled into an optofluidic chip via single-mode fiber. Fluorescence signals are analyzed with an FPGA setup optimized for real-time data analysis. Top-right inset: Optical excitation configuration and dimensions inside analyte channel. (b) Screenshot of custom GUI for real-time analysis software. Multiple graphs visualize real-time binned photodetector signals alongside the spectrogram and concentration calculation results. Additional panels provide user control of the function generator, feedback system, and experiment parameters. (c) ARROW chip mounted on a 3D-printed chip stage. The outlet reservoir is sealed with an O-ring by a sandwich pressure from top-bottom pieces of 3D-printed chip mount. The inlet reservoir is made of a thermally bonded piece of silicone tubing.
Fig. 2.
Fig. 2.
Fluorescence detection across concentration scales. (a) Digital (low concentration) regime: Individual multipeak events are observed from single target particles in the excitation region. (b) Analog (high concentration) regime: The fluorescence signal features low-frequency modulation around a constant average. Bottom: CWT spectrograms divided into two regions to assess digital and analog behavior simultaneously. Inset: C-Morlet wavelet used to produce the spectrograms. (c) Dose-response curve constructed from both digital and analog data. In the intermediate regime (a few particles present in the excitation region), the logarithmic average of digital and analog values is used to determine concentration (diamond symbols). Bottom: CWT amplitude versus concentration showing saturation at the highest concentrations (yellow box).
Fig. 3.
Fig. 3.
Multiplexed detection in digital and analog concentration limits. (a) Digital: Individual targets from a mixed solution (~106 beads/mL each) of 200 nm crimson and 100 nm yellow-green fluorescent beads are first detected by PCWA (C-Morlet) and then classified by peak number with a DNN model. (b) Analog: Bright lines are seen in the A-band for each class of beads corresponding to the modulation frequencies (red: 150 Hz; blue: 250 Hz). Event detection and classification are invalid in this region and, as seen, all the events are incorrectly identified as blue events.
Fig. 4.
Fig. 4.
Multiplexed closed-loop system. (a) Readout: Frequency components Ci at both modulation bands are calculated and fetched in real-time. (b) Feedback control: Ci are compared with preset set point values spi, and the error is fed into a modified PID controller. PID parameters are tuned experimentally by trial and error. PID system works on the log scale, and output control signals are converted back to real-world values. (c) Power adjustment: Laser powers are adjusted on demand to maintain Ci around set points. Lasers are modulated using a function generator generating squared pulses with 10% p-p and 95% offset at f1 and f2 frequencies.
Fig. 5.
Fig. 5.
Multiplex analysis across scales using adaptive TDM. (a) Dose-response curves for both bead types obtained with adaptive TDM. Full linear detection without saturation is restored across eight orders of magnitude as the CWT coefficients are maintained at a threshold level (bottom plots), and the change in power (highlighted by yellow boxes) is used to determine the concentration. (b) Multiplexed analysis of mixed low-high concentration samples (red: 5.6 fM; blue: 59.8 pM) using adaptive TDM. A ~ 30 dB drop in blue laser power at t = 9 s reveals individual events from crimson beads with high confidence (violet curve in bottom plot). A trained DNN model is used to classify detected events, and only events with confidence >99.9% are displayed. (c) Adaptive concentration curves for red and blue channels (singleplex data) with star markers indicating the measured concentration of a multiplexed signal in (b); (d) schematic of DNN model used for classification of detected events.

Similar articles

References

    1. Towner JS, Rollin PE, Bausch DG, Sanchez A, Crary SM, Vincent M, Lee WF, Spiropoulou CF, Ksiazek TG, Lukwiya M, Kaducu F, Downing R, and Nichol ST, “Rapid diagnosis of Ebola hemorrhagic fever by reverse transcription-PCR in an outbreak setting and assessment of patient viral load as a predictor of outcome,” J. Virol. 78, 4330–4341 (2004). - PMC - PubMed
    1. Kuypers J, Wright N, Ferrenberg J, Huang M-L, Cent A, Corey L, and Morrow R, “Comparison of real-time PCR assays with fluorescent-antibody assays for diagnosis of respiratory virus infections in children,” J. Clin. Microbiol. 44, 2382–2388 (2006). - PMC - PubMed
    1. Schiess R, Wollscheid B, and Aebersold R, “Targeted proteomic strategy for clinical biomarker discovery,” Mol. Oncol. 3, 33–44 (2009). - PMC - PubMed
    1. Kemal Yetisen A, Safwan Akram M, and Lowe CR, “Paper-based microfluidic point-of-care diagnostic devices,” Lab Chip 13, 2210–2251 (2013). - PubMed
    1. Kugimiya A, Wakimoto S, Kohda J, Nakano Y, and Takano Y, “Development of a one-step analysis method for several amino acids using a microfluidic paper-based analytical device,” Sci. Rep. 12, 3427 (2022). - PMC - PubMed

LinkOut - more resources