. 2023 Feb 15;2(1):43-57.
doi: 10.1002/mlf2.12056. eCollection 2023 Mar.

Regulation of RNase E during the UV stress response in the cyanobacterium Synechocystis sp. PCC 6803

Affiliations

Regulation of RNase E during the UV stress response in the cyanobacterium Synechocystis sp. PCC 6803

Satoru Watanabe et al. mLife. .

Abstract

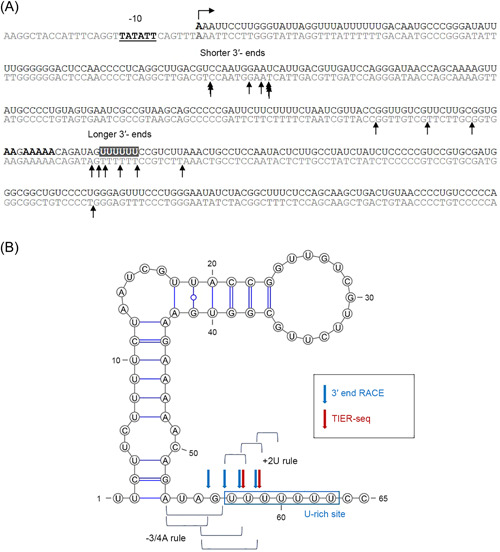
Endoribonucleases govern the maturation and degradation of RNA and are indispensable in the posttranscriptional regulation of gene expression. A key endoribonuclease in Gram-negative bacteria is RNase E. To ensure an appropriate supply of RNase E, some bacteria, such as Escherichia coli, feedback-regulate RNase E expression via the rne 5'-untranslated region (5' UTR) in cis. However, the mechanisms involved in the control of RNase E in other bacteria largely remain unknown. Cyanobacteria rely on solar light as an energy source for photosynthesis, despite the inherent ultraviolet (UV) irradiation. In this study, we first investigated globally the changes in gene expression in the cyanobacterium Synechocystis sp. PCC 6803 after a brief exposure to UV. Among the 407 responding genes 2 h after UV exposure was a prominent upregulation of rne mRNA level. Moreover, the enzymatic activity of RNase E rapidly increased as well, although the protein stability decreased. This unique response was underpinned by the increased accumulation of full-length rne mRNA caused by the stabilization of its 5' UTR and suppression of premature transcriptional termination, but not by an increased transcription rate. Mapping of RNA 3' ends and in vitro cleavage assays revealed that RNase E cleaves within a stretch of six consecutive uridine residues within the rne 5' UTR, indicating autoregulation. These observations suggest that RNase E in cyanobacteria contributes to reshaping the transcriptome during the UV stress response and that its required activity level is secured at the RNA level despite the enhanced turnover of the protein.

Keywords: cyanobacteria; protein turnover; ribonuclease; stress response.


Conflict of interest statement

The authors declare no conflict of interests.

Figures

Figure 1
Figure 1
Transcriptomic response to UV treatment and increased accumulation of the rne transcript. (A) Volcano plot: log‐transformed fold changes (FCs) between samples taken 2 h after UV irradiation and after mock treatment (x‐axis, difference in log2 expression values; y‐axis, −log10 (adjusted p value)). The lines indicate the adjusted p value threshold of 0.05 and the FC thresholds of 1 and −1. The entire data set is shown in the genome‐wide expression plot (Data S2), and numerical values are presented in Data S1. (B) Detailed view of the rne locus with array probes indicated by horizontal bars connected by colored lines. All genes are located in the (+) strand direction. The rne gene, which is transcribed together with the rnhB gene encoding RNase H, has a long 5′ UTR from which separate shorter transcripts can also accumulate, annotated as ncr0020. The signal intensities are given as log2 values. (C) Northern blot analysis of rne expression after UV treatment using single‐stranded RNA probes that hybridize either to the rne 5′ UTR or to the coding region (ORF) (Figure S4A and Table S2). 5S rRNA is shown as a control. The High Range RNA Ladder (Thermo‐Fisher) was used as the size standard. One representative blot out of three is shown. rRNA, ribosomal RNA; UTR, untranslated region; UV, ultraviolet.
Figure 2
Figure 2
Induction of RNase E activity after UV‐C treatment. (A) RNase E activity in crude cell lysates prepared at the indicated time points after UV‐C treatment (open diamonds: 0 h just after treatment; closed squares: after 2 h; closed triangles: after 4 h; open squares: buffer control) measured in a fluorescence‐based assay with a duration of 70 min. The arrow indicates the high reaction efficiency achieved after 15 min of incubation. (B) Comparison of RNase E activities at 15 min incubation. The values of fluorescence at 15 min incubation were normalized by those before each treatment. The standard deviations of the values obtained for six experiments are shown. Bars represent mean ± SEM (n = 6). For statistical evaluation, p values were calculated using the paired t‐test in Microsoft Excel, *p < 0.05; **p < 0.01.
Figure 3
Figure 3
Comparison of the expression level and the stability of RNase E. The translation inhibitor chloramphenicol was added to the cultures 2 h after UV‐C treatment, and cells were harvested at the indicated time points. (A) Western blot analysis. 20 μg of total protein was loaded on an SDS‐PAA gel and subjected to western blot analysis using antibodies against RNase E (arrowhead) or RbcL used as an internal control. (B) Comparison of RNase E protein levels. The signal intensities of RNase E protein (arrowhead) were measured and normalized by those of RbcL protein. Bars represent mean ± SEM (n = 3). For statistical evaluation, p values were calculated using the paired t‐test in Microsoft Excel, *p < 0.05; **p < 0.01.
Figure 4
Figure 4
Upregulation of rne full‐length transcripts after UV‐C treatment. The relative amounts of rne 5′ UTR and ORF transcripts are plotted over time following the addition of the transcription inhibitor rifampicin to cultures after UV‐C treatment for 2 h. The amount of RNA at time point 0 was set to 1.0. Mock‐treated cultures served as controls. The calculated half‐lives of each transcript are indicated. The cells were harvested at the indicated time points for RT‐qPCR analysis using primer sets that anneal to two different regions of the rne 5′ UTR (5′ UTR‐1 and 5′ UTR‐2) or the coding region (ORF‐1 and ORF‐2) (Figure S4B,C and Table S2). The data from tests conducted in triplicate were normalized to the amount of 16S rRNA. Half‐life and decay were calculated based on two independent regions in the UTR and the ORF, each with three biological replicates for each region. The fitting curves for the mock treatment and UV stress are given in black and red, respectively. The 95% confidence interval areas are shaded accordingly. RT‐qPCR, quantitative real‐time reverse transcription PCR.
Figure 5
Figure 5
Analysis of 3′ ends within the rne 5′ UTR. (A) The 3′ ends mapped by the 3′ RACE assay within the first 355 nt of the rne 5′ UTR are indicated by arrows (overlapping arrows if the same end was found several times). The promoter (−10), TSS, and A‐rich sites are represented by boldface letters. The U‐rich site is indicated by the gray box and white characters. The 3′ ends mapped primarily to two regions that were located 78–90 nt (shorter 3′ ends) and 214–229 nt (longer 3′ ends) downstream from the TSS of rne. (B) Secondary structure of the U‐rich site that forms part of the rne 5′ UTR predicted by RNAfold on the ViennaRNA website with default settings and visualized using VARNA version 3.93. RNA 3′ ends mapped by 3′ RACE and 5′ ends mapped by TIER‐seq are indicated by blue and red arrows, respectively. The RNase E consensus sequence suggested by TIER‐seq (+2U rule: uridine at 2 nt downstream of the cleavage site; −3/4 A rule: adenine at 3–4 nt upstream) is also shown.
Figure 6
Figure 6
In vitro RNase E cleavage assay. (A) Summary of the cleavage of the rne 5′ UTR transcript by RNase E recombinant protein. The rne 5′ UTR transcript and the major products detected in the assay are shown, together with the locations at which probes that recognize different regions within the rne 5′ UTR transcript hybridize (Figure S4D and Table S2). (B) In vitro transcripts of the rne 5′ UTR were incubated with (+) and without (−) recombinant Synechocystis RNase E, and the resulting RNA cleavage patterns were visualized by ethidium bromide staining. Fragment sizes were estimated using NEB ssRNA markers. The major bands generated by RNase E digestion are marked by red asterisk and hash symbol. The red asterisk marks a longer fragment that is similar in length to a fragment that could extend from the TSS to the two major 3′ ends as determined by 3′ RACE (Figure 5). (C) Northern blot analysis of RNase E‐digested rne 5′ UTR transcripts. In vitro transcripts of the rne 5′ UTR were incubated with (+) and without (−) recombinant Synechocystis RNase E. After separation of the digestion products on PAA gels and blotting, the membranes were hybridized with specific probes (Figure S4D and Table S2). (D, E) In vitro RNase E cleavage assays using mutant rne 5′ UTR transcripts and protection of the transcripts from RNase E attack. (D) Scheme of point mutations within the rne 5′ UTR transcript and the sequences of oligo‐RNAs used in the protection assay. The 3′ ends of the rne 5′ UTR, mapped by 3′ RACE, are indicated by gray arrows. (E) RNase E cleavage assay (left) and protection assay (right). The RNA cleavage patterns were visualized on ethidium bromide (EtBr)‐stained 7 M urea–6% PAA gels (upper image) and analyzed by northern blot hybridization using probe 2 (lower image). The specific bands generated by RNase E digestion are marked by the same asterisk and hash symbols.
Figure 7
Figure 7
Hypothetical model of the regulation of RNase E expression in Synechocystis 6803. (A) The 5′ UTR of the rne message contains an RNase E‐sensitive U‐box. The (initial) endonucleolytic cleavage by RNase E destabilizes the UTR and might also lead to termination of transcription. Regardless of the exact molecular mechanism, termination is the main factor that accounts for differences in expression of the 5′ UTR and the coding region. Additional factors might be involved in these processes. In the absence of UV stress, 95.9% of all RNA polymerase molecules terminate at a point before the coding region, and only 4.1% transcribe the full‐length message. Under UV stress conditions, the percentage of prematurely terminating polymerases decreases to 65.3%. (B) Hypothetical model of the autoregulatory negative feedback loop. Under normal growth conditions, the number of rne transcripts is maintained at a low level by a combination of RNA cleavage and transcription termination. When UV stress occurs, the number of alternative RNase E targets increases, and the stability of the RNase E protein is reduced. As a result, less RNase E activity is allocated to its own UTR, the autoregulation is relieved, and the system reaches a new equilibrium in which the concentrations of RNase E mRNA and protein are higher.

Similar articles

Cited by

References

    1. Vogel C, Marcotte EM. Insights into the regulation of protein abundance from proteomic and transcriptomic analyses. Nat Rev Genet. 2012;13:227–32. - PMC - PubMed
    1. Coburn GA, Mackie GA. Degradation of mRNA in Escherichia coli: an old problem with some new twists. Prog Nucleic Acid Res Mol Biol. 1999;62:55–108. - PubMed
    1. Deutscher MP. Degradation of RNA in bacteria: comparison of mRNA and stable RNA. Nucleic Acids Res. 2006;34:659–66. - PMC - PubMed
    1. Mackie GA. RNase E: at the interface of bacterial RNA processing and decay. Nat Rev Microbiol. 2013;11:45–57. - PubMed
    1. Ehretsmann CP, Carpousis AJ, Krisch HM. Specificity of Escherichia coli endoribonuclease RNase E: in vivo and in vitro analysis of mutants in a bacteriophage T4 mRNA processing site. Genes Dev. 1992;6:149–59. - PubMed