

Type 1 diabetes impairs the activity of rat testicular somatic and germ cells through NRF2/NLRP3 pathway-mediated oxidative stress
- PMID: 38818504
- PMCID: PMC11137174
- DOI: 10.3389/fendo.2024.1399256
Type 1 diabetes impairs the activity of rat testicular somatic and germ cells through NRF2/NLRP3 pathway-mediated oxidative stress
Abstract
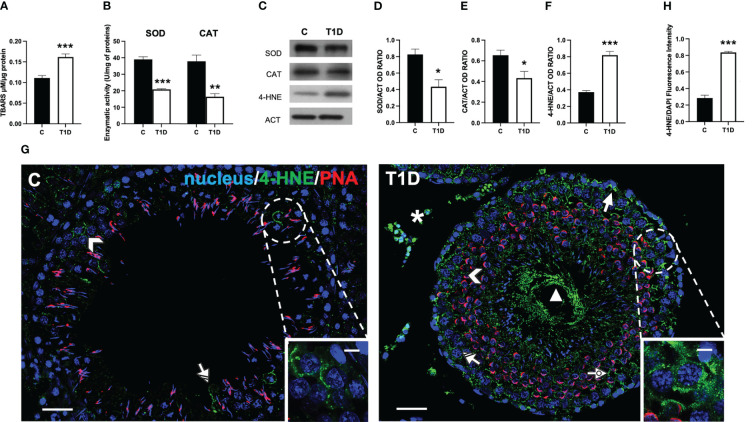
Background: It is well known that metabolic disorders, including type 1 diabetes (T1D), are often associated with reduced male fertility, mainly increasing oxidative stress and impairing the hypothalamus-pituitary-testis (HPT) axis, with consequently altered spermatogenesis and reduced sperm parameters. Herein, using a rat model of T1D obtained by treatment with streptozotocin (STZ), we analyzed several parameters of testicular activity.
Methods: A total of 10 adult male Wistar rats were divided into two groups of five: control and T1D, obtained with a single intraperitoneal injection of STZ. After 3 months, the rats were anesthetized and sacrificed; one testis was stored at -80°C for biochemical analysis, and the other was fixed for histological and immunofluorescence analysis.
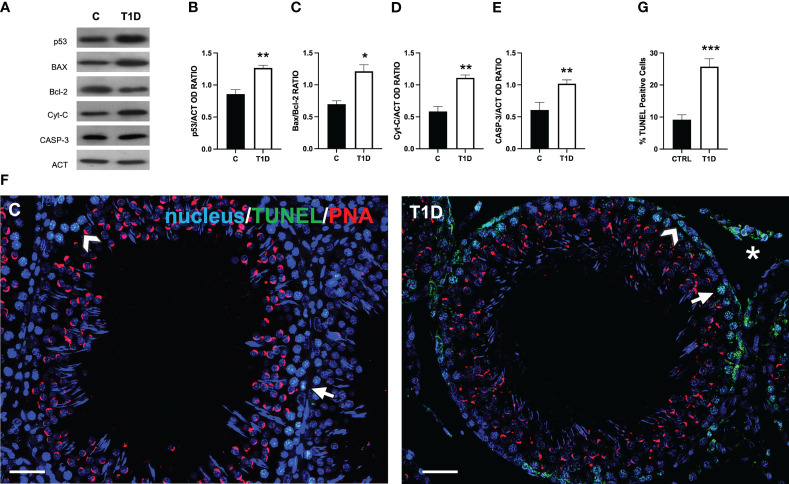
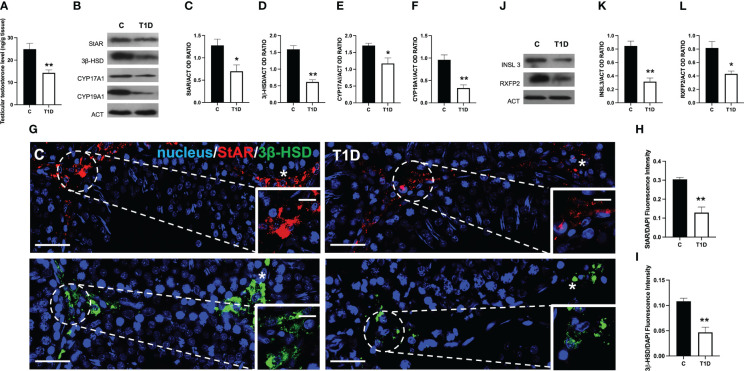
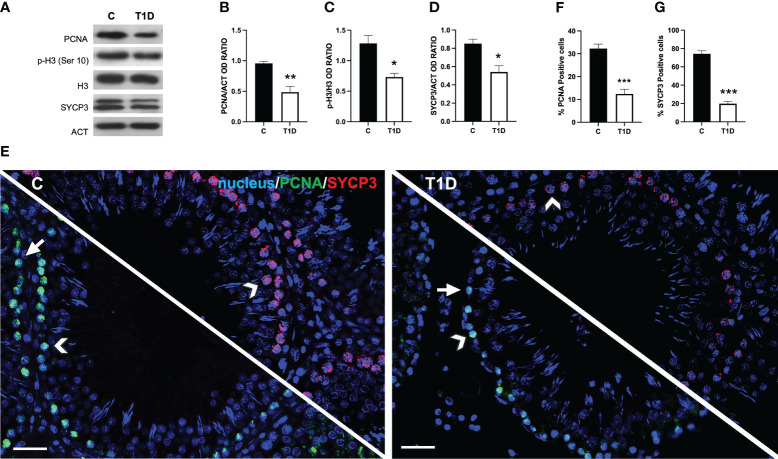
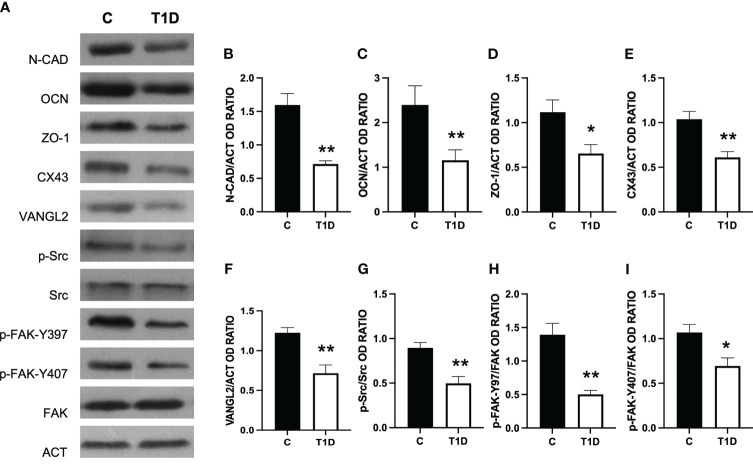
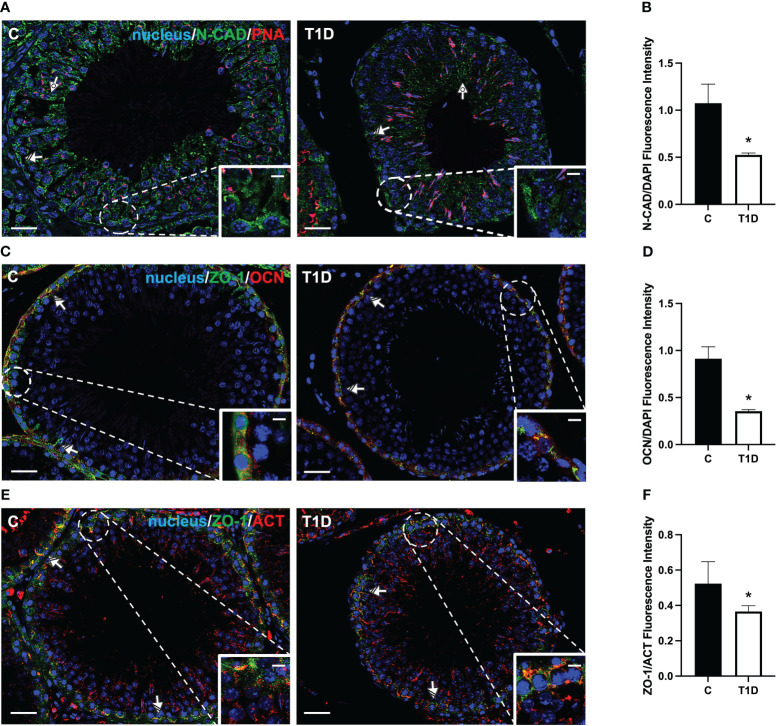
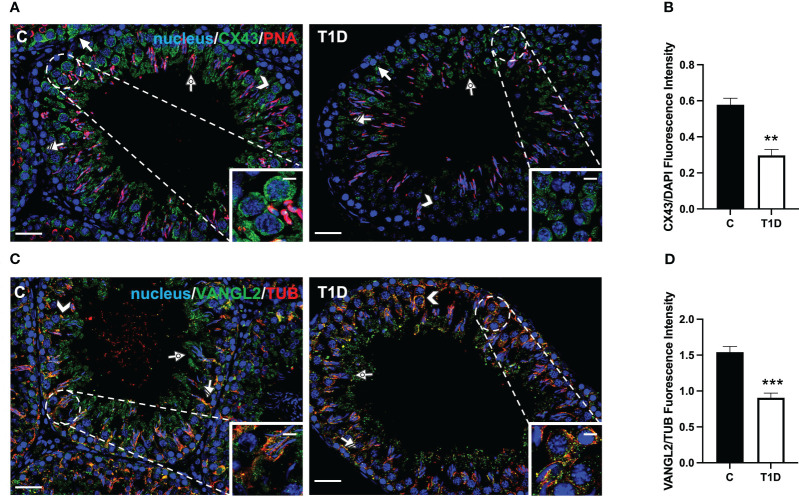
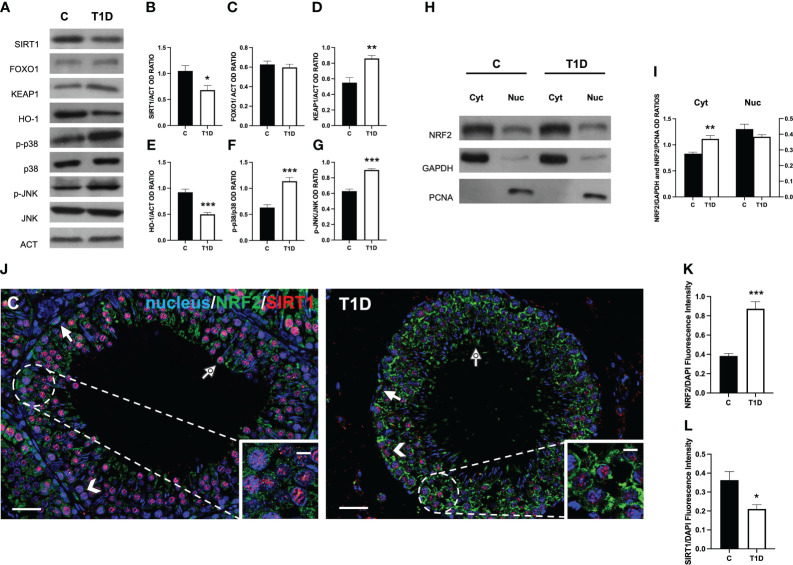
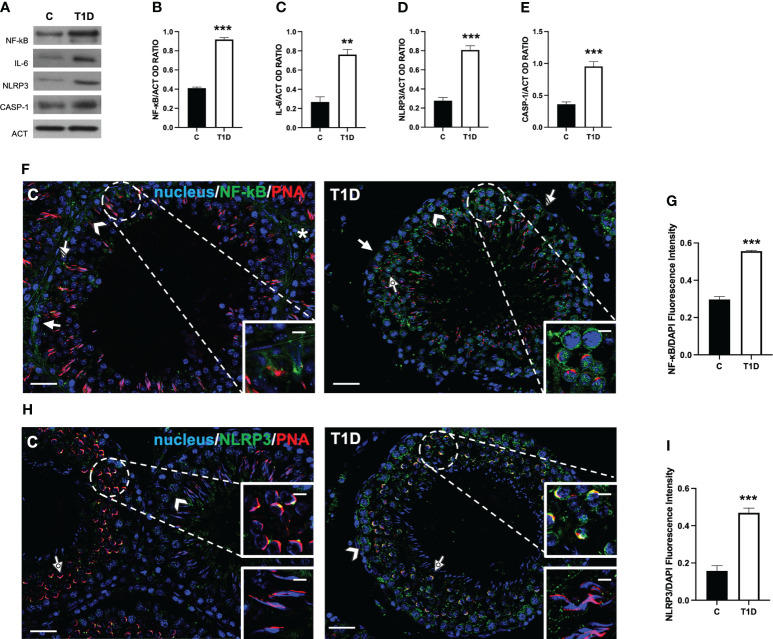
Results: The data confirmed that T1D induced oxidative stress and, consequently, alterations in both testicular somatic and germ cells. This aspect was highlighted by enhanced apoptosis, altered steroidogenesis and Leydig cell maturity, and impaired spermatogenesis. In addition, the blood-testis barrier integrity was compromised, as shown by the reduced levels of structural proteins (N-cadherin, ZO-1, occludin, connexin 43, and VANGL2) and the phosphorylation status of regulative kinases (Src and FAK). Mechanistically, the dysregulation of the SIRT1/NRF2/MAPKs signaling pathways was proven, particularly the reduced nuclear translocation of NRF2, affecting its ability to induce the transcription of genes encoding for antioxidant enzymes. Finally, the stimulation of testicular inflammation and pyroptosis was also confirmed, as highlighted by the increased levels of some markers, such as NF-κB and NLRP3.
Conclusion: The combined data allowed us to confirm that T1D has detrimental effects on rat testicular activity. Moreover, a better comprehension of the molecular mechanisms underlying the association between metabolic disorders and male fertility could help to identify novel targets to prevent and treat fertility disorders related to T1D.
Keywords: INSL3; RXFP2; SIRT1; apoptosis; blood-testis barrier; inflammasome; spermatogenesis; steroidogenesis.
Copyright © 2024 Venditti, Romano, Boccella, Haddadi, Biasi, Maione and Minucci.
Conflict of interest statement
The authors declare that the research was conducted in the absence of any commercial or financial relationships that could be construed as a potential conflict of interest. The author(s) declared that they were an editorial board member of Frontiers, at the time of submission. This had no impact on the peer review process and the final decision.
Figures
Similar articles
-
Impact of Type 1 Diabetes on Testicular Microtubule Dynamics, Sperm Physiology, and Male Reproductive Health in Rat.Int J Mol Sci. 2025 May 10;26(10):4579. doi: 10.3390/ijms26104579. Int J Mol Sci. 2025. PMID: 40429724 Free PMC article.
-
A short-term high-fat diet alters rat testicular activity and blood-testis barrier integrity through the SIRT1/NRF2/MAPKs signaling pathways.Front Endocrinol (Lausanne). 2023 Oct 27;14:1274035. doi: 10.3389/fendo.2023.1274035. eCollection 2023. Front Endocrinol (Lausanne). 2023. PMID: 38027181 Free PMC article.
-
Protection by sulforaphane from type 1 diabetes-induced testicular apoptosis is associated with the up-regulation of Nrf2 expression and function.Toxicol Appl Pharmacol. 2014 Sep 1;279(2):198-210. doi: 10.1016/j.taap.2014.06.009. Epub 2014 Jun 23. Toxicol Appl Pharmacol. 2014. PMID: 24967692
-
The role of the Fas/FasL signaling pathway in environmental toxicant-induced testicular cell apoptosis: An update.Syst Biol Reprod Med. 2018 Apr;64(2):93-102. doi: 10.1080/19396368.2017.1422046. Epub 2018 Jan 4. Syst Biol Reprod Med. 2018. PMID: 29299971 Review.
-
Interplay of Ferroptosis, Cuproptosis, Autophagy and Pyroptosis in Male Infertility: Molecular Crossroads and Therapeutic Opportunities.Int J Mol Sci. 2025 Apr 8;26(8):3496. doi: 10.3390/ijms26083496. Int J Mol Sci. 2025. PMID: 40331931 Free PMC article. Review.
Cited by
-
Unlocking the dual healing powers of plant-based metallic nanoparticles: managing diabetes and tackling male infertility challenges.Front Endocrinol (Lausanne). 2025 Jul 4;16:1482127. doi: 10.3389/fendo.2025.1482127. eCollection 2025. Front Endocrinol (Lausanne). 2025. PMID: 40687580 Free PMC article. Review.
-
Oxidative-Stress-Mediated Epigenetic Dysregulation in Spermatogenesis: Implications for Male Infertility and Offspring Health.Genes (Basel). 2025 Jan 17;16(1):93. doi: 10.3390/genes16010093. Genes (Basel). 2025. PMID: 39858640 Free PMC article. Review.
-
Mitogen-Activated Protein Kinase Phosphatase-2 Deletion Promotes Hyperglycemia and Susceptibility to Streptozotocin-Induced Diabetes in Female Mice In Vivo.Cells. 2025 Feb 12;14(4):261. doi: 10.3390/cells14040261. Cells. 2025. PMID: 39996734 Free PMC article.
-
Impact of Type 1 Diabetes on Testicular Microtubule Dynamics, Sperm Physiology, and Male Reproductive Health in Rat.Int J Mol Sci. 2025 May 10;26(10):4579. doi: 10.3390/ijms26104579. Int J Mol Sci. 2025. PMID: 40429724 Free PMC article.
References
-
- Levine H, Jørgensen N, Martino-Andrade A, Mendiola J, Weksler-Derri D, Jolles M, et al. . Temporal trends in sperm count: a systematic review and meta-regression analysis of samples collected globally in the 20th and 21st centuries. Hum Reprod Update. (2023) 29:157–76. doi: 10.1093/humupd/dmac035 - DOI - PubMed
MeSH terms
Substances
LinkOut - more resources
Full Text Sources
Medical
Research Materials
Miscellaneous