. 2024 Dec;56(1):2357742.
doi: 10.1080/07853890.2024.2357742. Epub 2024 May 31.

Comprehensive analysis of abnormal methylation modification differential expression mRNAs between low-grade and high-grade intervertebral disc degeneration and its correlation with immune cells

Affiliations

Comprehensive analysis of abnormal methylation modification differential expression mRNAs between low-grade and high-grade intervertebral disc degeneration and its correlation with immune cells

Xuehu Xie et al. Ann Med. 2024 Dec.

Abstract

Background: Intervertebral disc degeneration (IDD) is an important cause of low back pain. The aim of this study is to identify the potential molecular mechanism of abnormal methylation-modified DNA in the progression of IDD, hoping to contribute to the diagnosis and management of IDD.

Methods: Low-grade IDD (grade I-II) and high-grade IDD (grade III-V) data were downloaded from GSE70362 and GSE129789 datasets. The abnormally methylated modified differentially expressed mRNAs (DEmRNAs) were identified by differential expression analysis (screening criteria were p < .05 and |logFC| > 1) and differential methylation analysis (screening criteria were p < .05 and |δβ| > 0.1). The classification models were constructed, and the receiver operating characteristic analysis was also carried out. In addition, functional enrichment analysis and immune correlation analysis were performed and the miRNAs targeted for the abnormally methylated DEmRNAs were predicted. Finally, expression validation was performed using real-time PCR.

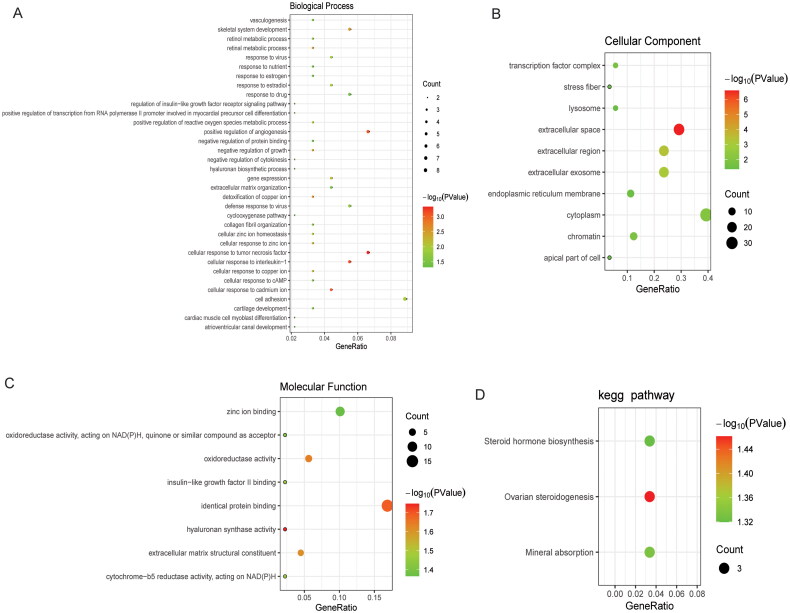
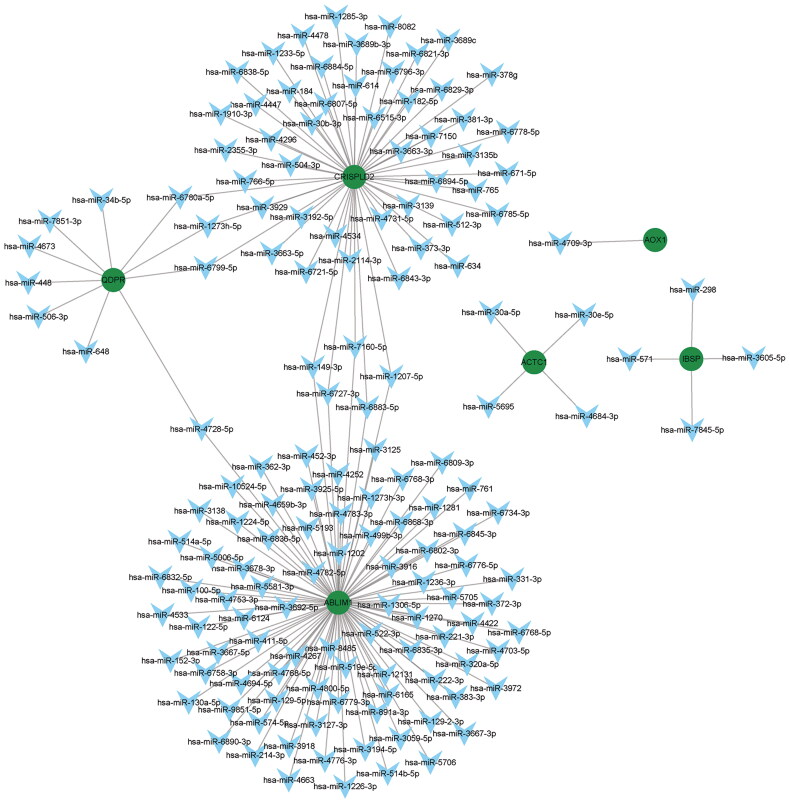
Results: Compared with low-grade IDD, seven abnormal methylation-modified DEmRNAs (AOX1, IBSP, QDPR, ABLIM1, CRISPLD2, ACTC1 and EMILIN1) were identified in high-grade IDD, and the classification models of random forests (RF) and support vector machine (SVM) were constructed. Moreover, seven abnormal methylation-modified DEmRNAs and classification models have high diagnostic accuracy (area under the curve [AUC] > 0.8). We also found that AUC values of single abnormal methylation-modified DEmRNA were all lower than those of RF and SVM classification models. Pearson correlation analysis found that macrophages M2 and EMILIN1 had significant negative correlation, while macrophages M2 and IBSP had significant positive correlation. In addition, four targeted relationship pairs (hsa-miR-4728-5p-QDPR, hsa-miR-4533-ABLIM1, hsa-miR-4728-5p-ABLIM1 and hsa-miR-4534-CRISPLD2) and multiple signalling pathways (for example, PI3K-AKT signalling pathway, osteoclast differentiation and calcium signalling pathway) were also identified that may be involved in the progression of IDD.

Conclusion: The identification of abnormal methylation-modified DEmRNAs and the construction of classification models in this study were helpful for the diagnosis and management of IDD progression.

Keywords: Intervertebral disc degeneration; biomarkers; diagnostic; mRNAs; methylation.


Conflict of interest statement

The authors declare that they have no conflict of interest.

Figures

Figure 1.
Figure 1.
Volcano map and heat map of DEmRNAs. A: Volcano map of DEmRNAs. The blue dot and red dot represent the up- and down-regulated DEmRNAs, respectively. X-axis and Y-axis represent − log10 (p value) and log2 fold change, respectively. B: Heat map of DEmRNAs. The full chain method combined with Euclidean distance was used to construct the cluster heat map. Red and green represent high and low expression DEmRNAs, respectively. LIDD: low-grade intervertebral disc degeneration; HIDD: high-grade intervertebral disc degeneration.
Figure 2.
Figure 2.
Functional enrichment analysis of DEmRNAs. A: BP category in GO functional enrichment analysis of DEmRNAs; B: CC category in GO functional enrichment analysis of DEmRNAs; C: MF category in GO functional enrichment analysis of DEmRNAs; D: KEGG functional enrichment analysis of DEmRNAs. GO: Gene Ontology; KEGG: Kyoto Encyclopedia of Genes and Genomes; BP: biological process; CC: cellular components; MF: molecular function.
Figure 3.
Figure 3.
Volcano map and Manhattan map of DMSs. A: Volcano map of DMSs. The blue dot and red dot represent hypermethylated and hypomethylated DMSs, respectively. B: Manhattan map of DMSs.
Figure 4.
Figure 4.
Functional enrichment analysis of abnormally methylated modified mRNAs. A: BP category (top 15) in GO functional enrichment analysis of abnormally methylated modified mRNAs; B: CC category (top 15) in GO functional enrichment analysis of abnormally methylated modified mRNAs; C: MF category (top 15) in GO functional enrichment analysis of abnormally methylated modified mRNAs; D: KEGG functional enrichment analysis (top 15) of abnormally methylated modified mRNAs. GO: Gene Ontology; KEGG: Kyoto Encyclopedia of Genes and Genomes; BP: biological process; CC: cellular components; MF: molecular function.
Figure 5.
Figure 5.
Identification of abnormal methylation-modified DEmRNAs and construction of classification models. A: Venn diagram of hypermethylated modified mRNAs and down-regulated DEmRNAs; B: Venn diagram of hypomethylated modified mRNAs and up-regulated DEmRNAs; C: RF classification model based on seven abnormal methylation-modified DEmRNAs; D: SVM classification model based on seven abnormal methylation-modified DEmRNAs. RF: random forest; SVM: support vector machine; AUC: area under the curve; ROC: receiver operating characteristic.
Figure 6.
Figure 6.
ROC analysis of ABLIM1 (A), ACTC1 (B), AOX1 (C), CRISPLD2 (D), EMILIN1 (E), IBSP (F) and QDPR (G). AUC: area under the curve; ROC: receiver operating characteristic.
Figure 7.
Figure 7.
Analysis of correlation between immune cells and abnormal methylation-modified DEmRNAs. A: Stacked histogram of the proportion of each immune cell in the sample analysed by the CIBERSORT method; B: The difference of immune cell infiltration between low-grade IDD and high-grade IDD groups was analysed based on immune cell scores; C: The correlation between immune cells in IDD; D: Pearson correlations between gamma delta T cells, macrophages M and dendritic cells activated and abnormal methylation-modified DEmRNAs (AOX1, IBSP, QDPR, ABLIM1, CRISPLD2, ACTC1 and EMILIN1); E: Macrophages M2 and EMILIN1 was significantly negatively correlated; F: Macrophages M2 and IBSP were significantly positively correlated. LIDD: low-grade intervertebral disc degeneration; HIDD: high-grade intervertebral disc degeneration. *p < .05; **p < .01.
Figure 8.
Figure 8.
mRNA–miRNA interaction network.
Figure 9.
Figure 9.
The expression levels of EMILIN1 (A), AOX1 (B), IBSP (C), QDPR (D), ABLIM1 (E), CRISPLD2 (F) and ACTC1 (G) were verified by real-time PCR. LIDD: low-grade intervertebral disc degeneration; HIDD: high-grade intervertebral disc degeneration. ***p < .001.

References

    1. Francisco V, Pino J, González-Gay MÁ, et al. . A new immunometabolic perspective of intervertebral disc degeneration. Nat Rev Rheumatol. 2022;18(1):1–16. doi: 10.1038/s41584-021-00713-z. - DOI - PubMed
    1. Xin J, Wang Y, Zheng Z, et al. . Treatment of intervertebral disc degeneration. Orthop Surg. 2022;14(7):1271–1280. doi: 10.1111/os.13254. - DOI - PMC - PubMed
    1. Rivera Tapia ED, Meakin JR, Holsgrove TP.. In-vitro models of disc degeneration – a review of methods and clinical relevance. J Biomech. 2022;142:111260. doi: 10.1016/j.jbiomech.2022.111260. - DOI - PubMed
    1. Buckwalter JA. Aging and degeneration of the human intervertebral disc. Spine (Phila Pa 1976). 1995;20(11):1307–1314. doi: 10.1097/00007632-199506000-00022. - DOI - PubMed
    1. Shi Q, Xu L, Zeng X.. Sirtuin 1 participates in intervertebral disc degeneration via the nicotinamide phosphoribosyl transferase/nicotinamide adenine dinucleotide/sirtuin 1 pathway responsible for regulating autophagy of nucleus pulposus cells. Exp Ther Med. 2022;23(4):267. doi: 10.3892/etm.2022.11193. - DOI - PMC - PubMed