. 2024 Jul 23;98(7):e0047824.
doi: 10.1128/jvi.00478-24. Epub 2024 May 31.

Human coronavirus OC43 infection remodels connexin 43-mediated gap junction intercellular communication in vitro

Affiliations

Human coronavirus OC43 infection remodels connexin 43-mediated gap junction intercellular communication in vitro

Souvik Karmakar et al. J Virol. .

Abstract

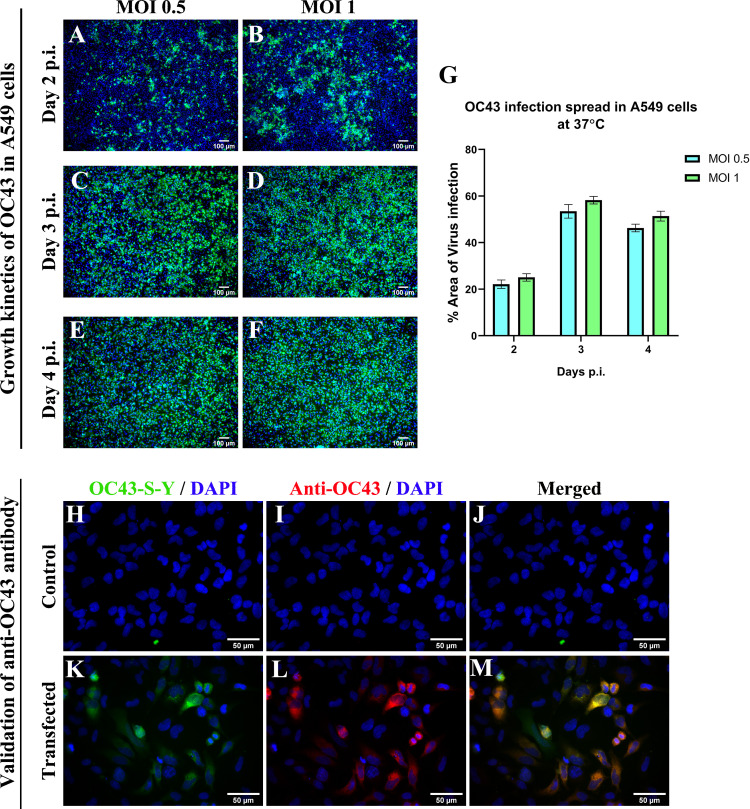
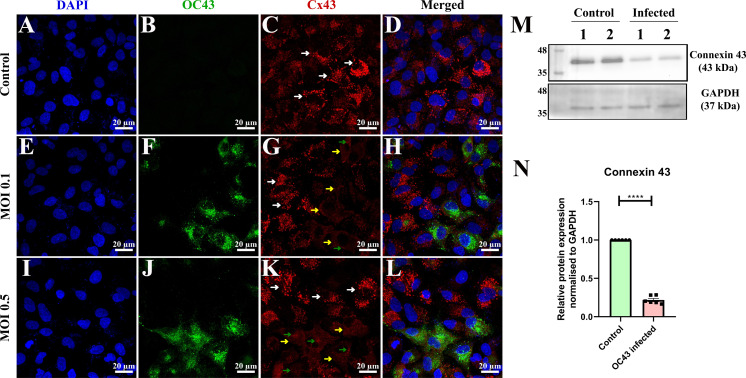
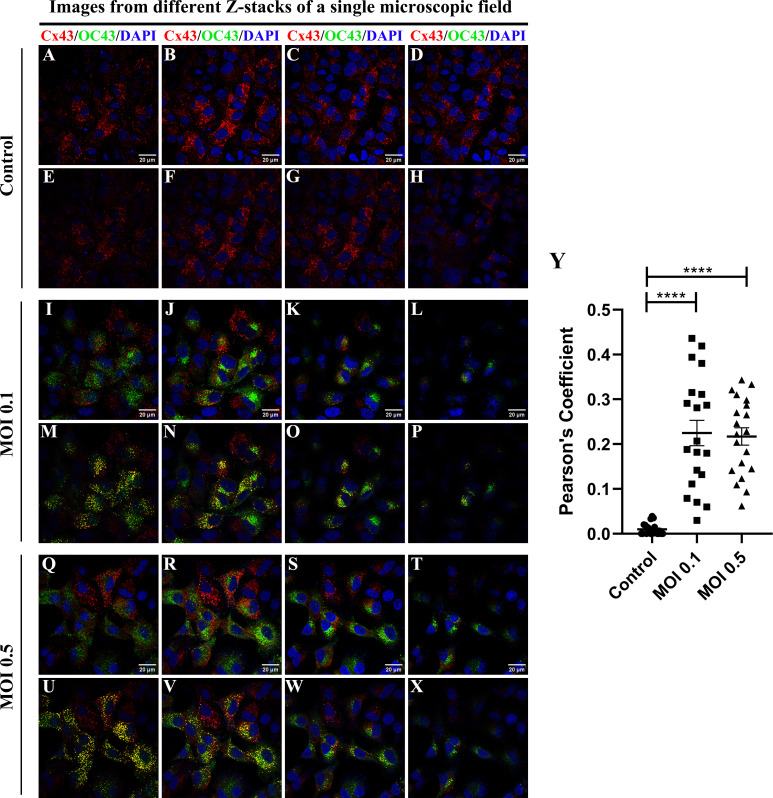
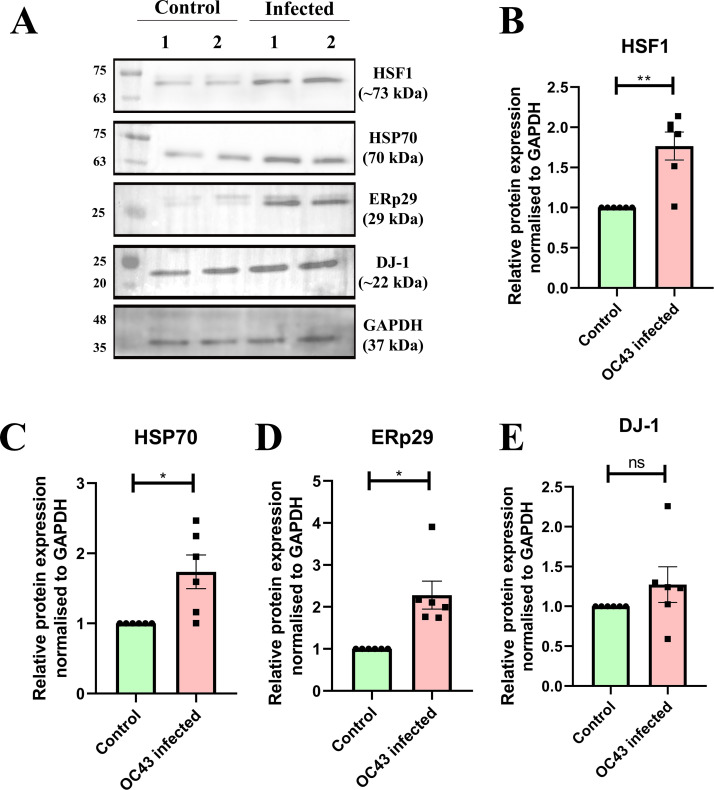
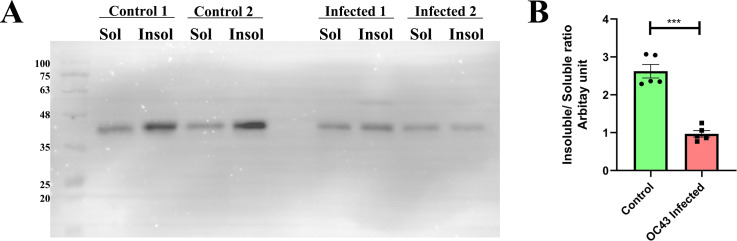
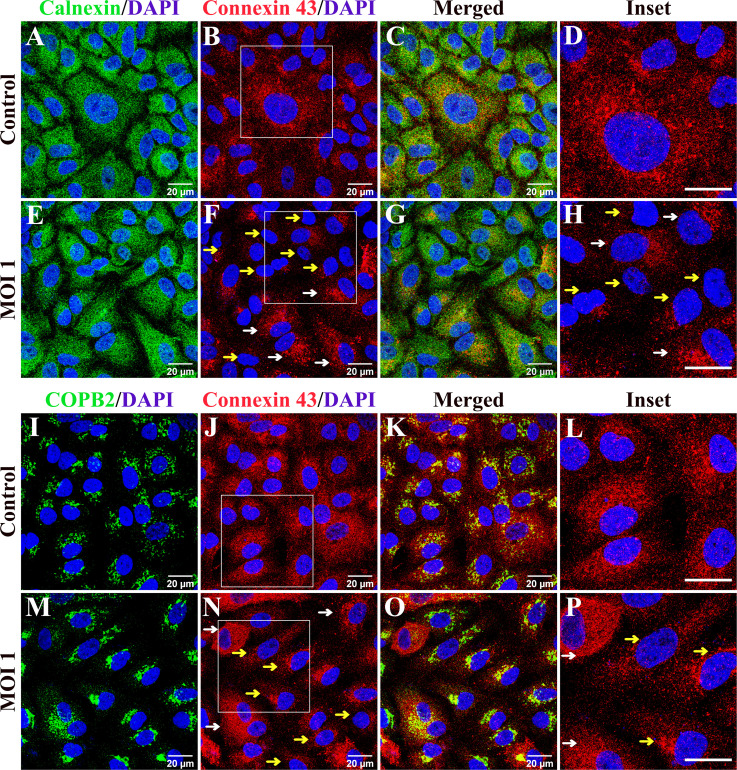
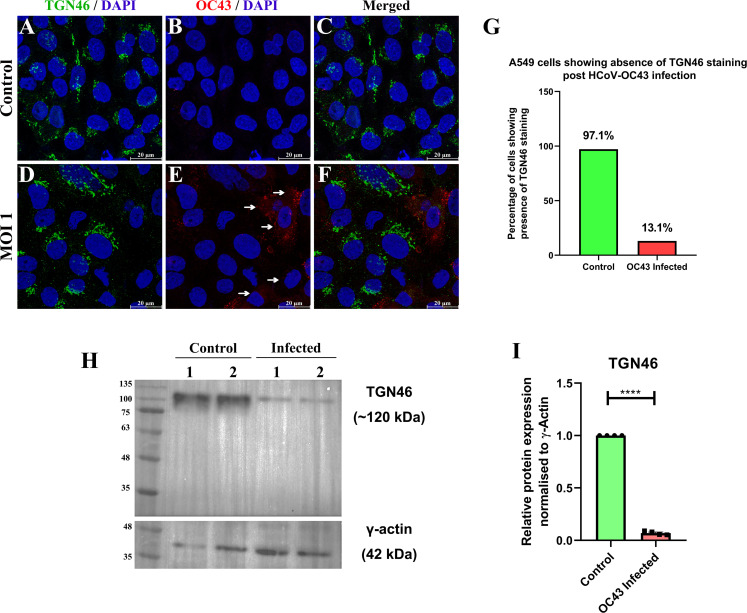
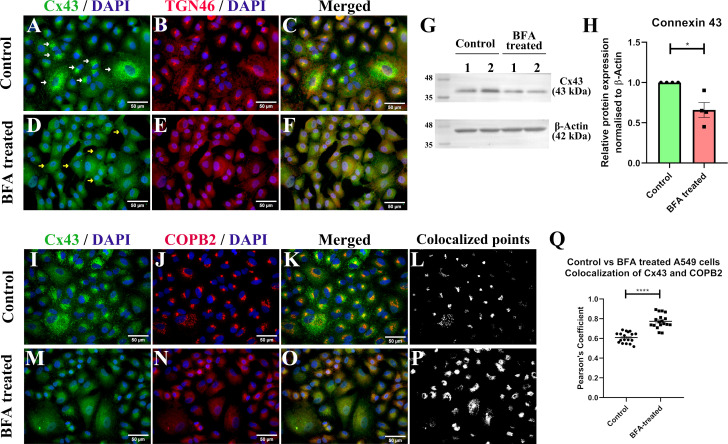
β-coronaviruses cause acute infection in the upper respiratory tract, resulting in various symptoms and clinical manifestations. OC43 is a human β-coronavirus that induces mild clinical symptoms and can be safely studied in the BSL2 laboratory. Due to its low risk, OC43 can be a valuable and accessible model for understanding β-coronavirus pathogenesis. One potential target for limiting virus infectivity could be gap junction-mediated communication. This study aims to unveil the status of cell-to-cell communications through gap junctions in human β-coronavirus infection. Infection with OC43 leads to reduced expression of Cx43 in A549, a lung epithelial carcinoma cell line. Infection with this virus also shows a significant ER and oxidative stress increase. Internal localization of Cx43 is observed post-OC43 infection in the endoplasmic reticulum-Golgi intermediate compartment (ERGIC) region, which impairs the gap junction communication between two adjacent cells, confirmed by Lucifer yellow dye transfer assay. It also affects hemichannel formation, as depicted by the EtBr uptake assay. Impairment of Cx43 trafficking and the ability to form hemichannels and functional GJIC are hampered by virus-induced Golgi apparatus disruption. Altogether, these results suggest that several physiological changes accompany OC43 infection in A549 cells and can be considered an appropriate model system for understanding the differences in gap junction communication post-viral infections. This model system can provide valuable insights for developing therapies against human β-coronavirus infections.IMPORTANCEThe enduring impact of the recent SARS-CoV-2 pandemic underscores the importance of studying human β-coronaviruses, advancing our preparedness for future coronavirus infections. As SARS-CoV-2 is highly infectious, another human β-coronavirus OC43 can be considered an experimental model. One of the crucial pathways that can be considered is gap junction communication, as it is vital for cellular homeostasis. Our study seeks to understand the changes in Cx43-mediated cell-to-cell communication during human β-coronavirus OC43 infection. In vitro studies showed downregulation of the gap junction protein Cx43 and upregulation of the endoplasmic reticulum and oxidative stress markers post-OC43 infection. Furthermore, HCoV-OC43 infection causes reduced Cx43 trafficking, causing impairment of functional hemichannel and GJIC formation by virus-mediated Golgi apparatus disruption. Overall, this study infers that OC43 infection reshapes intercellular communication, suggesting that this pathway may be a promising target for designing highly effective therapeutics against human coronaviruses by regulating Cx43 expression.

Keywords: Golgi apparatus disruption; OC43; connexin 43; gap junction communication; human β-coronavirus.


Conflict of interest statement

The authors declare no conflict of interest.

Figures

Fig 1
Fig 1
Viral infection in A549 cells on different days p.i. Infection with OC43 in A549 cells was standardized based on the immunofluorescence staining of virus spread. A549 cells were infected with MOIs 0.5 and 1 of OC43, fixed at different time points, immunostained, and imaged in an IX-81 microscope (A-F) The infection spread was quantified using ImageJ software and plotted using the absolute percentage area of virus infection (G). Data expressed as mean ± SEM of three individual experiments. To confirm the specificity of the anti-OC43 antibody, HeLa cells were transiently transfected with a plasmid expressing the HCoV–OC43 spike protein. The cells were transfected using Lipofectamine 2000 at a ratio of 3:1 (Lipofectamine/DNA). Microscopic imaging of control (H-J) and transfected (K-M) cells using an Olympus IX-81 microscope showed a detectable signal from the anti-OC43 antibody in cells expressing the YFP-tagged OC43 spike protein, thus confirming the specificity of the antibody toward the OC43 spike protein. The scale bar of the images (A-F) depicts 100 microns, and images (H-M) depict 50 microns.
Fig 2
Fig 2
Connexin 43 expression in control and HCoV-OC43 infected A549 cells. A549 cells were immunostained with the anti-OC43 antibody and anti-Cx43 antibody and counterstained with DAPI. Images correspond to different sets, such as control (A-D), OC43-infected MOI 0.1 (E-H), and OC43-infected MOI 0.5 (I-L). The non-infected cells showing punctate staining of Cx43 are marked with white arrows (C, G, and K), and the OC43-infected cells showing reduced Cx43 punctate staining are marked with yellow arrows (G and K). Infected cells showing perinuclear Cx43 staining are marked with green arrows (G and K). D, H, and L represent merged images of the different channels. A Western blot, using 10 µg of protein loaded per well, determined the overall expression of connexin 43 (M).Results of densitometric analysis using ImageJ software of the bands obtained were plotted (N). Control and infected lanes marked as 1 and 2, respectively, represent technical replicates. Data expressed as mean ± SEM of three individual replicates. The significant differences are indicated by *P < 0.05, **P < 0.01, ***P < 0.001, and ****P < 0.0001. The scale bar for all the images is 20 microns.
Fig 3
Fig 3
Colocalization of the OC43 spike protein with Cx43 in A549-infected cells. A549 cells were immunostained with anti-OC43 and anti-Cx43 antibodies and were counterstained with DAPI. Images shown correspond to different sets, such as control (A-H), A549 cells infected at MOI 0.1 (I-P), and at MOI 0.5 (Q-X). Images shown in each of the panels for control (A-D), MOI 0.1 (I-L), and MOI 0.5 (Q-T) represent different Z-stack positions of a microscopic field. The images E–H, M–P, and U–X show the colocalizing points within the Z-stacks, which are highlighted in yellow. Graph Y represents Pearson’s correlation coefficient of different sets. The significant differences are indicated by *P < 0.05, **P < 0.01, ***P < 0.001, and ****P < 0.0001. The scale bar for all the images is 20 microns.
Fig 4
Fig 4
HCoV–OC43 induces ER stress and oxidative stress in A549 cells. Western blot analysis was performed using 10 µg of protein loaded per well to determine the expression of different stress markers. Representative immunoblots show the upregulation of different stress markers in infected samples compared to control (A). Scatterplots representing the densitometric analysis of the different stress markers normalized to the loading control GAPDH (B-E). (B) represents significant upregulation of HSF1, (C) represents upregulation of HSP70, (D) represents significant upregulation of ERp29, and (E) represents a trend in upregulation of DJ-1. Control and infected lanes marked as 1 and 2, respectively, represent technical replicates. Data expressed as mean ± SEM of three individual replicates. The significant differences are indicated by *P < 0.05, **P < 0.01, ***P < 0.001, and ****P < 0.0001.
Fig 5
Fig 5
HCoV–OC43 infection in A549 cells impairs Cx43 trafficking to the cell surface. To confirm the internal localization of Cx43 upon OC43 infection, a Triton X-100 solubilization assay was performed (A), and the densitometric analysis of the bands obtained revealed that the Insol/sol fraction of the control is greater than that of the infected samples (B). Data expressed as mean ± SEM of three individual replicates. The significant differences are indicated by *P < 0.05, **P < 0.01, ***P < 0.001, and ****P < 0.0001.
Fig 6
Fig 6
Cx43 localizes in the ERGIC region post-OC43 infection in A549 cells. To determine the internal localization of Cx43 post-infection in subcellular compartments, control and infected cells were immunostained with anti-calnexin (A-H) and anti-COPB2 (I-P) The control cells expressing Cx43 staining are marked with white arrows, and the infected cells with perinuclear Cx43 are marked with yellow arrows (F, H, N, and P). Upon visual observation, it is inferred that, upon OC43 infection, Cx43 trafficking is impaired and localizes in the ERGIC compartment of the cells. The insets are digitally zoomed. The scale bar for all the images is 20 microns.
Fig 7
Fig 7
HCoV–OC43 impairs functional GJIC and hemichannel formation. For understanding the status of GJIC functionality, the LY dye was scrape-loaded in control (A) and MOIs 0.5 (C) and 1 (E) OC43-infected cells. It is observed that LY dye uptake and the distance traveled were less in infected A549 cells. Images B, D, and F are DIC images of the respective immunofluorescence fields. The distance traveled by the dye was quantified in ImageJ software, and absolute values were plotted in a violin plot (G). An EtBr uptake assay was performed with control and OC43-infected cells (H and I) to determine hemichannel activity. The absolute value for intensity was measured in ImageJ software and was plotted in a violin plot (J). The scale bar for the LY dye transfer assay images is 100 microns, and that for all the EtBr uptake assay images is 50 microns. Data are expressed as mean ± SEM of three individual replicates. The significant differences are indicated by *P < 0.05, **P < 0.01, ***P < 0.001, and ****P < 0.0001.
Fig 8
Fig 8
HCoV–OC43 infection disrupts the Golgi apparatus in A549 cells. To determine the mechanism of impaired Cx43-mediated GJIC, the status of the Golgi apparatus was studied through immunofluorescence staining and Western blot. Control and infected cells were stained with anti-TGN46 and anti-OC43 antibodies and counterstained with DAPI. Images A, B, and C represent control A549 cells, and images D, E, and F represent OC43-infected A549 cells. The white arrows depict infected cells either with complete loss of TGN46 staining or show disrupted TGN46 staining. The images were taken in a Leica SP8 confocal microscope. Images from the Olympus IX-81 microscope were analyzed, and the percentage of cells with the Golgi apparatus in both the control and infected cell populations was counted. A total of 500 cells were considered for each of the sets. The graph is shown in image G. To quantify the expression of TGN46 post-infection, 15 µg of the protein sample was loaded in each well, and Western blot analysis was performed, shown in image H. Scatterplot representing the densitometric analysis of TGN46 normalized with γ-actin is shown in image I. Control and infected lanes marked as 1 and 2, respectively, represent technical replicates. Data are expressed as mean ± SEM of two individual replicates. The significant differences are indicated by *P < 0.05, **P < 0.01, ***P < 0.001, and ****P < 0.0001. The scale bar for all the images is 20 microns.
Fig 9
Fig 9
BFA treatment reduced Cx43 punctate staining and increased Cx43 localization with COPB2. To understand the effect of virus-induced Golgi apparatus disruption on Cx43 expression, A549 cells were treated with 0.2 µg/mL BFA for 24 hours. The cells were stained with anti-Cx43 and anti-TGN46 antibodies (A-F) and counterstained with DAPI. The control cells expressing punctate staining of Cx43 are marked with white arrows in image A. The BFA-treated cells showing reduced Cx43 punctate staining are shown with yellow arrows in image D. To quantify the decrease in Cx43 expression, Western blot analysis was performed using 15 µg of the protein sample loaded in each well (G). A scatterplot representing the densitometric analysis of Cx43 normalized with β-actin is shown in image H. To understand the localization of Cx43 post-Golgi apparatus disruption, the cells were treated with BFA and stained with anti-Cx43 and anti-COPB2 antibodies and counterstained with DAPI (I-P). The colocalized points of the control set are shown in image L and the BFA-treated cells in image P. Pearson’s correlation coefficient values of colocalization are plotted in image Q as a scatterplot. The images are taken in the Olympus IX-81 microscope. Control and BFA-treated lanes marked as 1 and 2, respectively, represent technical replicates in image G. Data are expressed as mean ± SEM of two individual replicates. The significant differences are indicated by *P < 0.05, **P < 0.01, ***P < 0.001, and ****P < 0.0001. The scale bar for all the images is 50 microns.

Similar articles

Cited by

References

    1. Weber PA, Chang HC, Spaeth KE, Nitsche JM, Nicholson BJ. 2004. The permeability of gap junction channels to probes of different size is dependent on connexin composition and permeant-pore affinities. Biophys J 87:958–973. doi:10.1529/biophysj.103.036350 - DOI - PMC - PubMed
    1. Goodenough DA, Paul DL. 2009. Gap junctions. Cold Spring Harb Perspect Biol 1:a002576. doi:10.1101/cshperspect.a002576 - DOI - PMC - PubMed
    1. Li MWM, Mruk DD, Lee WM, Cheng CY. 2010. Connexin 43 is critical to maintain the homeostasis of the blood-testis barrier via its effects on tight junction reassembly. Proc Natl Acad Sci U S A 107:17998–18003. doi:10.1073/pnas.1007047107 - DOI - PMC - PubMed
    1. Li S, Armstrong N, Zhao H, Cruz-cosme R, Yang H, Zhong C, Fu W, Wang W, Yang D, Xia N, Cheng T, Tang Q. 2022. Zika virus infection downregulates connexin 43, disrupts the cardiomyocyte gap junctions and induces heart diseases in A129 mice. J Virol 96:1–18. doi:10.1128/jvi.01373-22 - DOI - PMC - PubMed
    1. Khan Z, Yaiw K-C, Wilhelmi V, Lam H, Rahbar A, Stragliotto G, Söderberg-Nauclér C. 2014. Human cytomegalovirus immediate early proteins promote degradation of connexin 43 and disrupt gap junction communication: Implications for a role in gliomagenesis. Carcinogenesis 35:145–154. doi:10.1093/carcin/bgt292 - DOI - PubMed

MeSH terms

LinkOut - more resources