. 2024 Jul 3;13(8):e240089.
doi: 10.1530/EC-24-0089. Print 2024 Aug 1.

Optimal body mass index for protecting middle-aged and elderly patients with fatty liver from future fractures

Affiliations

Optimal body mass index for protecting middle-aged and elderly patients with fatty liver from future fractures

Hsiao-Yun Yeh et al. Endocr Connect. .

Abstract

Objective: Previous studies have suggested that body mass index (BMI) should be considered when assessing the relationship between fatty liver (FL) and osteoporosis. The aim of this study was to investigate future fracture events in people with FL, focusing on the effect of BMI in both sexes.

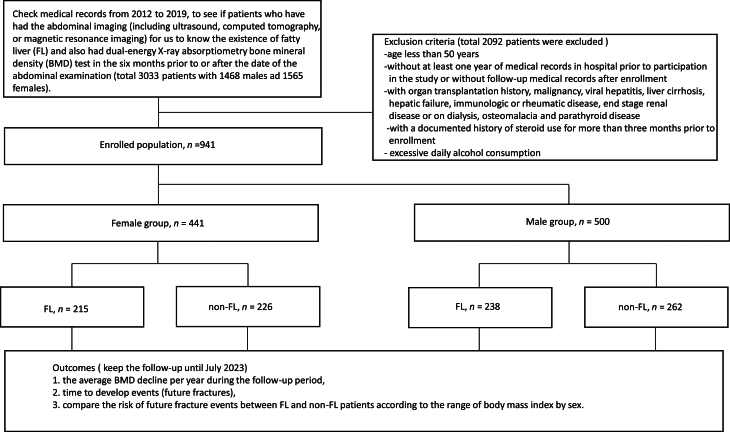
Methods: This retrospective cohort study, spanning from 2011 to 2019, enrolled 941 people, including 441 women and 500 men, aged 50 years or older who underwent liver imaging (ultrasound, computed tomography, or magnetic resonance image) and dual-energy X-ray absorptiometry (for bone mineral density measurements). The study examined predictors of osteoporosis in both sexes and the effect of different ranges of BMI (18.5-24, 24-27, and ≥27 kg/m2) on the risk of future fracture events in FL patients.

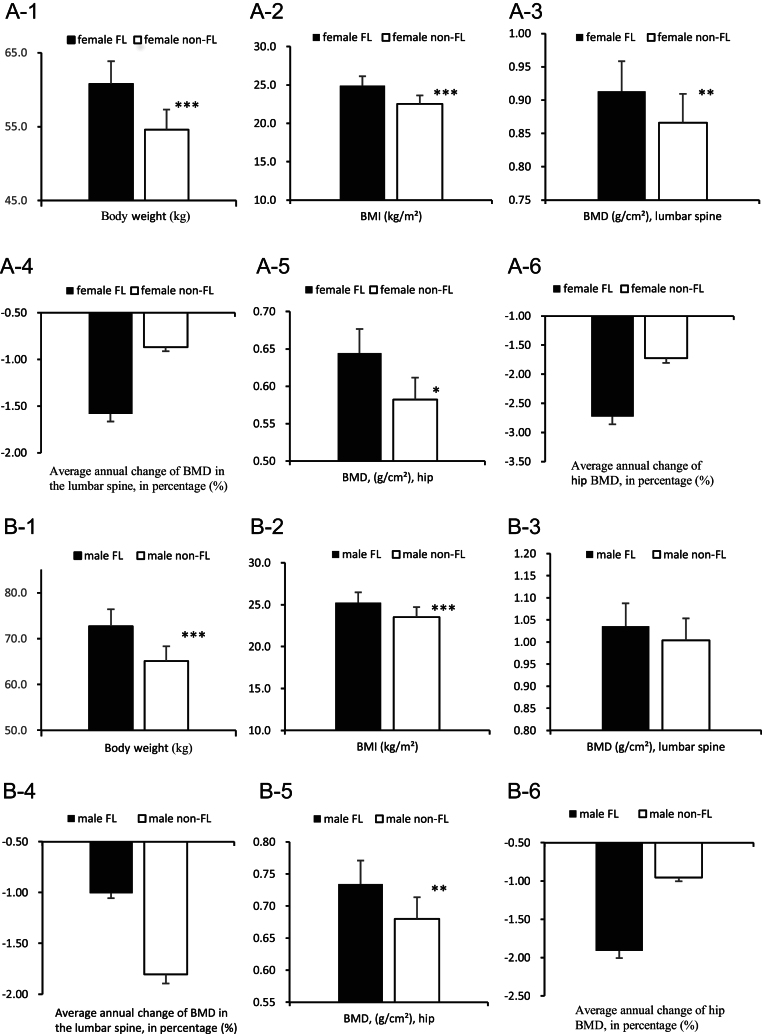
Results: The average follow-up period was 5.3 years for women and 4.2 years for men. Multivariate analysis identified age and BMI as independent risk factors of osteoporosis in both sexes. Each unit increase in BMI decreased the risk of osteoporosis by ≥10%. In both women and men with FL, a BMI of 24-27 kg/m2 offered protection against future fractures, compared to those without FL and with a BMI of 18.5-24 kg/m2.

Conclusion: The protective effect of a higher BMI against future fractures in middle-aged and elderly female and male patients with FL is not uniform and diminishes beyond certain BMI ranges.

Keywords: body mass index; bone mineral density; fatty liver; fracture; osteoporosis.


Conflict of interest statement

The authors declare that there is no conflict of interest that could be perceived as prejudicing the impartiality of the study reported.

Figures

Figure 1
Figure 1
Study design and algorithm.
Figure 2
Figure 2
Body weight, body mass index (BMI), and bone mineral density (BMD) of lumbar spine and hip in female and male patients, fatty liver (FL) vs non-fatty liver (non-FL) (A), female; (A-1) body weight (kg); (A-2) BMI (kg/m2); (A-3) BMD (g/cm2), lumbar spine; (A-4) average annual change of BMD in the lumbar spine, in percentage (%); (A-5) BMD (g/cm2), hip; (A-6) average annual change of BMD in the hip, in percentage (%). (B) male; (B-1) body weight (kg); (B-2) BMI (kg/m2); (B-3) BMD (g/cm2), lumbar spine; (B-4) average annual change of BMD in the lumbar spine, in percentage (%); (B-5) BMD (g/cm2), hip; (B-6) average annual change of BMD in the hip, in percentage. *P < 0.05; **P < 0.01; ***P < 0.001.
Figure 3
Figure 3
Kaplan–Meier future fracture-free curve in female and male patients, with and without fatty liver (FL and non-FL), and hazard ratios (HRs) for future fractures of different body mass index (BMI) categories. (A) Kaplan–Meier future fracture-free curve for all female patients; (B) HRs of developing future fractures for different BMI (kg/m2) categories in female patients by Cox regression, with non-FL women with a BMI 18.5–24 as the reference group; (B-1) before adjusting for age; (B-2) after adjusting for age; (C) Kaplan–Meier future fracture-free curve for female patients, stratified by BMI (kg/m2); (C-1) BMI < 27; (C-2) BMI ≥ 27; (D) Kaplan–Meier future fracture-free curve for all male patients; (E) HRs of developing future fractures for different BMI (kg/m2) categories in male patients by Cox regression, and non-FL men with a BMI 18.5–24 as the reference group; (E-1) before adjusting for age; (E-2) after adjusting for age; (F) Kaplan–Meier future fracture-free curve for male patients, stratified by BMI (kg/m2); (F-1) BMI < 30; and (F-2) BMI ≥ 30. *P < 0.05 vs non-FL group with a BMI 18.5–24.

Similar articles

References

    1. Riazi K Azhari H Charette JH Underwood FE King JA Afshar EE Swain MG Congly SE Kaplan GG & Shaheen AA. The prevalence and incidence of NAFLD worldwide: a systematic review and meta-analysis. Lancet Gastroenterology and Hepatology 20227851–861. (10.1016/S2468-1253(2200165-0) - DOI - PubMed
    1. Rosato V Masarone M Dallio M Federico A Aglitti A & Persico M. NAFLD and extra-hepatic comorbidities: current evidence on a multi-organ metabolic syndrome. International Journal of Environmental Research and Public Health 2019163415. (10.3390/ijerph16183415) - DOI - PMC - PubMed
    1. Su YH Chien KL Yang SH Chia WT Chen JH & Chen YC. Nonalcoholic fatty liver disease is associated with decreased bone mineral density in adults: a systematic review and meta-analysis. Journal of Bone and Mineral Research 2023381092–1103. (10.1002/jbmr.4862) - DOI - PubMed
    1. Targher G Lonardo A & Rossini M. Nonalcoholic fatty liver disease and decreased bone mineral density: is there a link? Journal of Endocrinological Investigation 201538817–825. (10.1007/s40618-015-0315-6) - DOI - PubMed
    1. Chen HJ Yang HY Hsueh KC Shen CC Chen RY Yu HC & Wang TL. Increased risk of osteoporosis in patients with nonalcoholic fatty liver disease: a population-based retrospective cohort study. Medicine 201897e12835. (10.1097/MD.0000000000012835) - DOI - PMC - PubMed

LinkOut - more resources