. 2024 Aug 1;327(2):H315-H330.
doi: 10.1152/ajpheart.00763.2023. Epub 2024 May 31.

Early- to mid-gestational testosterone excess leads to adverse cardiac outcomes in postpartum sheep

Affiliations

Early- to mid-gestational testosterone excess leads to adverse cardiac outcomes in postpartum sheep

Bashar Alkhatib et al. Am J Physiol Heart Circ Physiol. .

Abstract

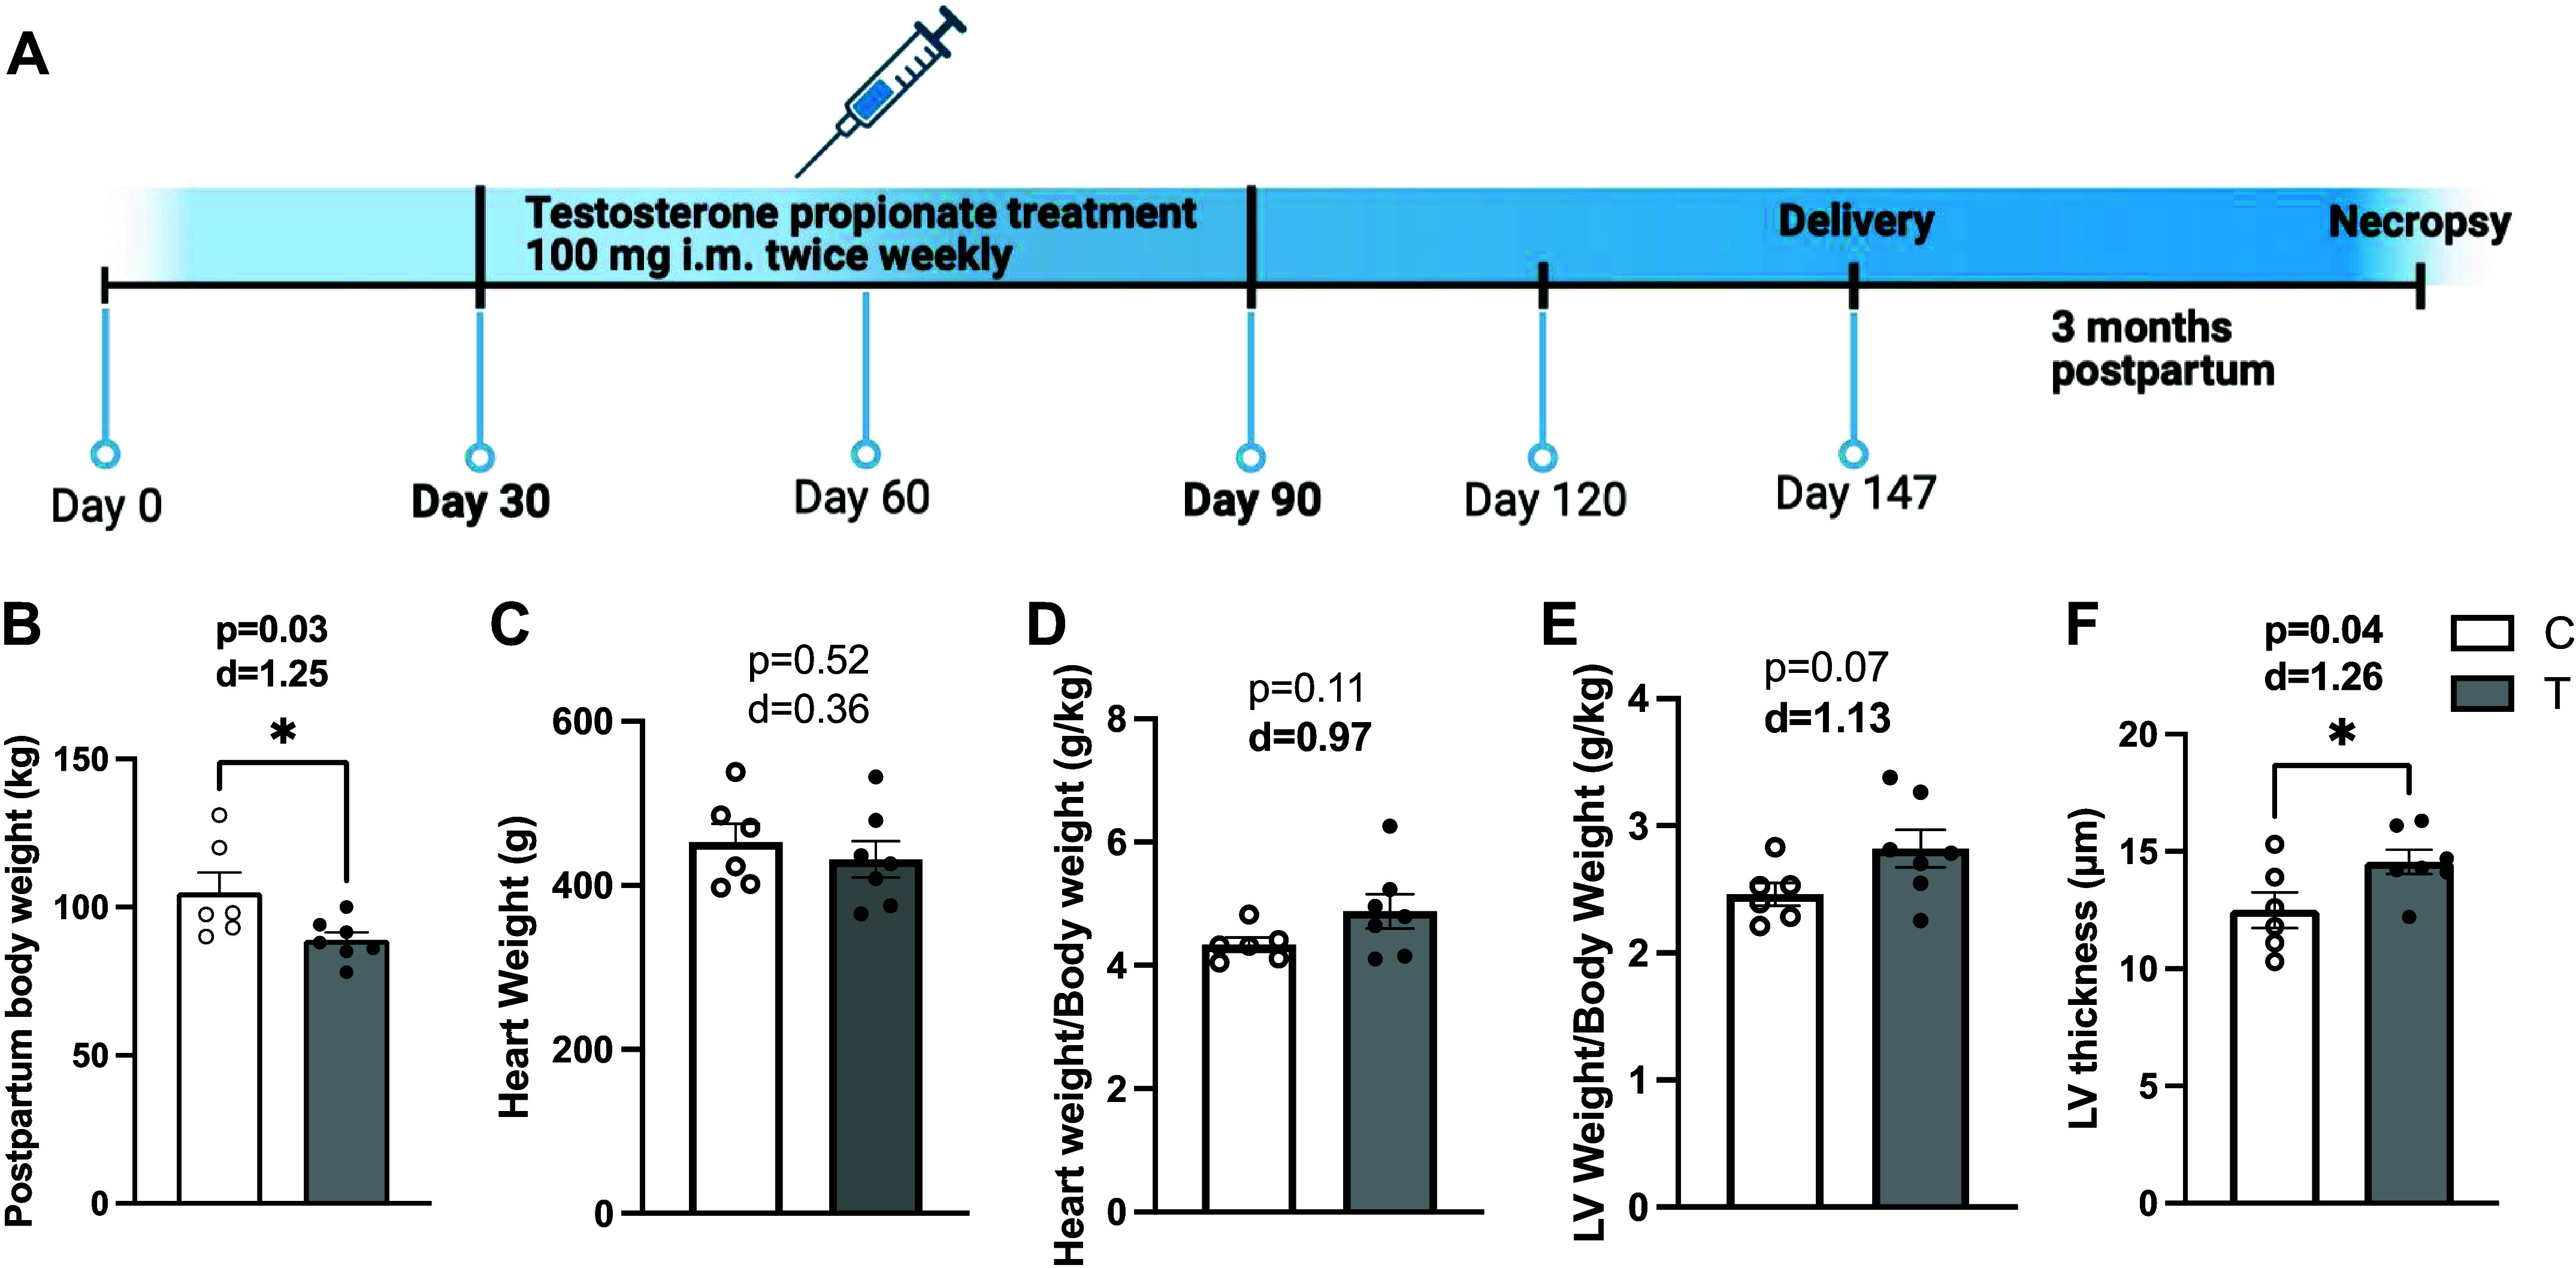
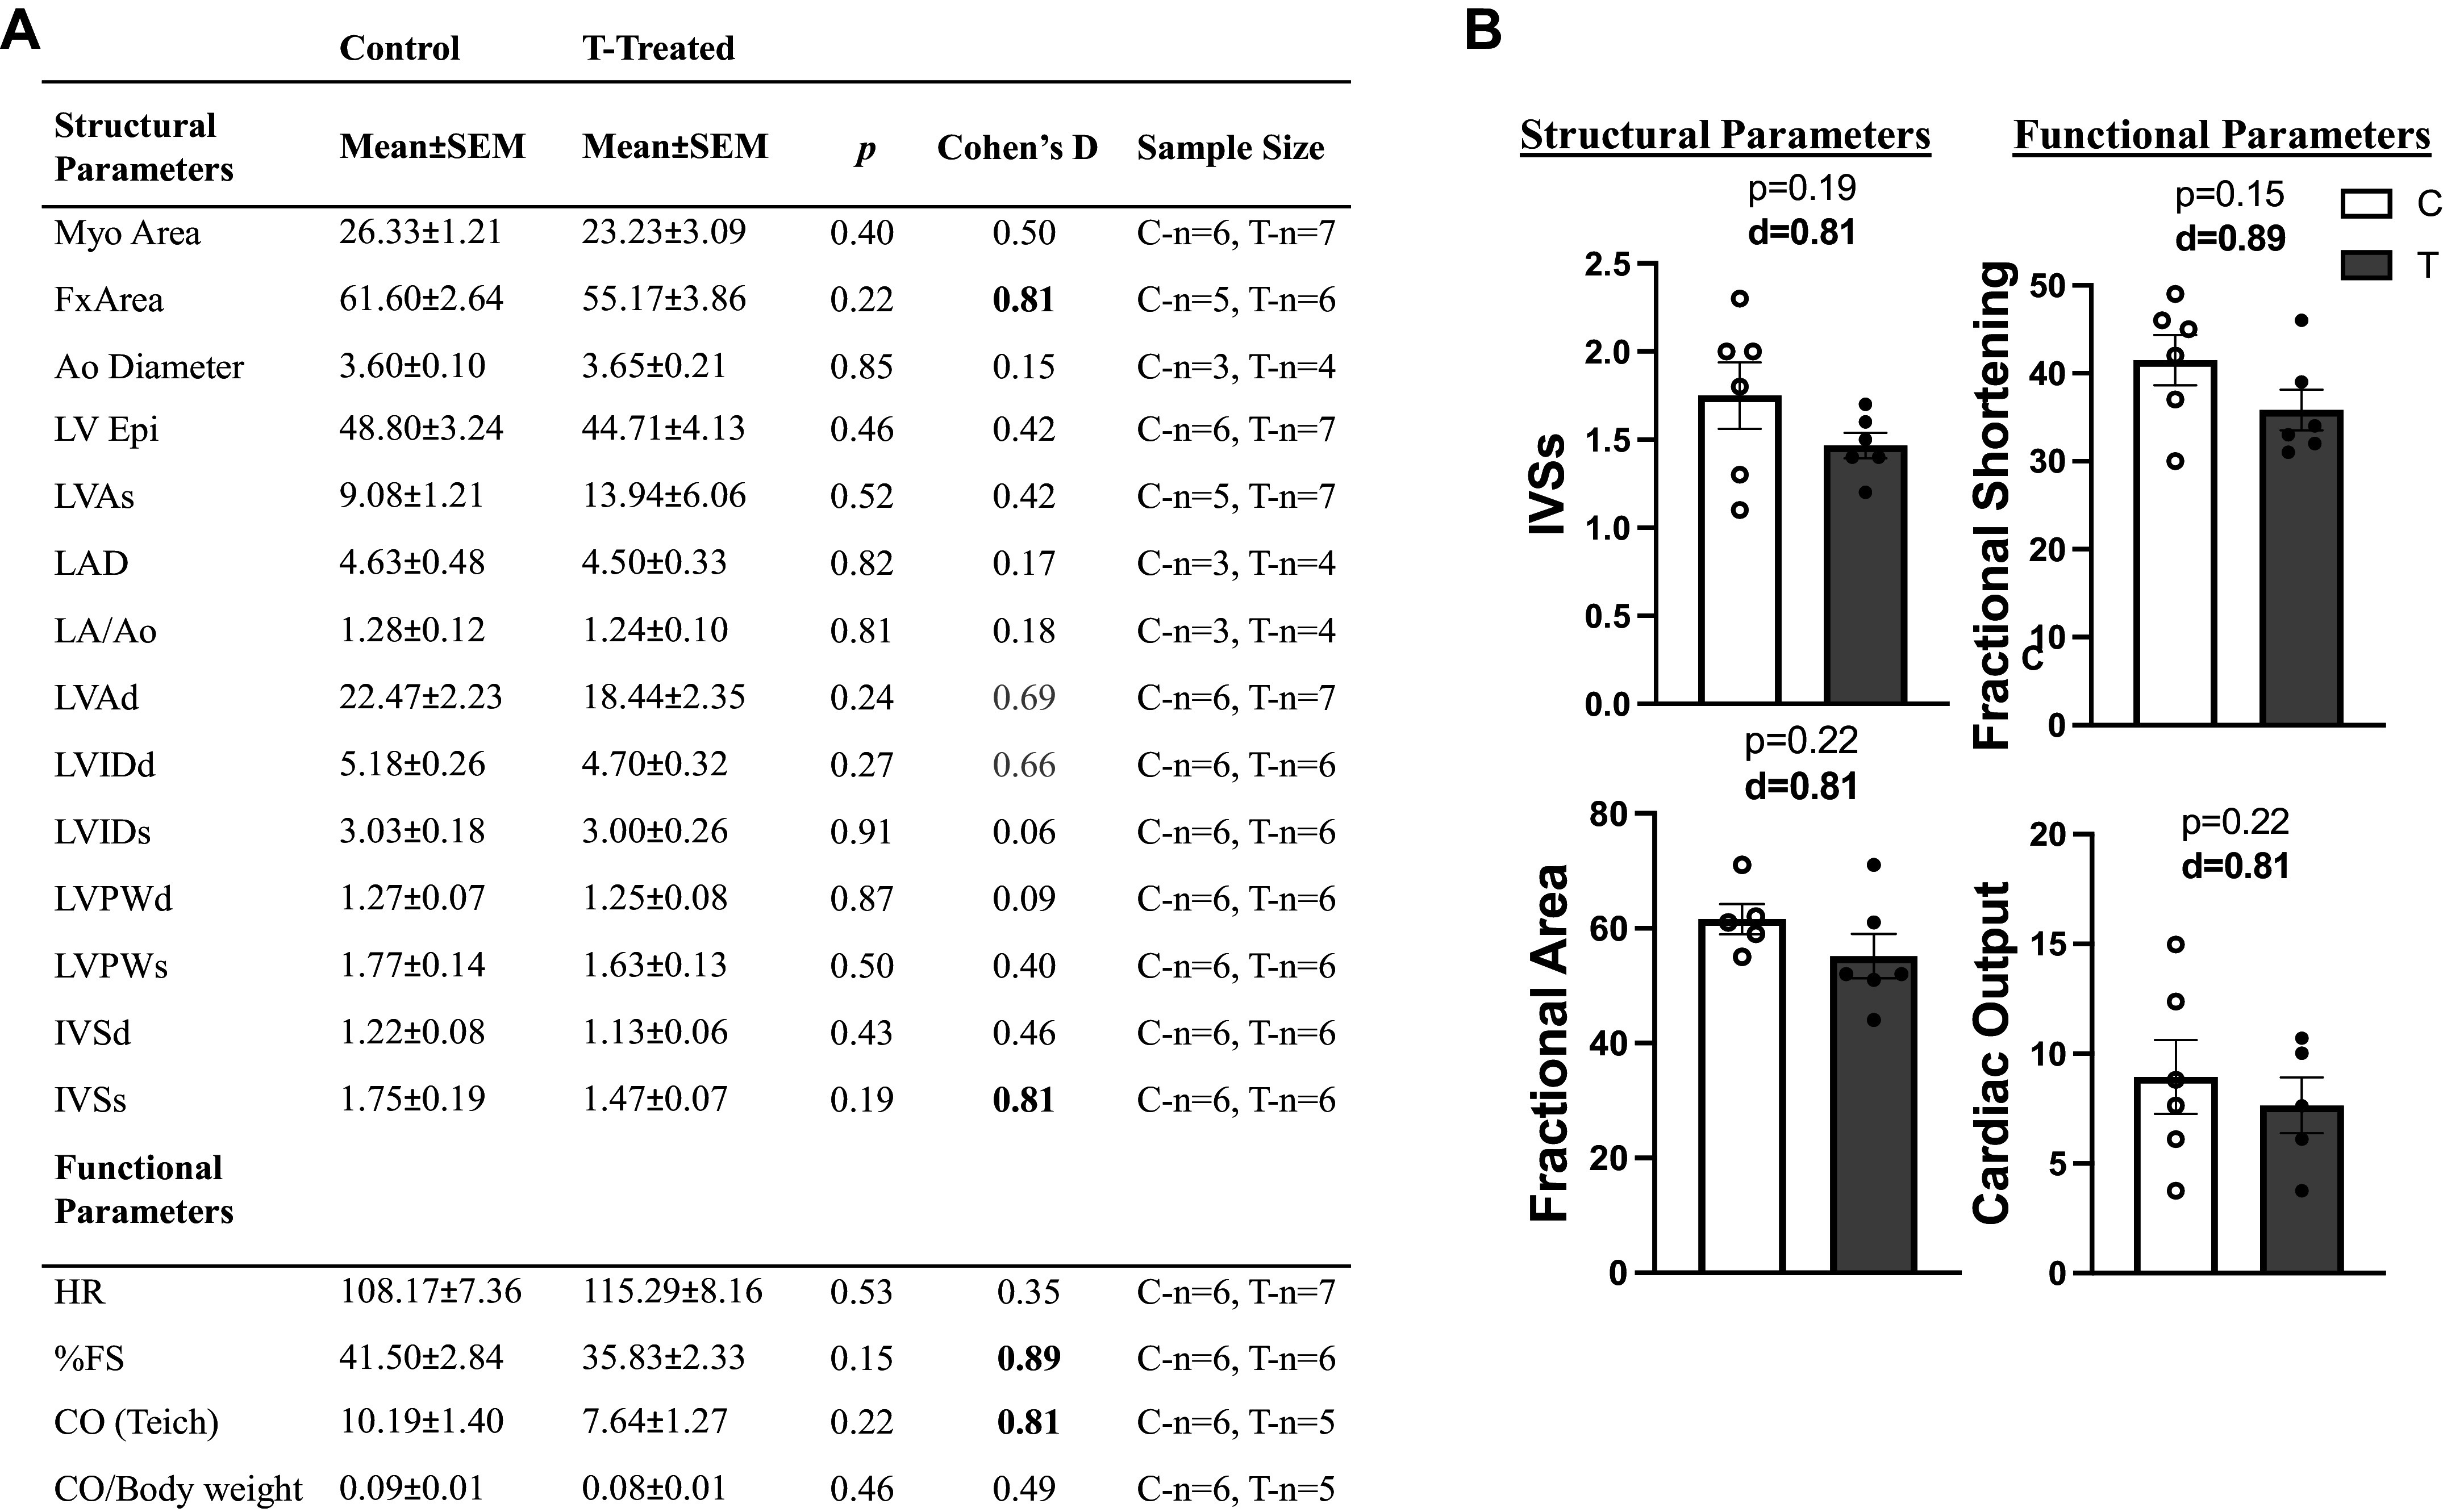
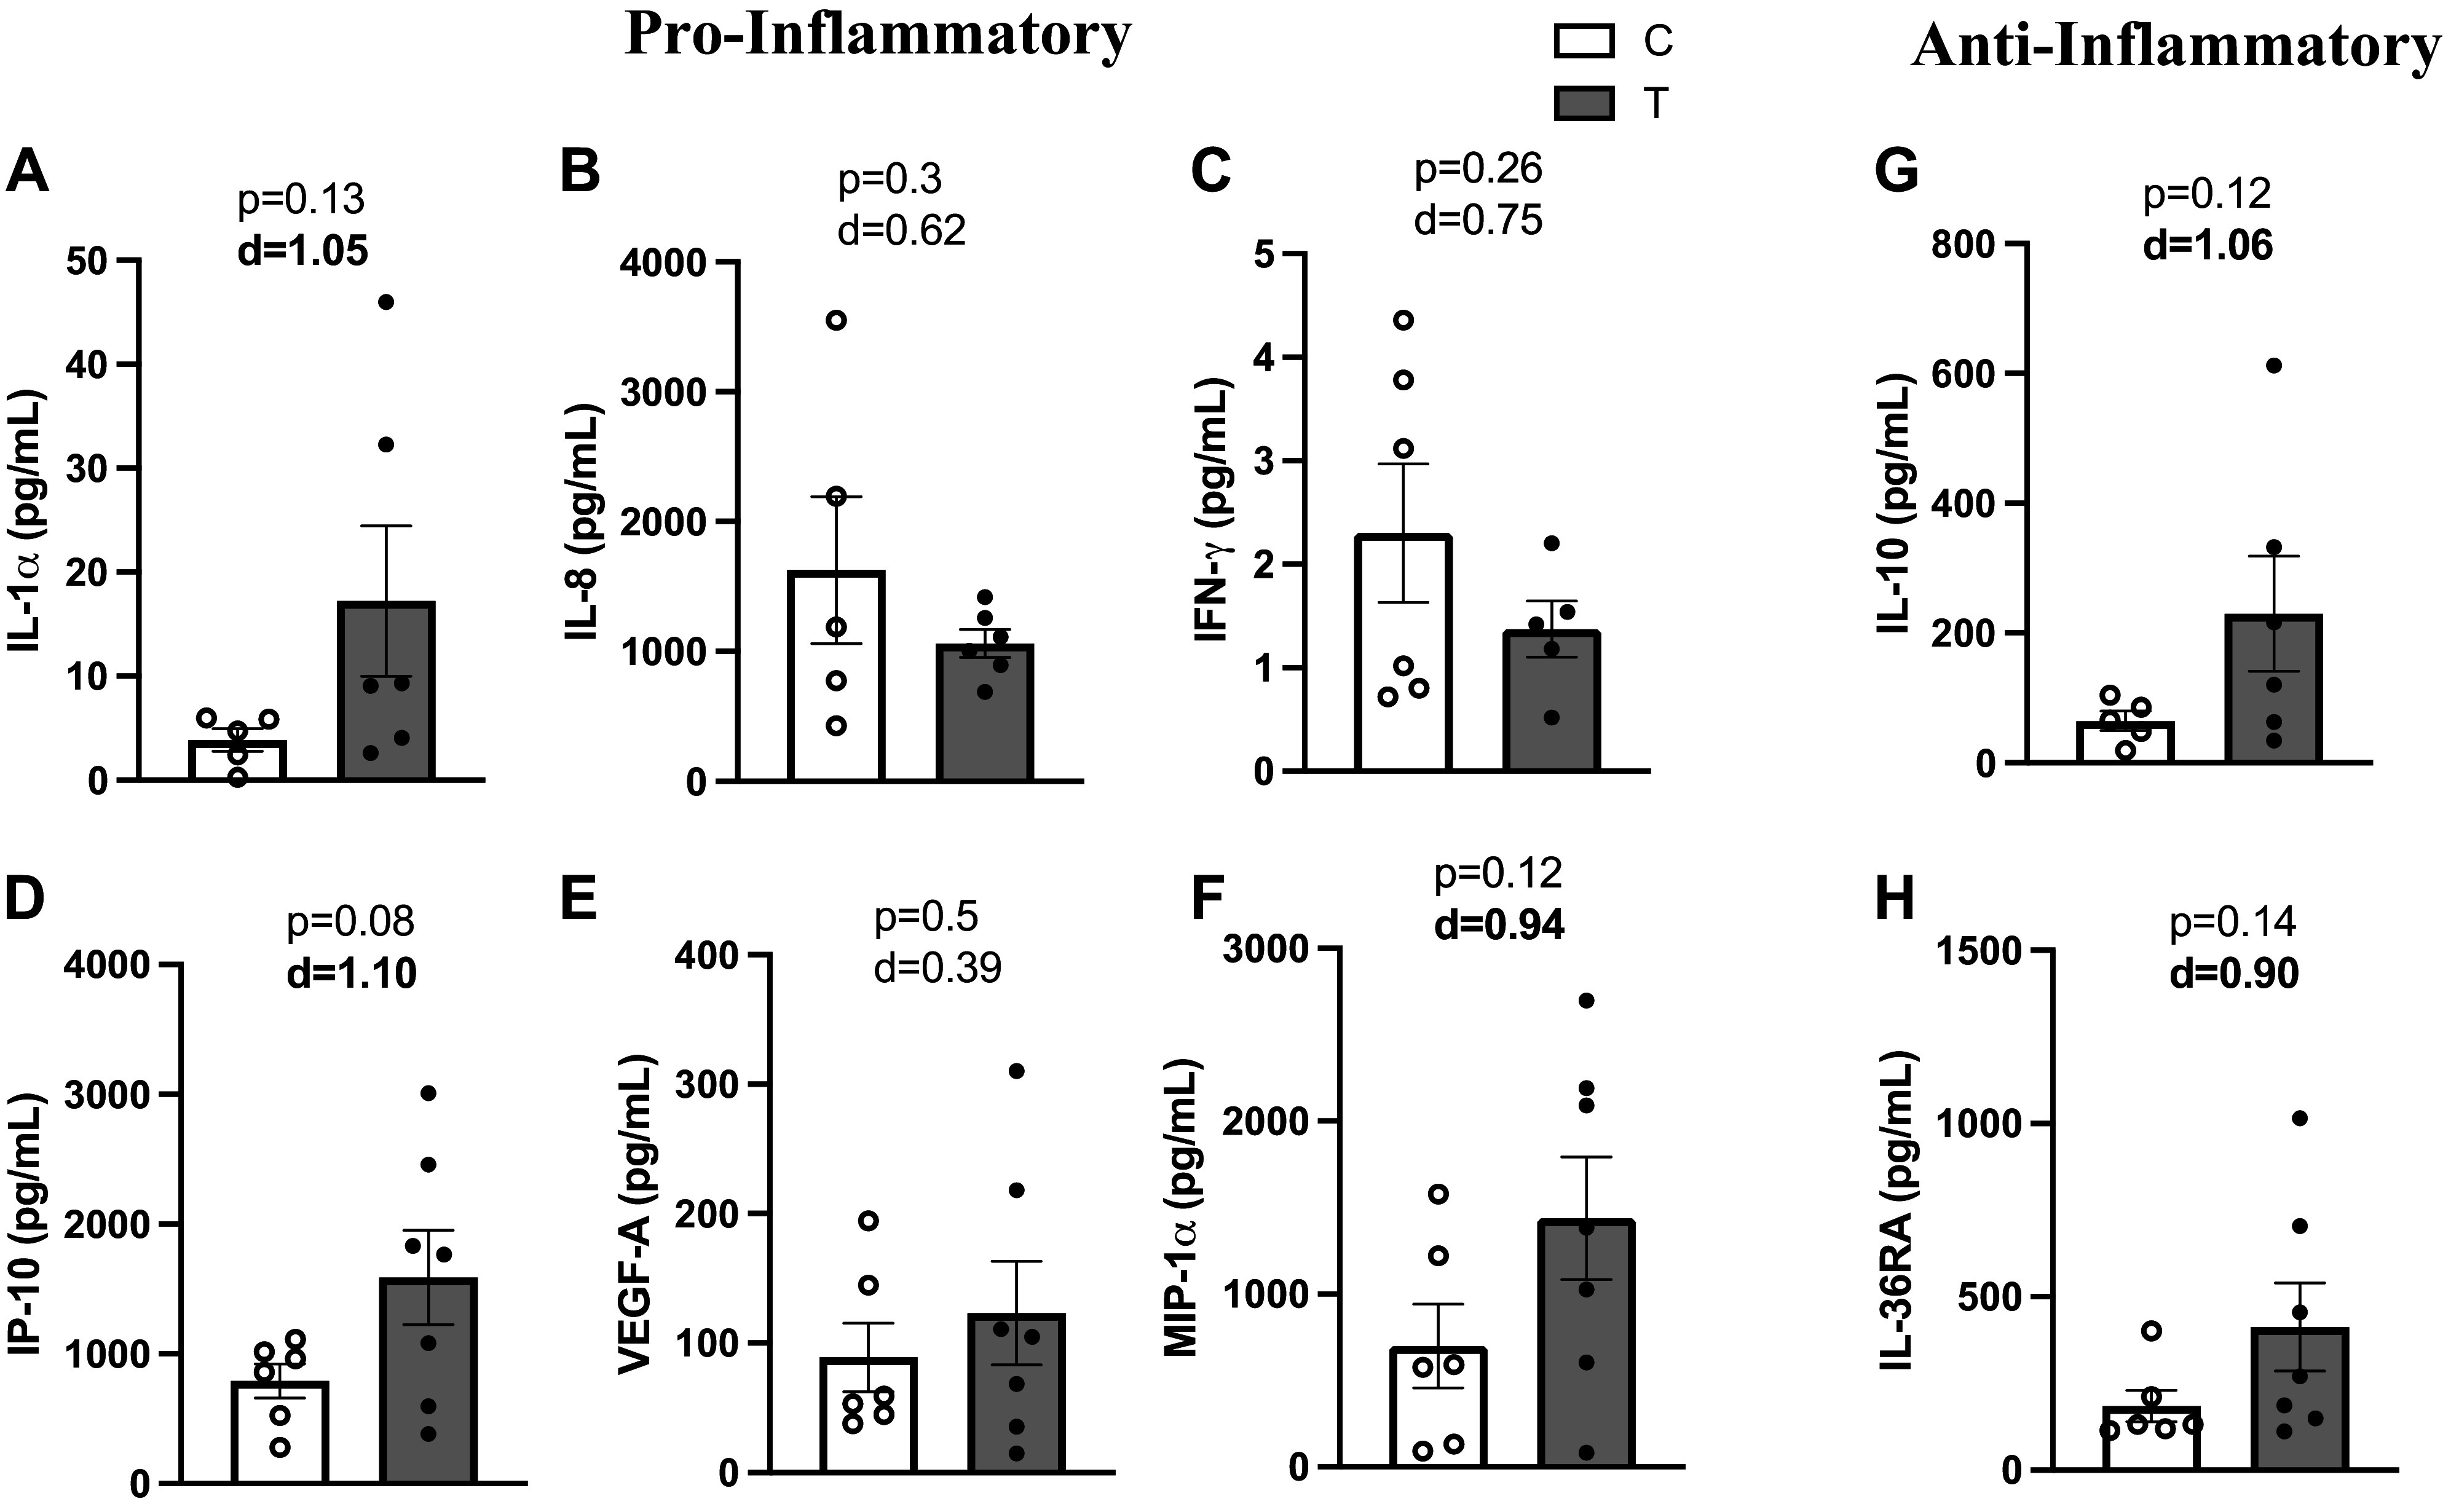
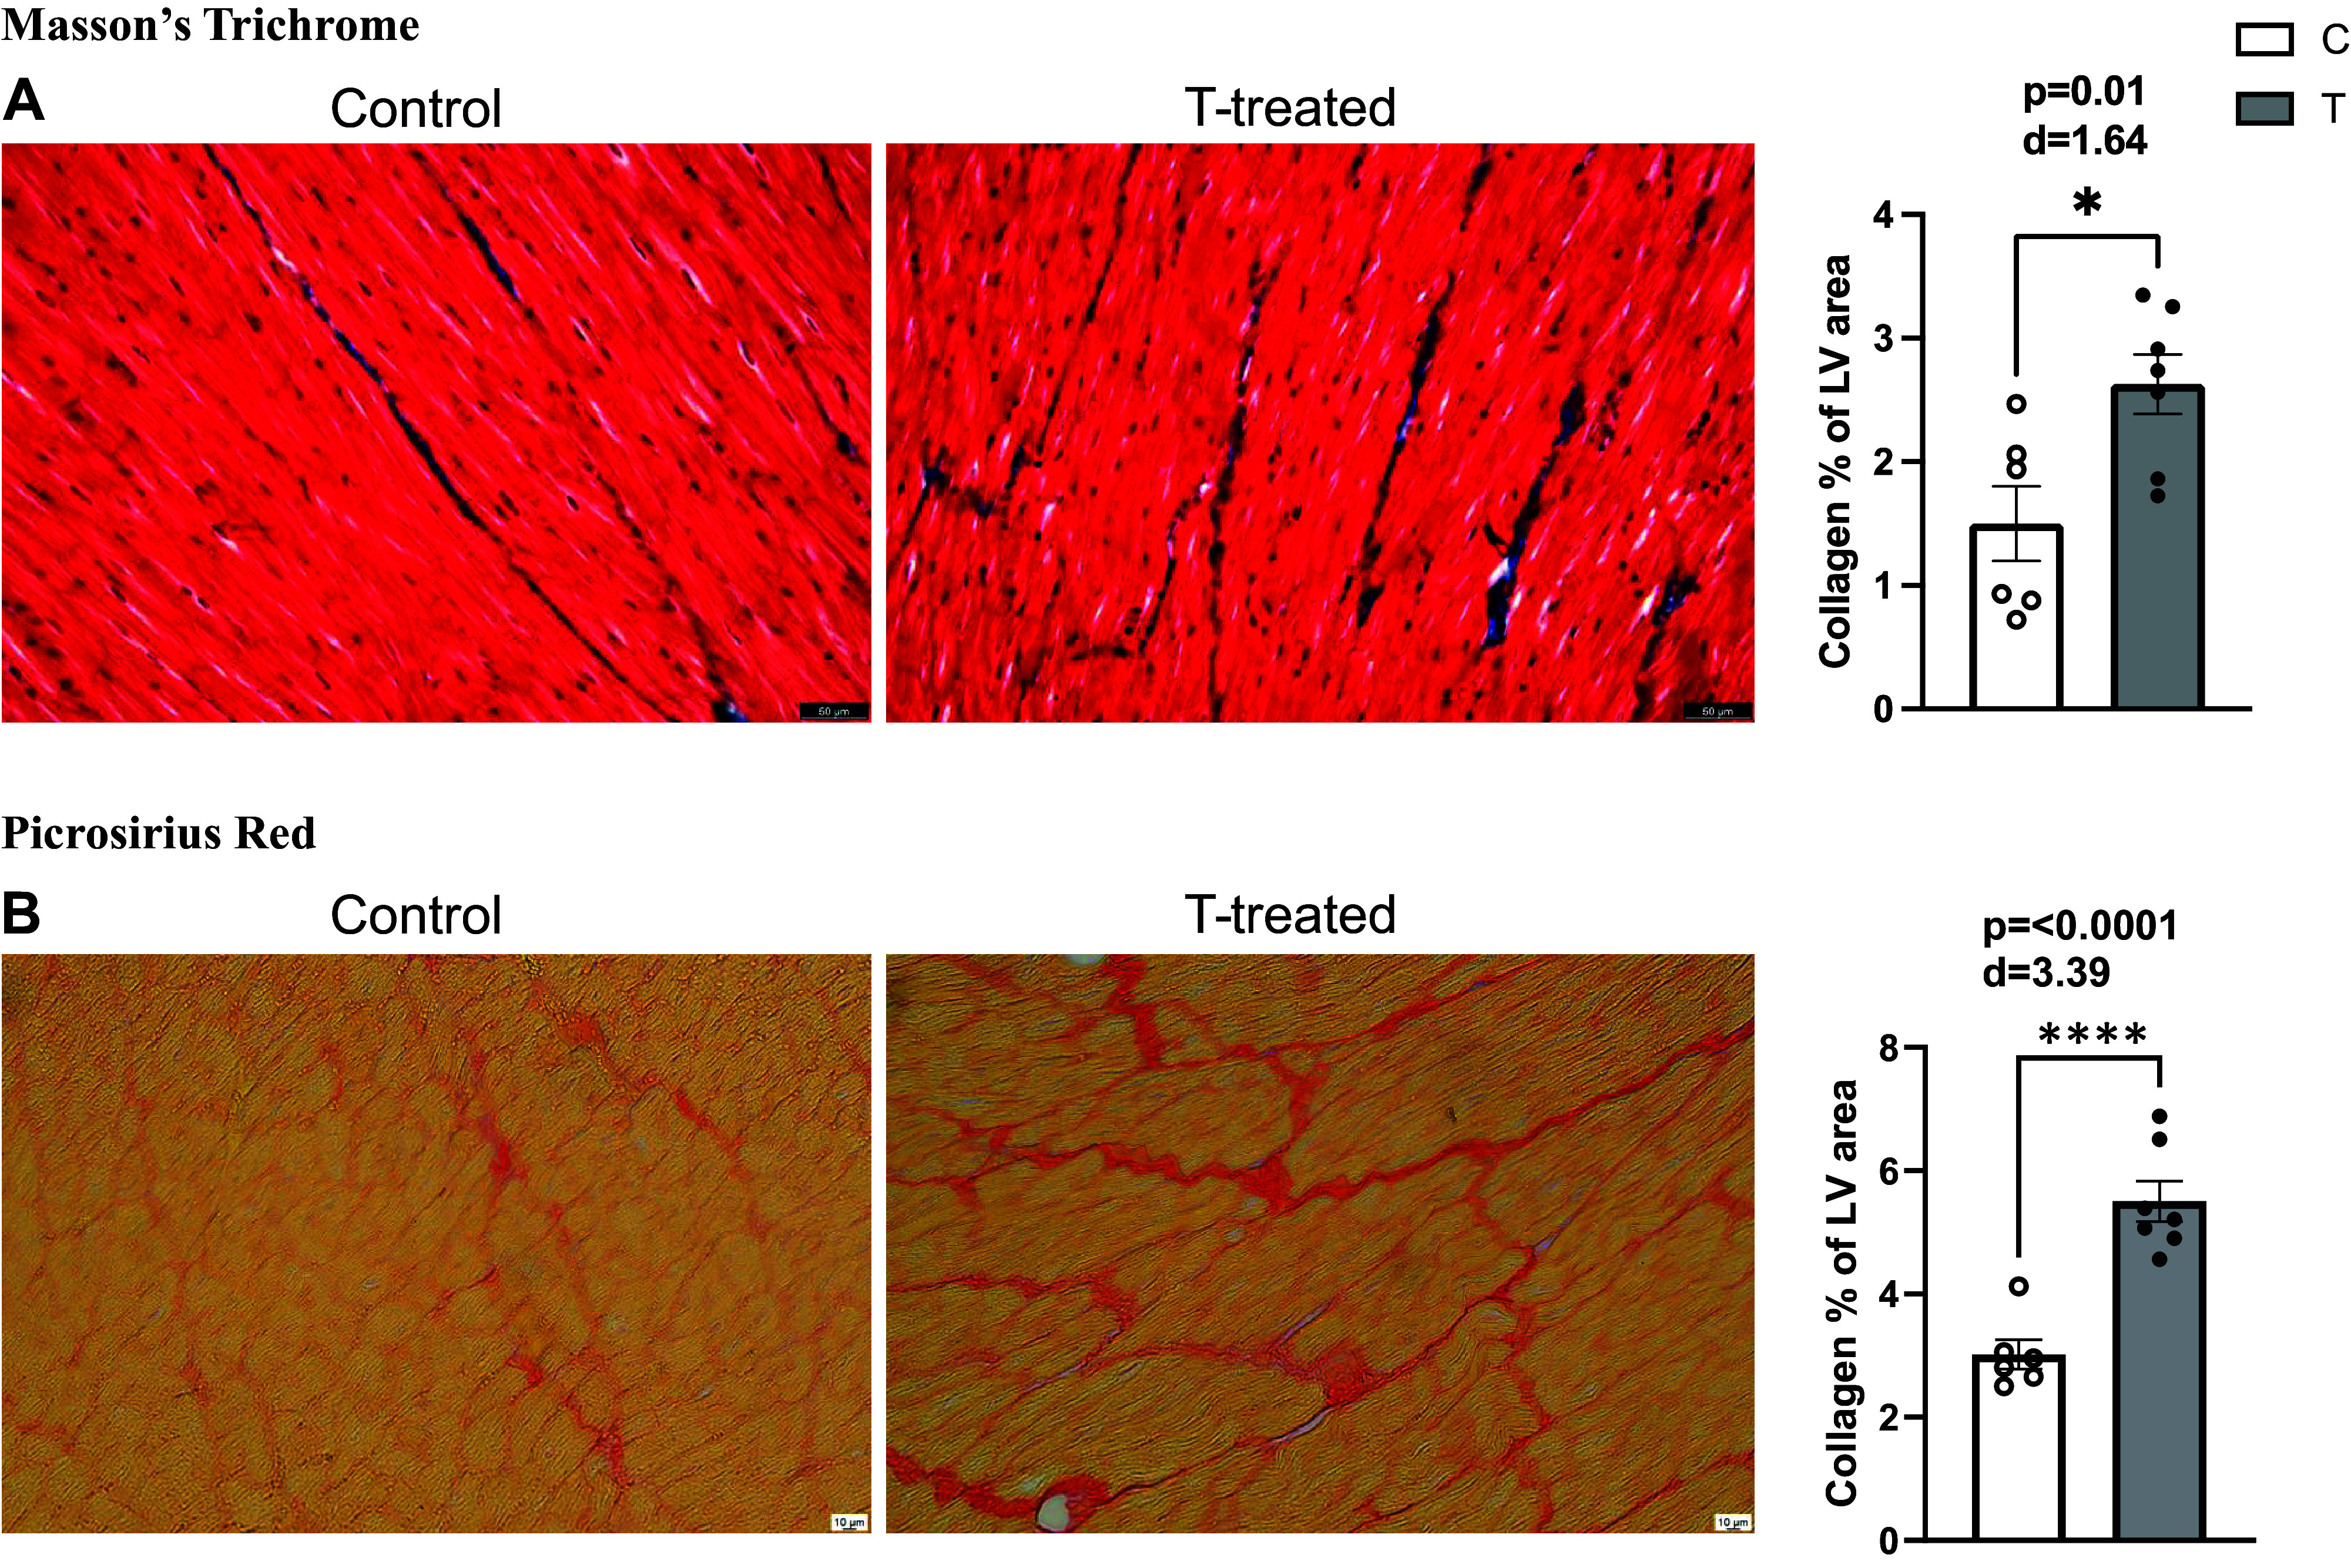
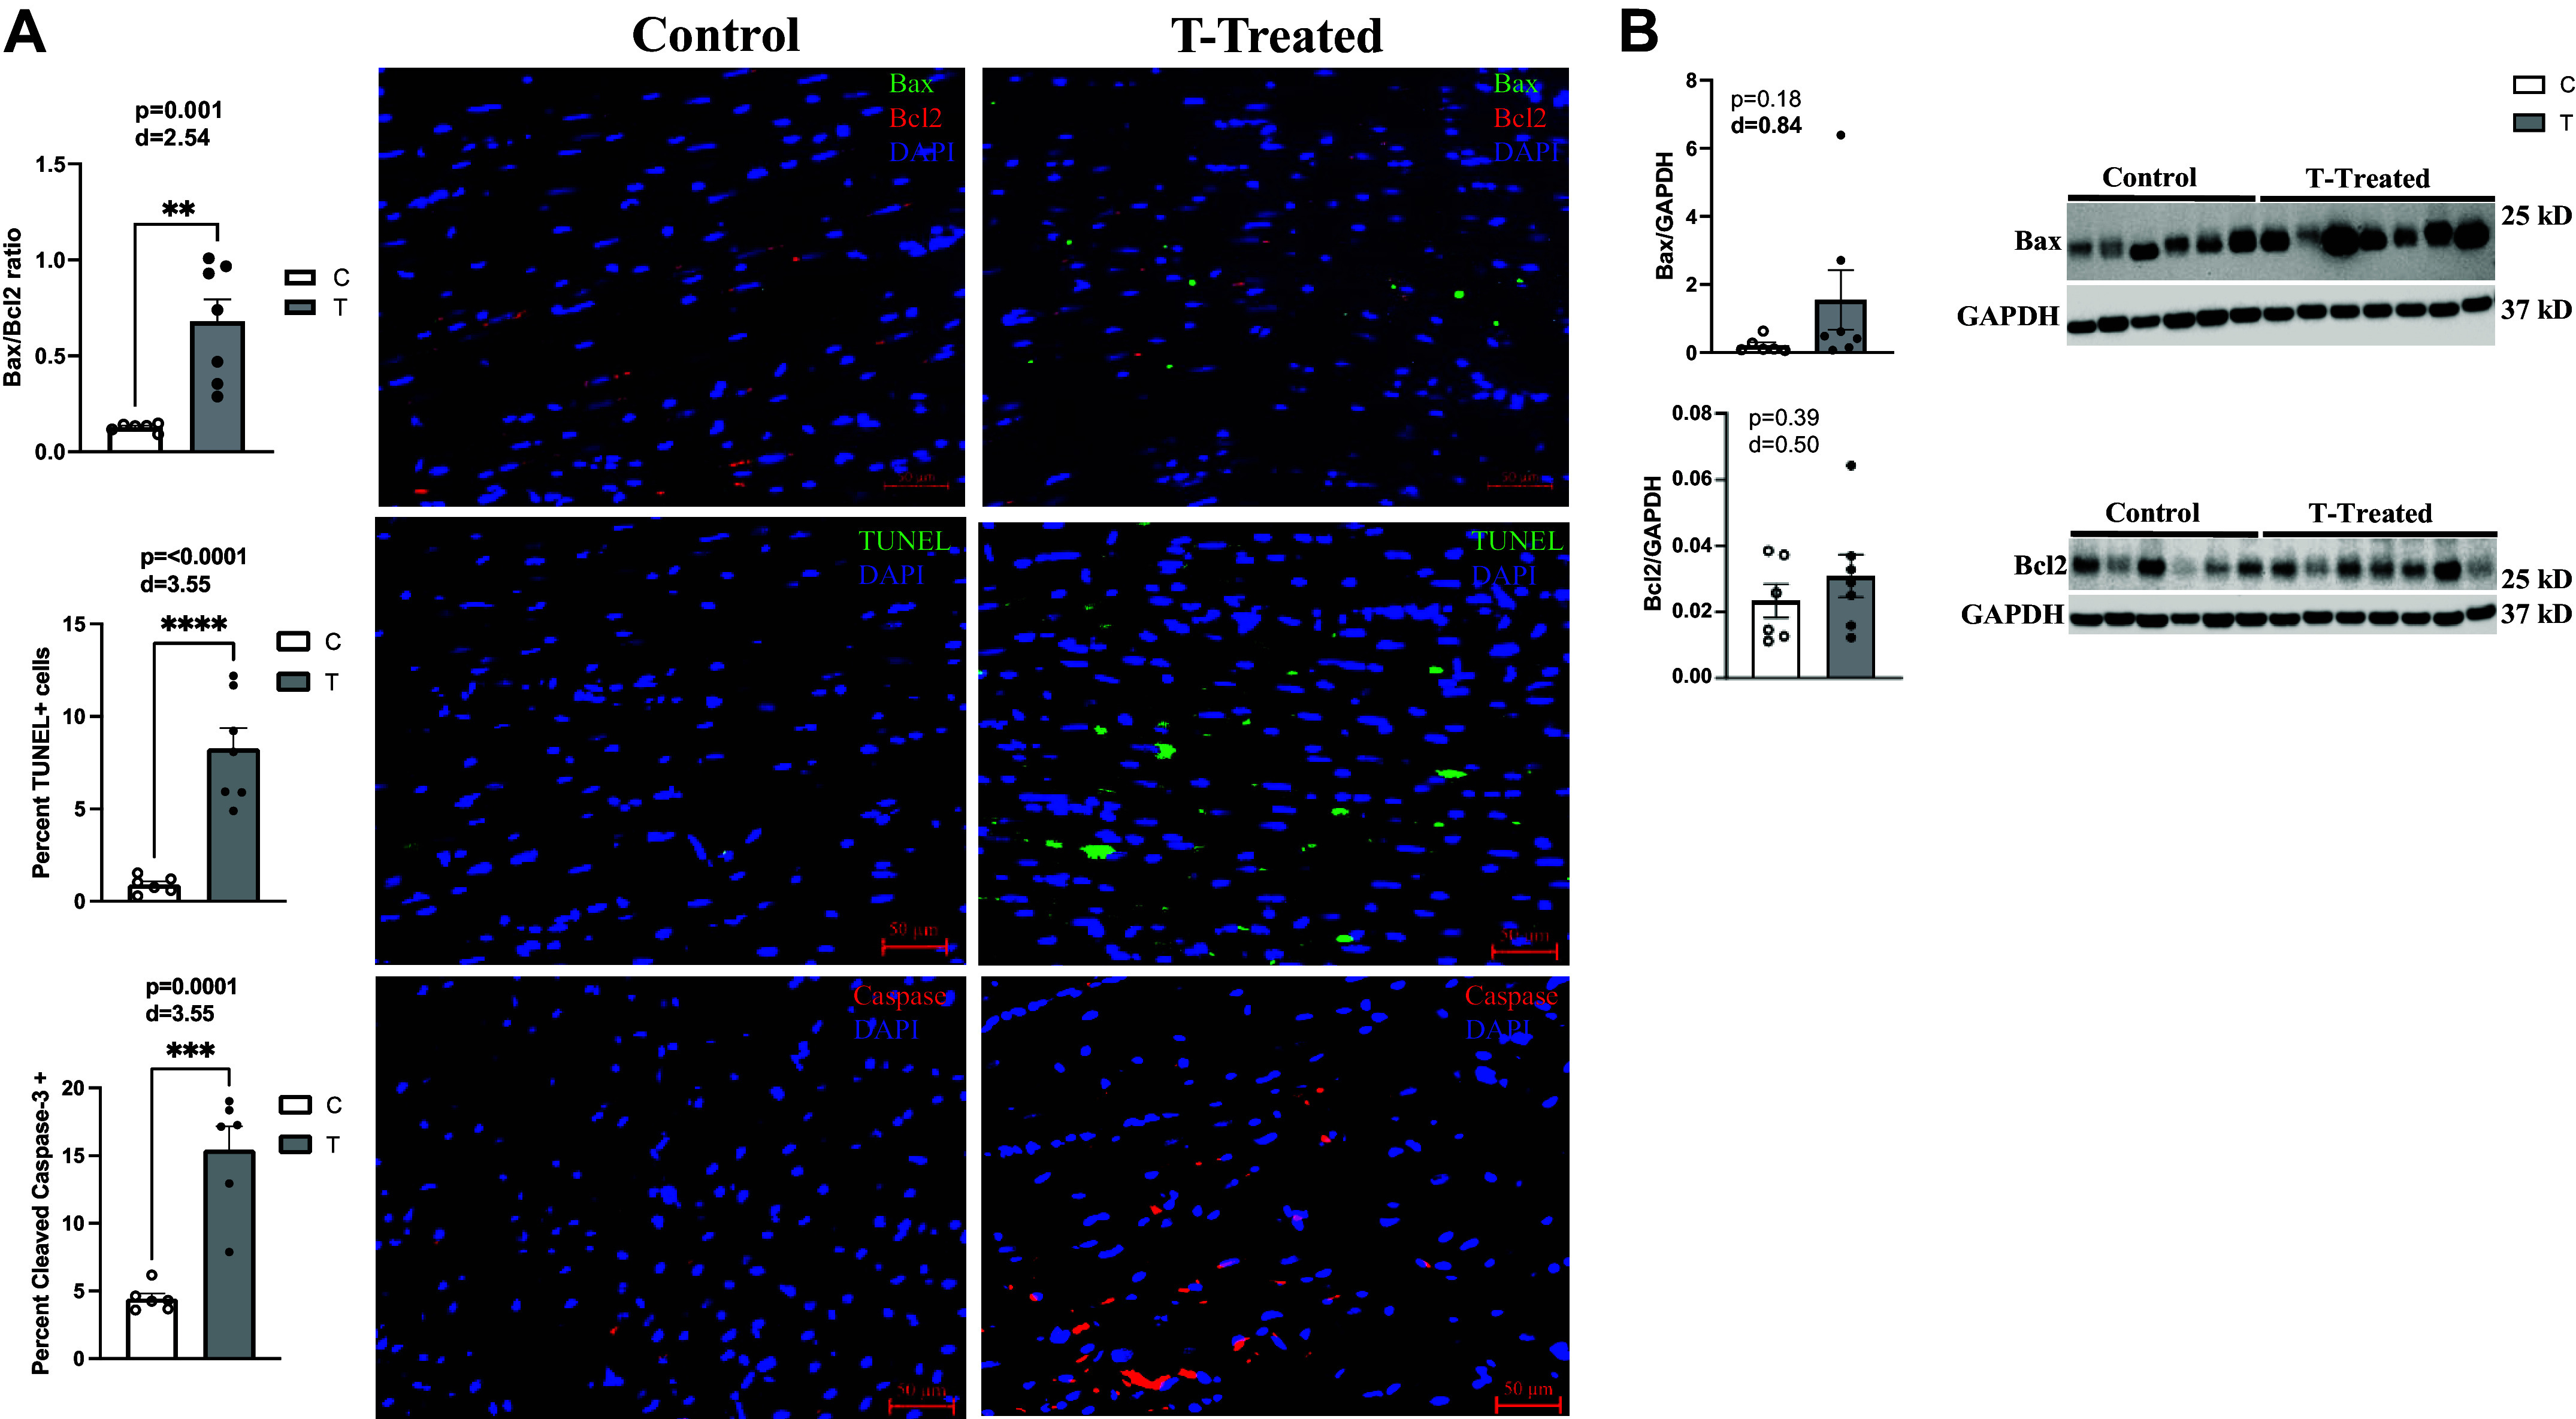
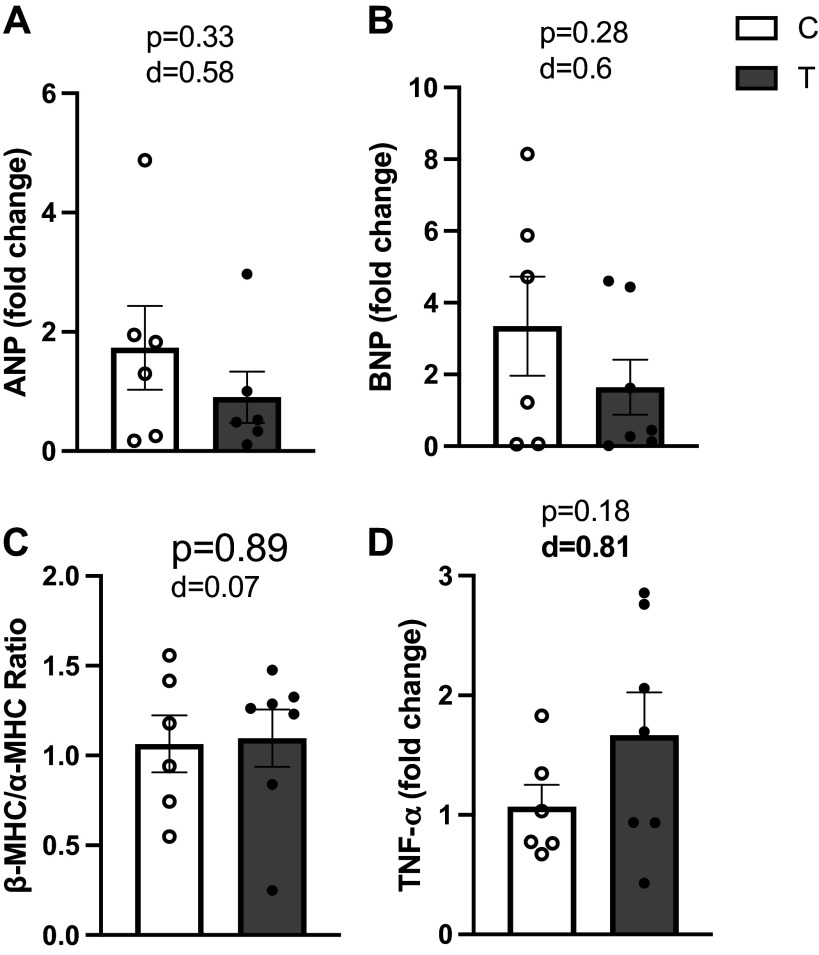
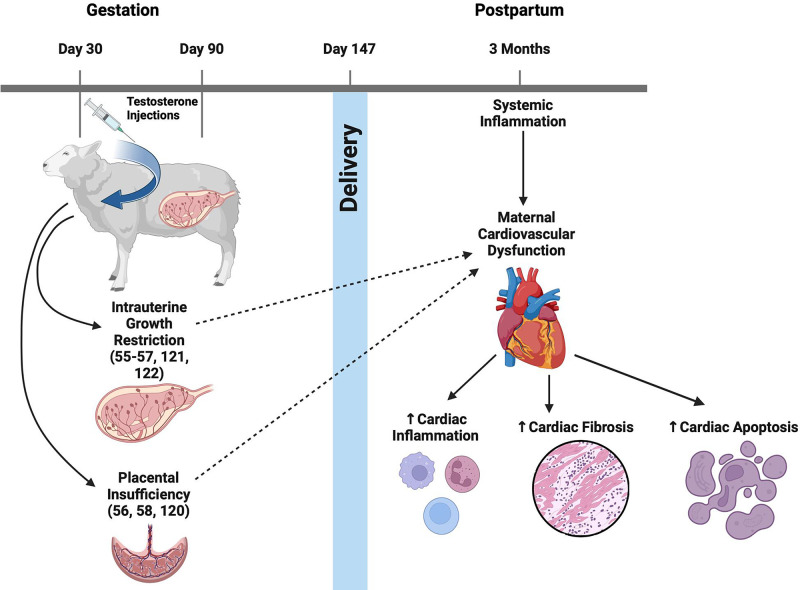
Cardiovascular dysfunctions complicate 10-20% of pregnancies, increasing the risk for postpartum mortality. Various gestational insults, including preeclampsia are reported to be associated with adverse maternal cardiovascular outcomes. One such insult, gestational hyperandrogenism increases the risk for preeclampsia and other gestational morbidities but its impact on postpartum maternal health is not well known. We hypothesize that gestational hyperandrogenism such as testosterone (T) excess will adversely impact the maternal heart in the postpartum period. Pregnant ewes were injected with T propionate from day 30 to day 90 of gestation (term 147 days). Three months postpartum, echocardiograms, plasma cytokine profiles, cardiac morphometric, and molecular analysis were conducted [control (C) n = 6, T-treated (T) n = 7 number of animals]. Data were analyzed by two-tailed Student's t test and Cohen's effect size (d) analysis. There was a nonsignificant large magnitude decrease in cardiac output (7.64 ± 1.27 L/min vs. 10.19 ± 1.40, P = 0.22, d = 0.81) and fractional shortening in the T ewes compared with C (35.83 ± 2.33% vs. 41.50 ± 2.84, P = 0.15, d = 0.89). T treatment significantly increased 1) left ventricle (LV) weight-to-body weight ratio (2.82 ± 0.14 g/kg vs. 2.46 ± 0.08) and LV thickness (14.56 ± 0.52 mm vs. 12.50 ± 0.75), 2) proinflammatory marker [tumor necrosis factor-alpha (TNF-α)] in LV (1.66 ± 0.35 vs. 1.06 ± 0.18), 3) LV collagen (Masson's Trichrome stain: 3.38 ± 0.35 vs. 1.49 ± 0.15 and Picrosirius red stain: 5.50 ± 0.32 vs. 3.01 ± 0.23), 4) markers of LV apoptosis, including TUNEL (8.3 ± 1.1 vs. 0.9 ± 0.18), bcl-2-associated X protein (Bax)+-to-b-cell lymphoma 2 (Bcl2)+ ratio (0.68 ± 0.30 vs. 0.13 ± 0.02), and cleaved caspase 3 (15.4 ± 1.7 vs. 4.4 ± 0.38). These findings suggest that gestational testosterone excess adversely programs the maternal LV, leading to adverse structural and functional consequences in the postpartum period.NEW & NOTEWORTHY Using a sheep model of human translational relevance, this study provides evidence that excess gestational testosterone exposure such as that seen in hyperandrogenic disorders adversely impacts postpartum maternal hearts.

Keywords: cardiovascular; hyperandrogenism; maternal; ovine; postpartum.


Conflict of interest statement

No conflicts of interest, financial or otherwise, are declared by the authors.

Figures

Figure 1.
Figure 1.
Experimental design and morphological analysis at 3 mo postpartum. A: schematic representation of experimental design. Ewes were treated with testosterone propionate from day 30 of gestation to day 90 and then euthanized 3 mo postpartum. Left ventricle (LV) tissues were harvested and either flash frozen or formalin fixed for analysis [control n = 6, testosterone (T)-treated n = 7 number of animals]. B: postpartum body weight measurements (kg). C: postpartum heart weight (g). D: heart weight-to-body weight ratios (g/kg). LV weight to body weight (g/kg) (E), and LV thickness measurements (mm) (F). Values are presented as means ± SE. Unpaired two-tailed Student’s t test was used to test difference between T-treated and control and *P < 0.05. Cohen’s D effect sizes (d = 0.5–0.8, medium) and (d ≥ 0.8, large). C, control.
Figure 2.
Figure 2.
Echocardiogram measures at 3 mo postpartum. A: quantification and statistical analysis of echocardiography structural and functional parameters. B: graphical representation of Cohen’s D large magnitude structural and functional alterations in testosterone (T)-treated animals vs. controls. Control n = 3–6, T-treated n = 4–7 number of animals. Values are presented as means ± SE. Unpaired two-tailed Student’s t test was used to test difference between T-treated and control. Cohen’s D effect sizes (d = 0.5–0.8, medium), and (d ≥ 0.8, large). Ao Diameter, aortic diameter; CO (Teich), cardiac output using Teich method; %FS, percent fractional shortening; FxArea, fractional area; HR, heart rate; IVSd, interventricular septal end diastole; IVSs, interventricular septal end systole; LA/Ao, left atrial aortic root ratio; LAD, left atrial diameter; LVAd, left ventricular area end diastole; LVAs, left ventricular area end systole; LV epi, left ventricular E-Wave Propagation Index; LVIDd, left ventricular internal diameter end diastole; LVIDs, left ventricular internal diameter end systole; LVPWd, left ventricular posterior wall end diastole; LVPWs, left ventricular posterior wall end systole; Myo area, myocardial area.
Figure 3.
Figure 3.
Systemic cytokine measures (pg/mL) at 3 mo postpartum. Proinflammatory: interleukin (IL)-1α [control n = 5, testosterone (T)-treated n = 6] (A); IL-8 (control n = 5, T-treated n = 6) (B); interferon (IFN)-γ (control n = 6, T-treated n = 5) (C); interferon-inducible protein 10 (IP-10, control n = 6, T-treated n = 7) (D); vascular endothelial growth factor A (VEGF-A, control n = 6, T-treated n = 7) (E); macrophage inflammatory protein 1 alpha (MIP-1α, control n = 6, T-treated n = 7) (F). Anti-inflammatory: IL-10 (control n = 5, T-treated n = 6) (G); IL-36 receptor antagonist (RA) (control n = 6, T-treated n = 7 number of animals) (H) cytokine levels were measured. Values are presented as means ± SE. Unpaired two-tailed Student’s t test was used to test difference between T-treated and control. Cohen’s D effect sizes (d = 0.5–0.8, medium), and (d ≥ 0.8, large).
Figure 4.
Figure 4.
Analysis of left ventricle (LV) collagen content at 3 mo postpartum. A: representative images of Masson’s trichrome staining of 8 µm control and testosterone (T)-treated paraffin-embedded LV tissue sections. Images were acquired at ×63 magnification. Collagen percent of LV area was quantified in control and T-treated LV tissues (control n = 6, T-treated n = 7). B: representative images of Picrosirius red staining of 5 µm control and T-treated paraffin-embedded LV tissue sections. Images were acquired at ×20 magnification. Collagen percent of LV area was quantified in control and T-treated LV tissues (control n = 6, T-treated n = 7 number of animals). Values are presented as means ± SE. Unpaired two-tailed Student’s t test was used to test difference between T-treated and control and *P < 0.05, ****P ≤ 0.0001. Cohen’s D effect sizes (d = 0.5–0.8, medium), and (d ≥ 0.8, large).
Figure 5.
Figure 5.
Markers of cardiac apoptosis at 3 mo postpartum. A: representative images of bcl-2-associated X protein (Bax, green), b-cell lymphoma 2 (Bcl2, red), and DAPI immunostained (5 µm sections), TUNEL stained (green, 8 µm sections), and cleaved caspase-3 immunostained (red, 8 µm sections) control and testosterone (T)-treated paraffin-embedded left ventricle (LV) tissue sections (control n = 6, T-treated n = 7 number of animals), Blue staining in TUNEL, Bax/Bcl2, and cleaved caspase-3 represents DAPI-stained nuclei. TUNEL+, Cleaved caspase-3+, and ratios of Bax+/Bcl2+cells were quantified and represented as means ± SE. B: Western blot analysis of Bax and Bcl2 protein expression. Control n = 6, T-treated n = 7. Unpaired two-tailed Student’s t test was used to test difference between T-treated and control. **P = 0.001, ***P = 0.0001, ****P < 0.0001. Cohen’s D effect sizes (d = 0.5–0.8, medium), and (d ≥ 0.8, large).
Figure 6.
Figure 6.
Gene expression of markers of cardiac stress at 3 mo postpartum in cardiac left ventricles (LV): atrial natriuretic peptide (ANP, A), brain natriuretic peptide (BNP) gene (B), β-myosin heavy chain (βMHC)-to-α-myosin heavy chain (αMHC) ratio quantification (C), tumor necrosis factor-α (TNF-α, D). Control n = 6, testosterone (T)-treated n = 6–7 number of animals. Gene expression values were all normalized to housekeeping gene GAPDH to calculate fold changes. Values are presented as means ± SE. Unpaired two-tailed Student’s t test was used to test difference between T-treated and control. Cohen’s D effect sizes (d = 0.5–0.8, medium), and (d ≥ 0.8, large).
Figure 7.
Figure 7.
Gene expression of left ventricles (LV) steroid and insulin receptors at 3 mo postpartum. A: estrogen receptor-α (ESR1). B: estrogen receptor-β (ESR2). C: androgen receptor (AR). D: insulin receptor (IR) mRNA expression fold changes. Control n = 6, T-treated n = 7 number of animals. Gene expression values were all normalized to housekeeping gene GAPDH to calculate fold changes. Values are presented as means ± SE. Unpaired two-tailed Student’s t test was used to test difference between testosterone (T)-treated and control. Cohen’s D effect sizes (d = 0.5–0.8, medium), and (d ≥ 0.8, large).
Figure 8.
Figure 8.
Western blot analysis of proteins involved in insulin signaling pathway in left ventricles (LV) at 3 mo postpartum: glucose transporter type 4 (GLUT4, A), phosphorylated protein kinase B (p-AKT) and total AKT protein expression (B), phosphorylated glycogen synthase kinase-3 beta (p-GSK-3β) and total GSK-3β protein expression (C). Control n = 6, testosterone (T)-treated n = 7 number of animals. Values are presented as means ± SE. Unpaired two-tailed Student’s t test was used to test difference between T-treated and control. Cohen’s D effect sizes (d = 0.5–0.8, medium), and (d ≥ 0.8, large).
Figure 9.
Figure 9.
Schematic representation of the proposed mechanism by which gestational testosterone (T) excess adversely programs the postpartum maternal left ventricle. Created with BioRender.com.

Similar articles

References

    1. Alkema L, Chou D, Hogan D, Zhang S, Moller AB, Gemmill A, Fat DM, Boerma T, Temmerman M, Mathers C, Say L; United Nations Maternal Mortality Estimation Inter-Agency Group collaborators and technical advisory group. Global, regional, and national levels and trends in maternal mortality between 1990 and 2015, with scenario-based projections to 2030: a systematic analysis by the UN Maternal Mortality Estimation Inter-Agency Group. Lancet 387: 462–474, 2016. doi: 10.1016/S0140-6736(15)00838-7. - DOI - PMC - PubMed
    1. Creanga AA, Syverson C, Seed K, Callaghan WM. Pregnancy-related mortality in the United States, 2011–2013. Obstet Gynecol 130: 366–373, 2017. doi: 10.1097/AOG.0000000000002114. - DOI - PMC - PubMed
    1. Kotit S, Yacoub M. Cardiovascular adverse events in pregnancy: a global perspective. Glob Cardiol Sci Pract 2021: e202105, 2021. doi: 10.21542/gcsp.2021.5. - DOI - PMC - PubMed
    1. Lameijer H, Schutte JM, Schuitemaker NWE, van Roosmalen JJM, Pieper PG, Dutch MM, Morbidity C; Dutch Maternal Mortality and Morbidity Committee. Maternal mortality due to cardiovascular disease in the Netherlands: a 21-year experience. Neth Heart J 28: 27–36, 2020. doi: 10.1007/s12471-019-01340-w. - DOI - PMC - PubMed
    1. Sanghavi M, Rutherford JD. Cardiovascular physiology of pregnancy. Circulation 130: 1003–1008, 2014. doi: 10.1161/CIRCULATIONAHA.114.009029. - DOI - PubMed

Publication types

LinkOut - more resources