. 2024 Aug 1;84(15):2432-2449.
doi: 10.1158/0008-5472.CAN-23-3007.

Human 3D Ovarian Cancer Models Reveal Malignant Cell-Intrinsic and -Extrinsic Factors That Influence CAR T-cell Activity

Affiliations

Human 3D Ovarian Cancer Models Reveal Malignant Cell-Intrinsic and -Extrinsic Factors That Influence CAR T-cell Activity

Joash D Joy et al. Cancer Res. .

Abstract

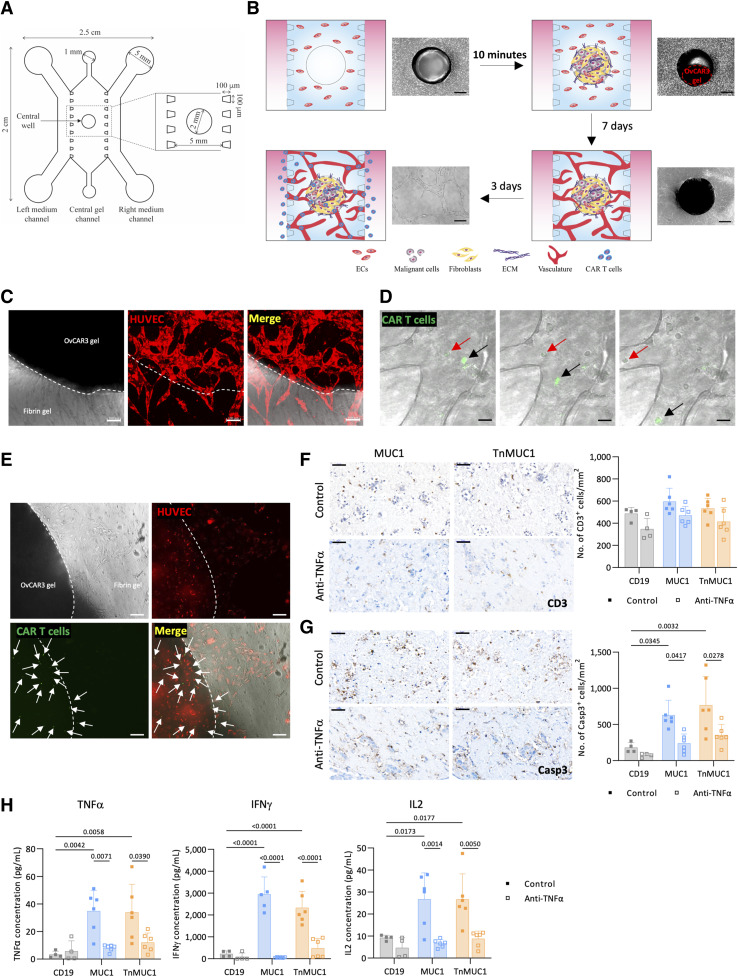
In vitro preclinical testing of chimeric antigen receptor (CAR) T cells is mostly carried out in monolayer cell cultures. However, alternative strategies are needed to take into account the complexity and the effects of the tumor microenvironment. Here, we describe the modulation of CAR T-cell activity by malignant cells and fibroblasts in human three-dimensional (3D) in vitro cell models of increasing complexity. In models combining mucin-1 (MUC1) and TnMUC1 CAR T cells with human high-grade serous ovarian cancer cell spheroids, malignant cell-intrinsic resistance to CAR T-cell killing was due to defective death receptor signaling involving TNFα. Adding primary human fibroblasts to spheroids unexpectedly increased the ability of CAR T cells to kill resistant malignant cells as CCL2 produced by fibroblasts activated CCR2/4+ CAR T cells. However, culturing malignant cells and fibroblasts in collagen gels engendered production of a dense extracellular matrix that impeded CAR T-cell activity in a TGFβ-dependent manner. A vascularized microfluidic device was developed that allowed CAR T cells to flow through the vessels and penetrate the gels in a more physiological way, killing malignant cells in a TNFα-dependent manner. Complex 3D human cell models may provide an efficient way of screening multiple cytotoxic human immune cell constructs while also enabling evaluation of mechanisms of resistance involving cell-cell and cell-matrix interactions, thus accelerating preclinical research on cytotoxic immune cell therapies in solid tumors. Significance: Three-dimensional in vitro models of increasing complexity uncover mechanisms of resistance to CAR T cells in solid tumors, which could help accelerate development of improved CAR T-cell constructs.


Conflict of interest statement

J.D. Joy reports grants from GSK during the conduct of the study. R. Manchanda reports grants from Barts Charity during the conduct of the study; grants from GSK, Yorkshire Cancer Research, Rosetrees Trust, and North East London Cancer Alliance, and other support from AstraZeneca, MSD, and EGL outside the submitted work. F.R. Balkwill reports grants from GSK during the conduct of the study and personal fees from iOmx therapeutics outside the submitted work. No disclosures were reported by the other authors.

Figures

Figure 1.
Figure 1.
OvCAR3 cells were sensitive but G164 cells were resistant to CAR T-cell cytotoxicity in monolayer cultures. A, Flow cytometry analysis of the expression of MUC1 and TnMUC1 on monolayer, spheroid, and collagen gel cultures of OvCAR3 and G164 cells. Data plotted as mean ± SD of three repeats. B, Expression of MUC1 and TnMUC1 on OvCAR3+FB and G164+FB collagen gels. Data plotted as mean ± SD of three gels per three replicates. Different FB donors were used for each replicate. Scale bars, 50 μm. C, Schematic representation of CD19, MUC1, and TnMUC1 directed second generation CARs. D, ELISA data showing IFNγ concentration after coculturing CAR T cells with monolayers of T47D, OvCAR3, and G164 cells for 2 days at 1:1 and 1:5 T:E ratios. E, Representative images (left) and quantification (right) of Incucyte killing assay in which monolayers of T47D, OvCAR3, and G164 cells were treated with CAR T cells from one donor at 1:5 T:E ratio. Images shown are 3 days after treatment. Red, dead cells. Scale bars, 400 μm. F, Flow cytometry analysis of the expression of T-cell activation markers HLA-DR (top) and CD25 (bottom) pre and 2 days post coculture with monolayers of T47D, OvCAR3, and G164 cells. D and F, Data plotted as mean ± SD for three CAR T-cell donors. Statistics performed using two-way (D) and one-way ANOVA (F).
Figure 2.
Figure 2.
Impaired death receptor signaling in malignant cells caused resistance to CAR T-cell cytotoxicity. A, Hierarchical cluster analysis of transcriptomes for OvCAR3 and G164 cells in monolayer and spheroids. B, Heatmap illustrating normalized gene expression of differentially expressed genes relating to death receptor signaling in OvCAR3 and G164 cells (adjusted P value < 0.05). C, cIAP1/2 expression on human HGSOC omental metastasis (n = 16) and adjacent omentum (n = 10). Statistics performed using two-way ANOVA. D and E, Representative images (left) and quantification (right) of Incucyte killing assay in which monolayers of G164 (D) and G33 (E) cells were treated with birinapant and CAR T cells. F, Western blot showing the expression of cIAP2 in OvCAR3 and G164 cells treated with birinapant. Representative images of three repeats. G, ELISA data showing TNFα concentration after coculturing CAR T cells with monolayers of OvCAR3 and G164 cells for 2 days at 1:5 T:E ratios. Data plotted as mean ± SD for three CAR T-cell donors. Statistics performed using two-way ANOVA. H, Representative images (left) and quantification (right) of Incucyte killing assay in which OvCAR3 monolayer was treated with anti-TNFα antibody and CAR T cells. D–F, Data shown for one CAR T-cell donor at 1:5 T:E ratio. Images shown are 3 days after treatment. Red, dead cells. Scale bars, 400 μm.
Figure 3.
Figure 3.
Primary omental fibroblasts induced CAR T-cell cytotoxicity against G164 cells in suspension spheroids. A and B, ELISA data showing IFNγ concentration after coculturing CAR T cells with OvCAR3 (A) and G164 (B) spheroids with and without FBs or FB-M for 2 days at 1:5 T:E ratio. Data plotted as mean ± SD for three CAR T-cell donors. Three different fibroblast donors were used for this experiment. Statistics performed using two-way ANOVA. C and D, Representative images (left) and quantification (right) of Incucyte killing assay in which OvCAR3 (C) and G164 (D) spheroids with and without FB or FB-M were treated with CAR T cells from one donor at 1:5 T:E ratio. Images shown are 3 days after treatment. Red, dead cells. Scale bars, 400 μm.
Figure 4.
Figure 4.
CCL2 produced by fibroblasts activated CCR2/4+ CAR T cells to induce antigen-dependent cytotoxicity. A, Cytokine profile of FB-, G164-, and OvCAR3-conditioned medium using proteome profiler array. FBs from two donors were used for this experiment. Each cytokine is in duplicate. Dots that are not labeled are reference points. B, ELISA showing CCL2 concentrations in monolayers and spheroids of malignant cells with and without FB. Two FB donors were used for this experiment. Data plotted as mean ± SD of two replicates. C and D, IFNγ concentration measured by ELISA (C) and Incucyte CAR T-cell killing assay of G164 spheroids with no treatment (NT) or with recombinant CCL2 (D). E and F, ELISA data showing IFNγ concentration (E) and Incucyte killing assay of G164 spheroids cultured in FB-M with anti-CCL2 (aCCL2) antibody (F). G, Fold change analysis of the expression of T-cell activation markers HLA-DR and CD69 on CCR2+ (top) and CCR4+ (bottom) CAR T cells after CCL2, FB-M, or FB-M with aCCL2 treatments. C, E, and G, Data plotted as mean ± SD for three CAR T-cell donors. Statistics performed using two-way (C and E) and one-way ANOVA (G). D and F, Data shown for one CAR T-cell donor. Representative images at day 3 (left) and quantification (right). Red, dead cells. Scale bar, 400 μm.
Figure 5.
Figure 5.
Dense ECM prevented CAR T-cell migration and cytotoxicity in G164/FB collagen gels. A, CD3+ CAR T cells at the peripheral and core regions of OvCAR3/FB and G164/FB collagen gels. Two different CAR T-cell and FB donors were used in this experiment. B, IHC staining and quantification for caspase-3 (Casp3) on OvCAR3/FB and G164/FB collagen gels. C, Behavior of CAR T cells in OvCAR3/FB and G164/FB collagen gels. Representative images from three repeats. Blue, fibronectin; green, CAR T cells; red, EpCAM. Scale bar, 50 μm. Proportion of static (st), wobbling (wob), migrating (mig), and long migrating (Lmig) CAR T cells. Speed and length of movement of wobbling (OvCAR3: 172, G164: 112) and migrating (OvCAR3, 145; G164, 83) CAR T cells. D, Masson’s trichrome (M3C), COL1A1, and fibronectin (FN1) staining and quantification of OvCAR3/FB and G164/FB collagen gels. E, TWOMBLI analysis showing the heatmaps and percentage of HDM for M3C, COL1A1, and FN1 in OvCAR3/FB and G164/FB collagen gels. Scale bar, 100 μm. F, Expression of FAP and αSMA on OvCAR3/FB and G164/FB collagen gels. G, Barplot illustrating significantly enriched canonical pathways (FDR < 0.05) in G164 vs. OvCAR3 cells in monolayer. A, B, D, and F, Data plotted as mean ± SD of three gels per two replicates. Scale bar, 50 μm. Statistics performed using two-way ANOVA (A and B) and unpaired t test (C–F).
Figure 6.
Figure 6.
Inhibition of TGFβ signaling reduced ECM density and stimulated CAR T-cell activity in G164/FB gels. A, M3C, COL1A1, and FN1 staining and quantification of G164/FB gels treated with TGFβR inhibitor (TGFβR inhi). Scale bar, 50 μm. B, TWOMBLI analysis showing the heatmaps and %HDM for M3C, COL1A1, and fibronectin (FN1) in G164/FB gels treated with TGFβR inhibitor. Scale bar, 100 μm. C, Number of CD3+ CAR T cells at the peripheral and core regions of G164/FB collagen gels treated with TGFβR inhibitor. Two different CAR T-cell and FB donors were used for this experiment. D, Heatmaps generated using Definiens Tissue Studio showing the distribution of CAR T cells in G164/FB collagen gels treated with TGFβR inhibitor. Representative images from two/three gels per two replicates. Scale bar, 500 μm. E, IHC staining and quantification for caspase-3 (Casp3) on G164/FB gels treated with TGFβR inhibitor. Scale bar, 50 μm. F, Expression of FAP on G164/FB gels treated with TGFβR inhibitor. Scale bar, 50 μm. G, Behavior of CAR T cells in G164/FB gels treated with TGFβR inhibitor. Representative images from three repeats. Blue, FN1; green, CAR T cells; red, EpCAM. Scale bar, 50 μm. Speed and length of movement of migrating (vehicle, 83; TGFβR inhibitor, 62) CAR T cells. H, Number of CD3+ (left) and Casp3+ (right) on G164/FB gels treated with TGFβR inhibitor and aCCL2. A–C, E, F, and H, Data plotted as mean ± SD of two/three gels per two replicates. Statistics performed using unpaired t test (A, B, and F) and two-way ANOVA (C, E, and H).
Figure 7.
Figure 7.
Vascularized microfluidic chip to investigate CAR T-cell migration and cytotoxicity. A, Design of the tri-channel microfluidic device with a 2 mm well in the central channel. B, Schematic diagram showing the development of ovarian cancer-on-a-chip model. Scale bar, 600 μm. C, Immunofluorescence image showing microvasculature in fibrin and OvCAR3 collagen gels (n = 3). Red, HUVEC. Scale bar, 100 μm. D, Real-time images showing the luminal flow of CAR T cells (arrows) through the vasculature formed within the microfluidic device (n = 2). Green, CAR T cells. Scale bar, 20 μm. E, Immunofluorescence image showing an ovarian cancer-on-a-chip 3 days after CAR T-cell treatment. CAR T cells (arrows) migrated into the OvCAR3 gel in the middle of the device. Dotted line marks the edge of the central well. Green, CAR T cells; red, HUVEC. Scale bar, 100 μm. F and G, CD3 (F) and caspase‐3 (Casp3; G) staining and quantification of OvCAR3 gels isolated from microfluidic device after CAR T-cell and anti-TNFα treatment. H, MSD data showing TNFα, IFNγ, and IL2 concentrations on media from microfluidic devices after CAR T-cell and anti-TNFα treatment. F–H, Data plotted as mean ± SD of two/three gels per two replicates. Two different CAR T-cell donors were used in this experiment. Scale bar, 50 μm. Statistics performed using two-way ANOVA.

References

    1. Pujade-Lauraine E, Fujiwara K, Ledermann JA, Oza AM, Kristeleit R, Ray-Coquard I-L, et al. . Avelumab alone or in combination with chemotherapy versus chemotherapy alone in platinum-resistant or platinum-refractory ovarian cancer (JAVELIN Ovarian 200): an open-label, three-arm, randomised, phase 3 study. Obstet Gynecol Surv 2021;76:673–75. - PubMed
    1. Drew Y, Penson RT, O’Malley DM, Kim J-W, Zimmermann S, Roxburgh P, et al. . 814MO Phase II study of olaparib (O) plus durvalumab (D) and bevacizumab (B) (MEDIOLA): initial results in patients (pts) with non-germline BRCA-mutated (non-gBRCAm) platinum sensitive relapsed (PSR) ovarian cancer (OC). Ann Oncol 2020;31(Suppl 4):S615–6.
    1. Zhang Y, Zhang Z. The history and advances in cancer immunotherapy: understanding the characteristics of tumor-infiltrating immune cells and their therapeutic implications. Cell Mol Immunol 2020;17:807–21. - PMC - PubMed
    1. Larson RC, Maus MV. Recent advances and discoveries in the mechanisms and functions of CAR T cells. Nat Rev Cancer 2021;21:145–61. - PMC - PubMed
    1. Wang M, Munoz J, Goy A, Locke FL, Jacobson CA, Hill BT, et al. . KTE-X19 CAR T-cell therapy in relapsed or refractory mantle-cell lymphoma. New Engl J Med 2020;382:1331–42. - PMC - PubMed

MeSH terms

Substances