. 2024 May 31:12:RP93178.
doi: 10.7554/eLife.93178.

Bacterial vampirism mediated through taxis to serum

Affiliations

Bacterial vampirism mediated through taxis to serum

Siena J Glenn et al. Elife. .

Abstract

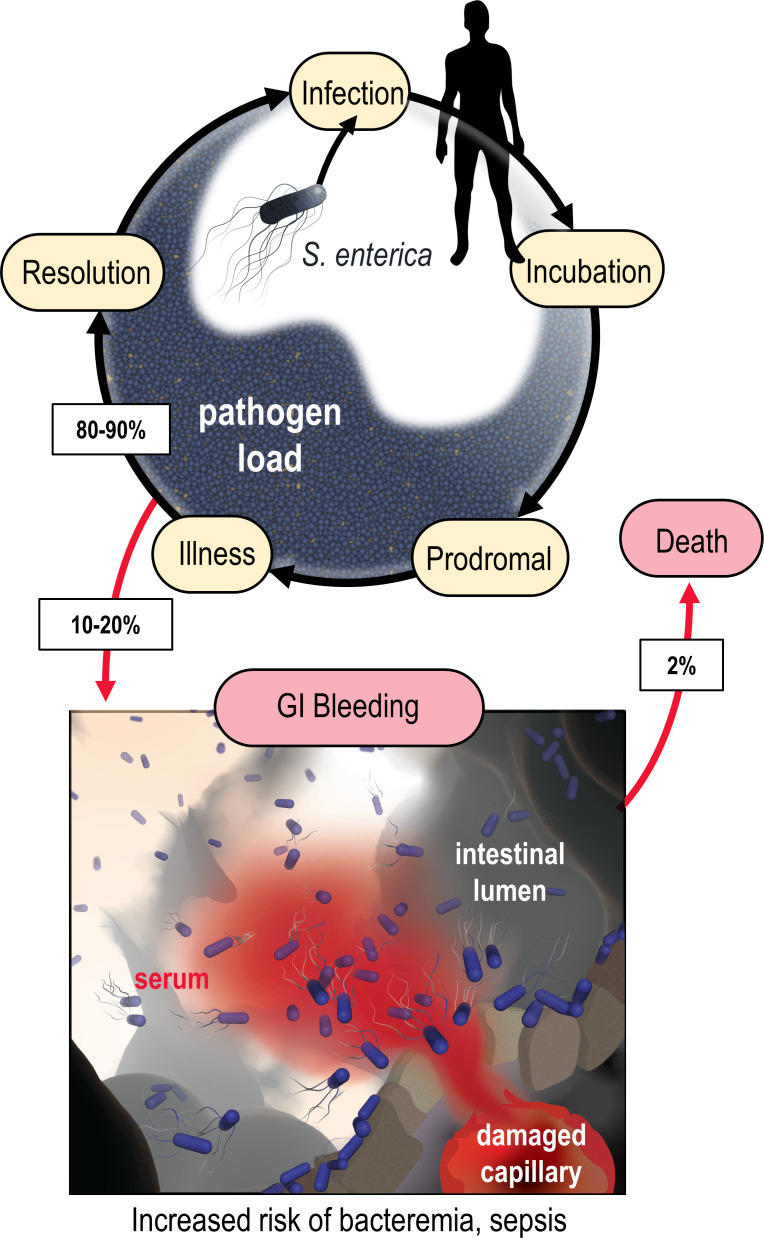
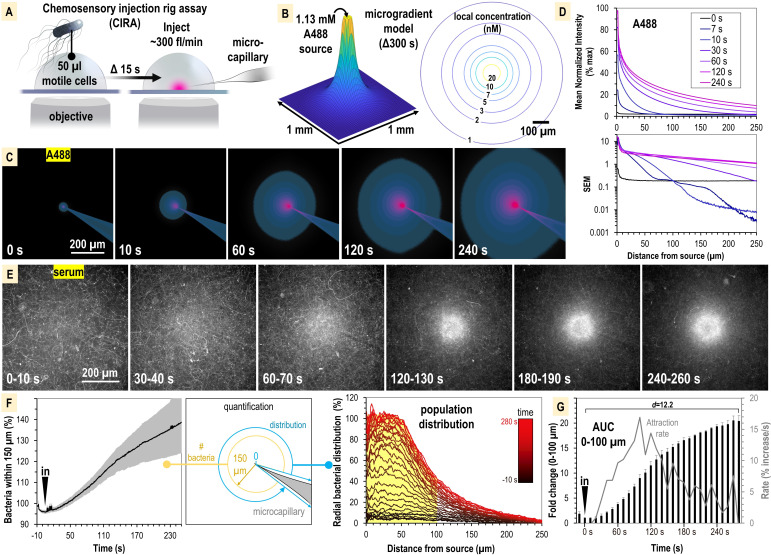
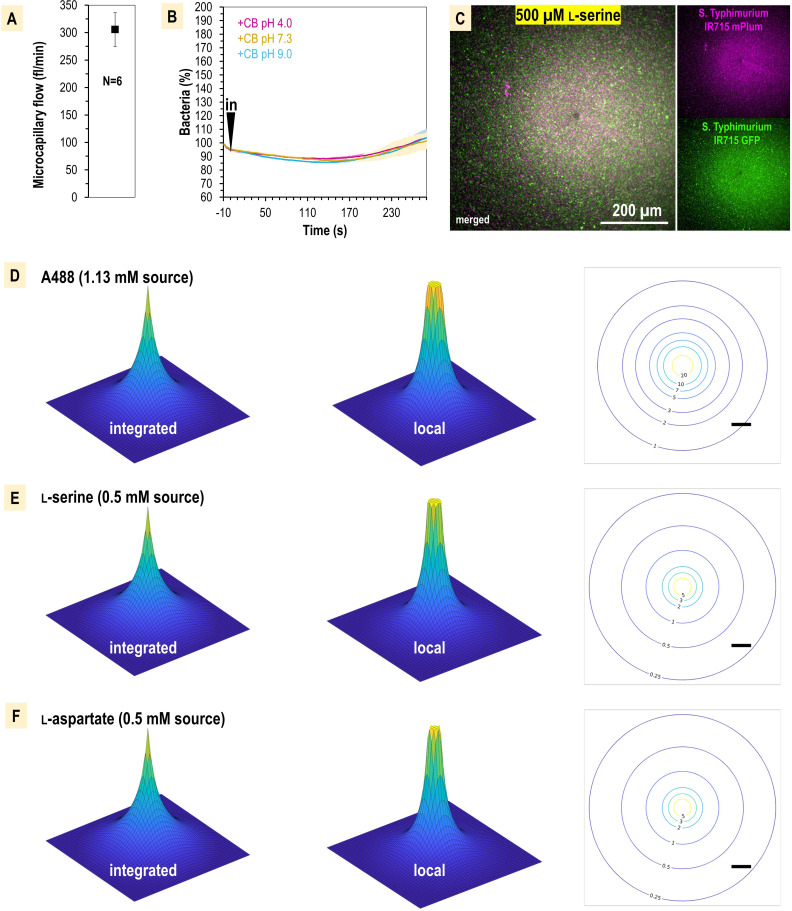
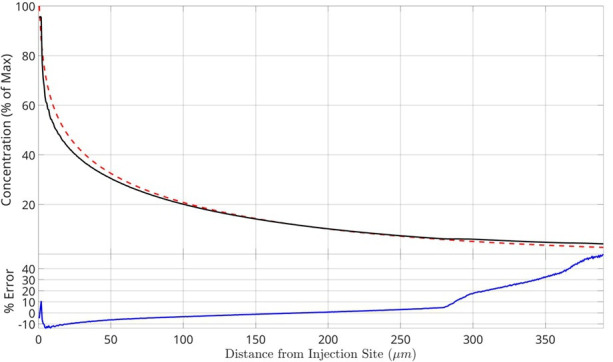
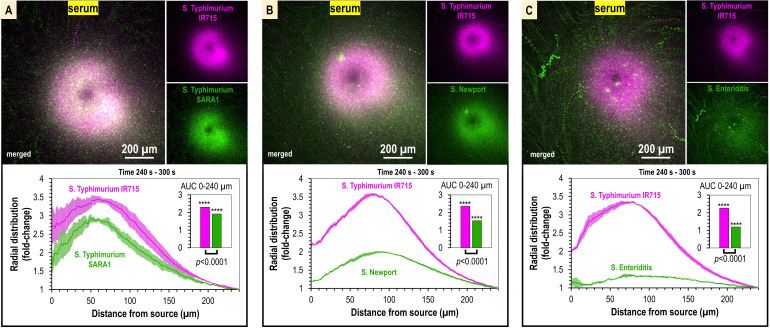
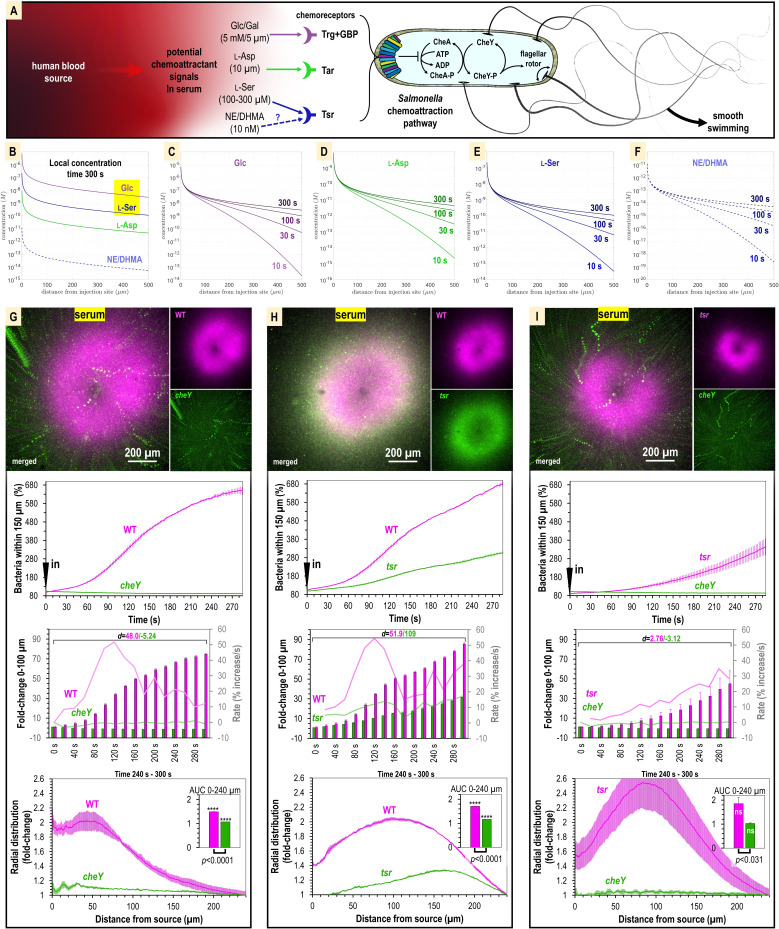
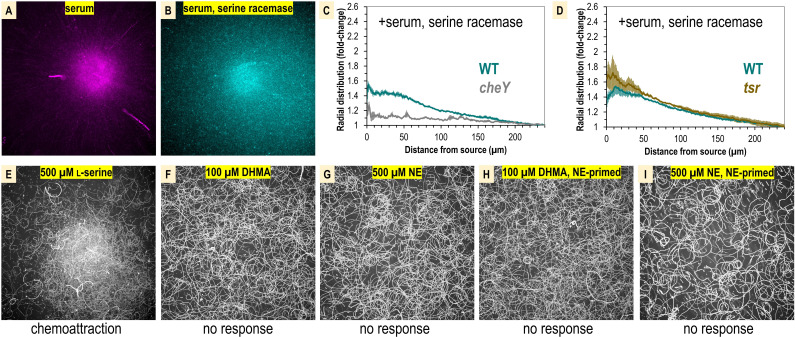
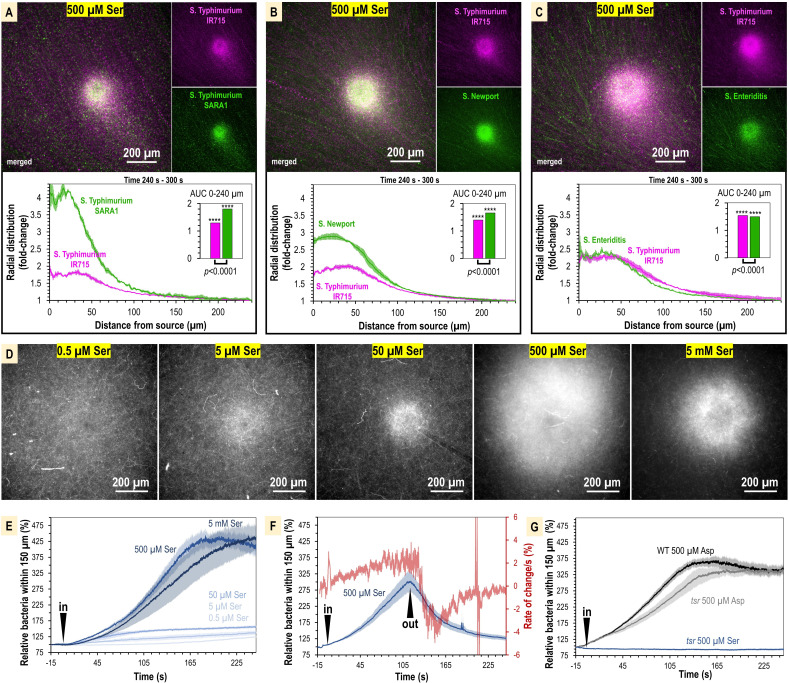
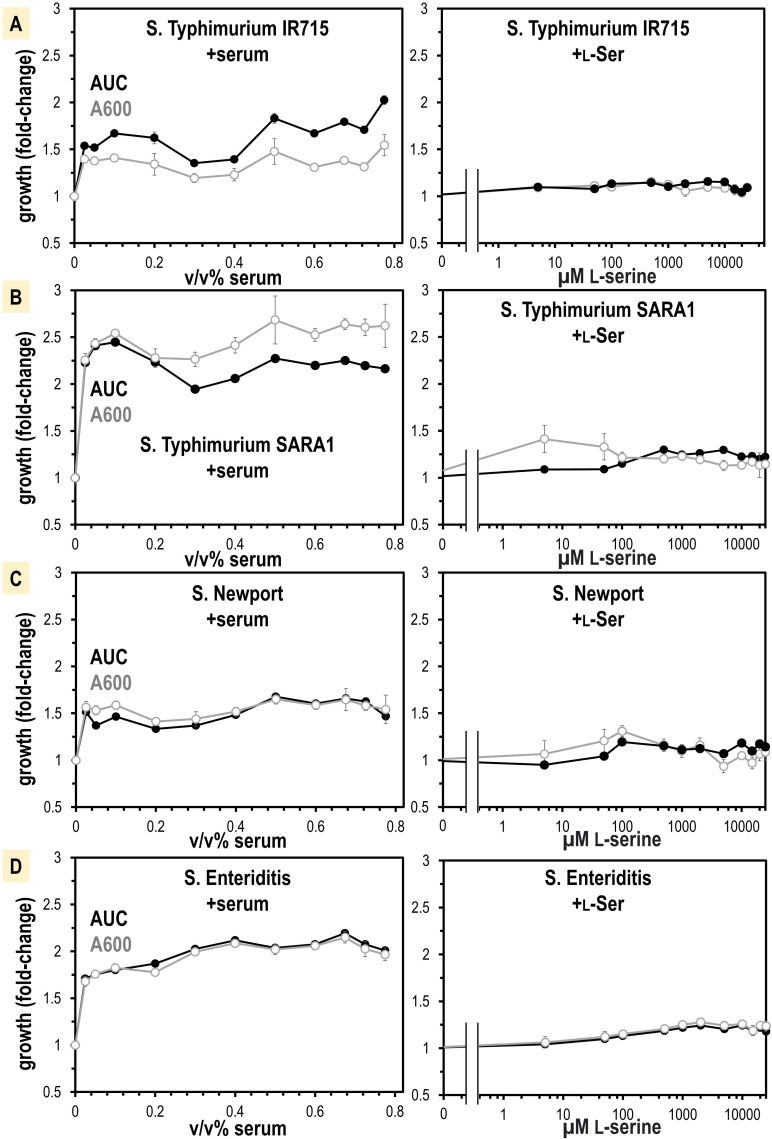
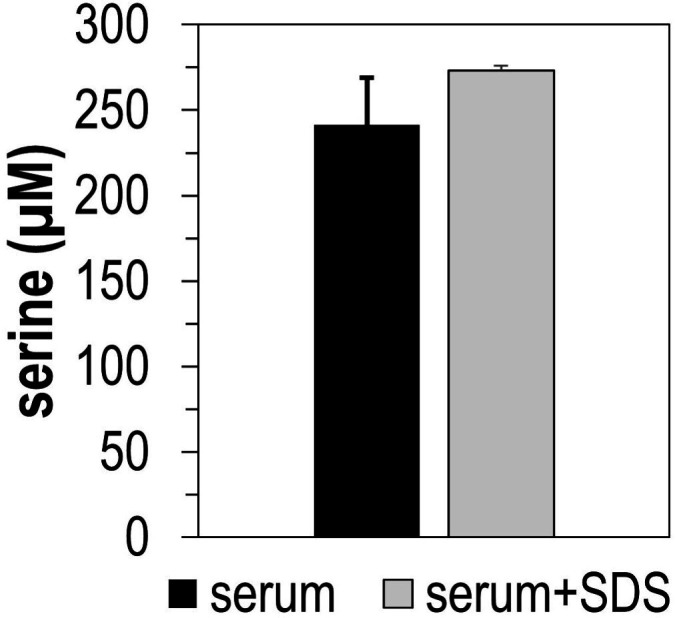
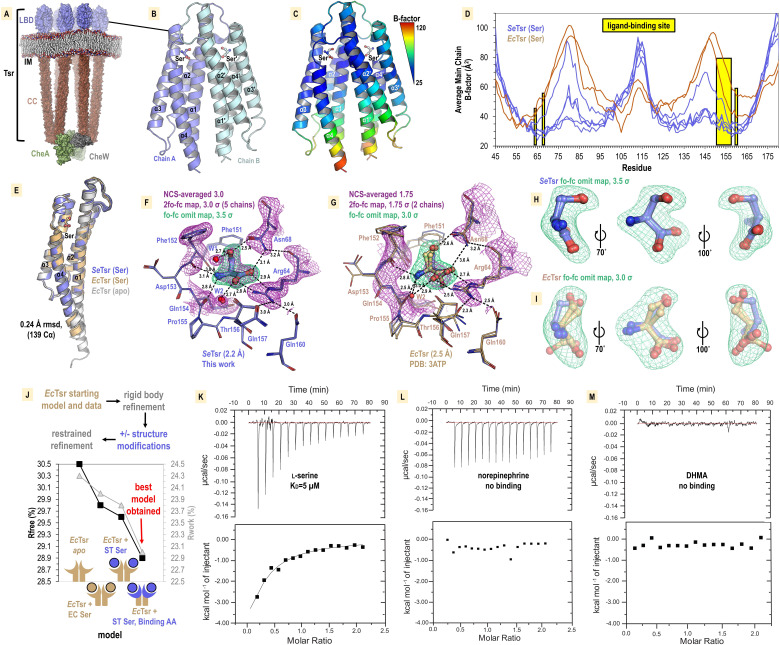
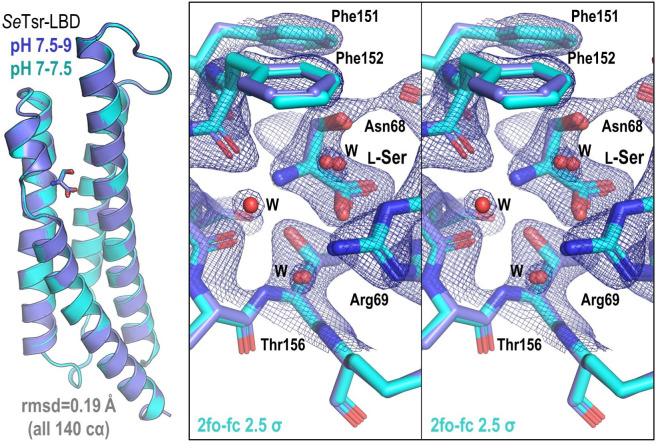
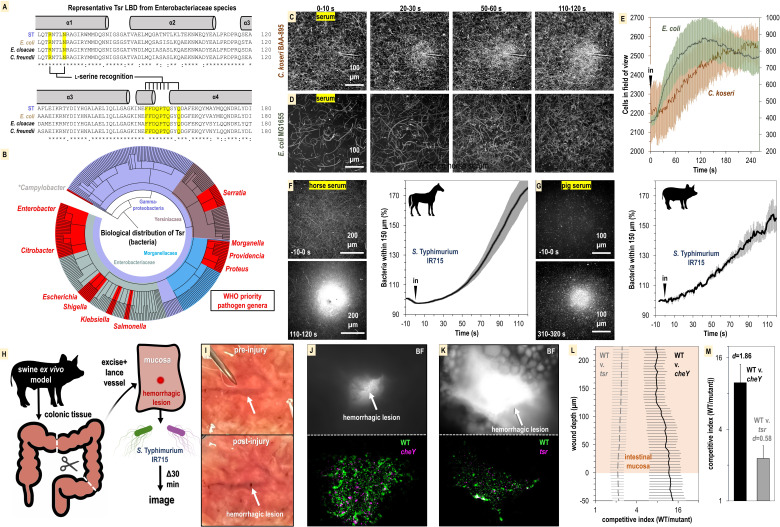
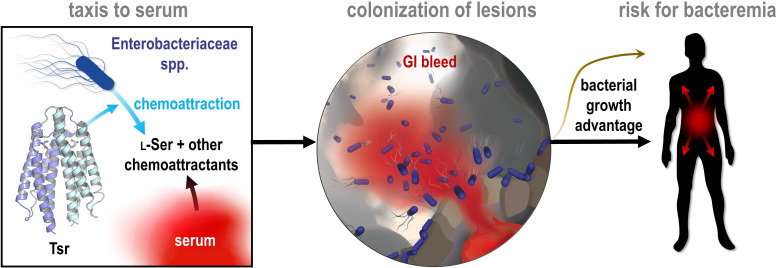
Bacteria of the family Enterobacteriaceae are associated with gastrointestinal (GI) bleeding and bacteremia and are a leading cause of death, from sepsis, for individuals with inflammatory bowel diseases. The bacterial behaviors and mechanisms underlying why these bacteria are prone to bloodstream entry remain poorly understood. Herein, we report that clinical isolates of non-typhoidal Salmonella enterica serovars, Escherichia coli, and Citrobacter koseri are rapidly attracted toward sources of human serum. To simulate GI bleeding, we utilized an injection-based microfluidics device and found that femtoliter volumes of human serum are sufficient to induce bacterial attraction to the serum source. This response is orchestrated through chemotaxis and the chemoattractant L-serine, an amino acid abundant in serum that is recognized through direct binding by the chemoreceptor Tsr. We report the first crystal structures of Salmonella Typhimurium Tsr in complex with L-serine and identify a conserved amino acid recognition motif for L-serine shared among Tsr orthologues. We find Tsr to be widely conserved among Enterobacteriaceae and numerous World Health Organization priority pathogens associated with bloodstream infections. Lastly, we find that Enterobacteriaceae use human serum as a source of nutrients for growth and that chemotaxis and the chemoreceptor Tsr provide a competitive advantage for migration into enterohemorrhagic lesions. We define this bacterial behavior of taxis toward serum, colonization of hemorrhagic lesions, and the consumption of serum nutrients as 'bacterial vampirism', which may relate to the proclivity of Enterobacteriaceae for bloodstream infections.

Keywords: E. coli; Salmonella; Tsr; chemoreceptor; chemotaxis; infectious disease; microbiology; molecular biophysics; salmonella enterica typhimurium; serine; serum; structural biology.

Plain language summary

Sepsis is the leading cause of death in patients with inflammatory bowel disease. Individuals with this condition can experience recurrent episodes of intestinal bleeding, giving intestinal (or enteric) bacteria an entry point into the bloodstream. This puts patients at risk of developing fatal infections – particularly from infections caused by bacteria belonging to the Enterobacteriaceae family. However, it is not well understood why this family of bacteria are particularly prone to entering the bloodstream. Enteric bacteria commonly respond to chemicals (or chemical stimuli) in their environment. This process, known as chemotaxis, helps bacteria with a variety of tasks, such as monitoring their environment, moving to different areas within their environment or colonizing their host. Chemical stimuli are classed as ‘attractants’ or ‘repellents’, with attractants luring the bacteria to an area and repellents discouraging the bacteria from being in a specific place. Intestinal bleeds will release serum (the liquid part of blood) into the gut, which could serve as a source of chemical stimuli to attract Enterobacteriaceae into the bloodstream. To find out more, Glenn, Gentry-Lear et al. first used a microfluidic device to simulate an intestinal bleed and tested the response of Enterobacteriaceae bacteria to serum. Using chemotaxis, bacteria were found to be attracted to the amino acid L-serine in the serum to which they were able to attach through a receptor called Tsr. They also consumed nutrients present in the human serum to help them grow. Experiments with intestinal tissue showed that chemotaxis attracted bacteria to bleeding blood vessels and the Tsr receptor helped them to infiltrate the blood vessels. Glenn et al. termed this attraction to and feeding upon blood serum as ‘bacterial vampirism’. These findings suggest that chemotaxis of Enterobacteriaceae towards L-serine in serum may be linked to their tendency to enter the bloodstream. Developing therapies that target chemotaxis in Enterobacteriaceae may provide a method for managing bloodstream infections.


Conflict of interest statement

SG, ZG, MS, MH, TA No competing interests declared, AB owns Amethyst Antimicrobials, LLC

Figures

Figure 1.
Figure 1.. Model of the microenvironment of bacterial-induced hemorrhagic lesions.
The typical course of non-typhoidal S. enterica infections is shown proceeding through infection, incubation, prodromal, illness, and resolution stages (black arrows). The atypical route of gastrointestinal (GI) bleeding, associated with increased mortality and morbidity, is shown in red arrows, with rates approximated from available literature. An artistic depiction of bacterial injury tropism is shown bottom.
Figure 2.
Figure 2.. S. enterica Typhimurium IR715 rapidly localizes toward human serum.
(A) Chemosensory injection rig assay (CIRA) experimental design. (B) CIRA microgradient diffusion model, simulated with a source of 1.13 mM A488 dye after 300 s of injection. (C) Experimental visualization of the CIRA microgradient with A488 dye. (D) Injection and diffusion of A488 dye. Shown at the top is the mean normalized fluorescence intensity at representative time points as a function of distance from the source, and shown at the bottom is the standard error of the mean (SEM) for these data (n = 6). (E) Response of S. enterica Typhimurium IR715 to human serum (max projections over 10 s intervals). (F) Quantification of S. enterica Typhimurium IR715 attraction response to human serum (n = 4, 37°C) characterized as either the relative number of bacteria within 150 µm of the source (left) or the radial distribution of the bacterial population over time (right, shown in 10 s intervals). (G) Area under the curve (AUC) versus time for the bacterial population within 100 µm of the serum treatment source (area indicated in yellow in F). Effect size (Cohen’s d) between the treatment start and endpoints is indicated. Insertion of the treatment microcapillary is indicated with black ‘in’ arrow. Attraction rate over time indicated in gray. Data shown are means, error bars indicate SEM.
Figure 2—figure supplement 1.
Figure 2—figure supplement 1.. Chemosensory injection rig assay (CIRA) experimentation controls and microgradient modeling.
(A) Average injection flow of treatment solution from the glass microcapillary. Flow was measured through injection of known concentrations of methylene blue dye, diluted in CB, into a 50 µl pond of CB over 20 min. After treatments, the absorbance of solutions was measured at 665 nm and quantified based on a standard curve. Applying a compensation pressure of 35 hPa resulted in an average flow of 305.5 fl/min ± 31. (B) CIRA localization in response to treatments of buffered CB of different pH. (C) Comparison of responses of GFP versus mPlum strains using CIRA. (D–F) Model of the CIRA microgradient for effectors relevant to this study. Topology maps of 1 mm × 1 mm size are shown for each microgradient in an ‘integrated’ format, which models what is seen by eye from the bottom-up view of the microscopy plane (left), or as the local concentration that would be experienced by a bacterium at a given distance (center). A plane through the center of the treatment sphere is shown (right), with relative concentrations experienced at a given distance expressed in nM units (scale bar is 100 µm).
Figure 2—figure supplement 2.
Figure 2—figure supplement 2.. Comparison of chemosensory injection rig assay (CIRA) diffusion modeling with experimental A488 data.
Computed (red dashed) and measured (black solid) integrated concentrations of A488 as a function of distance from injection site for time t = 120 s. Both quantities are reported as a percentage of the concentration at the injection site (1.1 mM). The relative error (blue solid) is reported as the relative difference of the measured concentration to the computed concentration.
Figure 3.
Figure 3.. Taxis to human serum is retained across S. enterica clinical isolates and diverse serovars.
(A–C) Chemosensory injection rig assay (CIRA) competition experiments between S. Typhimurium IR715 (pink) and clinical isolates (green) responding to human serum for 5 min (n = 4, 37°C). Images are representative max projections over the final minute of treatment. Radial distributions calculated from max projections and averaged across replicates are shown as fold-change relative to the image periphery at 240 µm from the source. Inset plots show fold-change area under the curve (AUC) of strains in the same experiment relative to an expected baseline of 1 (no change). p-Values shown are calculated with an unpaired two-sided t-test comparing the means of the two strains, or one-sided t-test to assess statistical significance in terms of change from onefold (stars). Data shown are means, error bars indicate SEM.
Figure 4.
Figure 4.. Attraction to human serum is mediated through chemotaxis and the chemoreceptor Tsr.
(A) Potential mechanisms involved in Salmonella sensing of chemoattractants present in human serum. Approximate concentrations of these effectors in human serum are indicated in parentheses (Zhou et al., 2023). (B–F) Microgradient modeling of serum chemoattractant concentrations. (G–I) Chemosensory injection rig assay (CIRA) competition experiments between S. Typhimurium IR715 WT and isogenic mutants cheY, or tsr, and tsr versus cheY, in response to human serum (n = 3–4, 37°C). Rates in terms of fold-change are indicated with light pink/light green lines and plotted on the gray secondary y-axis. Inset area under the curve (AUC) plots are shown as described in Figure 3. Data are means, and error bars are SEM.
Figure 4—figure supplement 1.
Figure 4—figure supplement 1.. Comparison of S. Typhimurium IR715 chemotactic responses to human serum, human serum with serine racemase treatment, L-serine versus 3,4-dihydroxymandelic acid (DHMA) and norepinephrine (NE) .
(A, B) Shown are max projections from chemosensory injection rig assay (CIRA) experiments over a 10 s time period following 300 s of treatments as shown. (C, D) The radial distribution of bacteria in CIRA competition experiments with serine-racemase-treated human serum after 300 s is shown. (E–I) Shown are max projections over 10 s following CIRA treatments, as indicated. The chemotactic response is noted below each experiment. Panels (H–I) utilized cells that were primed with 5 µM NE for 3 hr prior to experimentation.
Figure 5.
Figure 5.. The concentration of L-serine in human serum is sufficient to mediate chemoattraction.
(A–C) Chemosensory injection rig assay (CIRA) competition experiments between S. Typhimurium IR715 (pink) and clinical isolates (green) in response to 500 µM L-serine (n = 3, 37°C). (D) Representative results showing max projections of S. Typhimurium IR715 at 240–300 s post CIRA treatment with L-serine concentrations (30°C). (E) Quantification of multiple replicate experiments shown in (D). (F) Attraction and dispersion of S. Typhimurium IR715 following addition and removal of 500 µM L-serine source (30°C). (G) S. Typhimurium IR715 WT or tsr mutant responses to L-aspartate or L-serine treatments (30°C).
Figure 5—figure supplement 1.
Figure 5—figure supplement 1.. Calculation of L-serine source required for half-maximal chemoattraction response (K1/2).
Data are mean area under the curve (AUC) values of relative number of bacteria within 150 µm of the treatment location for the –15 s to 250 s range, represented as fold-change. Data are fit with an exponential curve (red line). y=a+becx, where a = 2.636193, b = −1.616338, and c = 0.006282888. K1/2 is calculated to be 105 µm (x, dashed lines).
Figure 6.
Figure 6.. Non-typhoidal S. enterica strains obtain a growth benefit from human serum not recapitulated from L-Ser treatments alone.
(A–D) Growth is shown as area under the curve (AUC, black) and A600 at mid-log phase for the untreated replicates (gray, n = 16). Data are means, and error is SEM.
Figure 6—figure supplement 1.
Figure 6—figure supplement 1.. Total serine present in human serum samples, as determined by mass spectrometry.
Treatment with 50 µg recombinant serine dehydratase (SDS) over 4 hr did not decrease serine content in human serum.
Figure 7.
Figure 7.. Structural mechanism underlying taxis to serum.
(A) Model of the core chemoreceptor signaling unit showing two full-length Tsr chemoreceptor trimer-of-dimers; coiled-coil region (CC), inner membrane (IM) Cassidy et al., 2020. (B) Crystal structure of S. enterica Tsr ligand-binding domain (LBD) dimer in complex with L-serine (2.2 Å). (C, D) Relative order of the SeTsr structure as indicated by B-factor (Å2). (E) Overlay of chains from serine-bound SeTsr (blue), serine-bound EcTsr (orange), and apo EcTsr (white). (F) Binding of the L-serine ligand as seen with an overlay of the five unique chains of the asymmetric unit (AU) in the SeTsr structure. Purple mesh represents averaged non-crystallographic symmetry 2fo-fc omit map electron density (ligand not included in the density calculations). Green mesh represents fo-fc omit map difference density for Chain A. Hydrogen bonds to the ligand are shown as dashed black lines with distances indicated in Å. (G) The ligand-binding site of serine-bound EcTsr is shown as in (F), with omit map fo-fc electron density. The two chains of EcTsr in the AU are overlaid (orange) with one chain of serine-bound SeTsr (blue). (H, I) Closeup view of the L-serine ligand and fo-fc omit map density for the SeTsr (blue) and EcTsr (orange) structures, respectively. (J) Paired refinement comparing resulting crystallographic R-factors, as indicated. The schematics indicate for each refinement which parts of the Tsr LBD dimer were modeled as in the EcTsr structure (orange) or SeTsr structure (blue), with the crescent shape representing the ligand-binding site. For each refinement strategy and resulting model, Rfree values (black) and Rwork values (gray) are indicated. (K–M) Isothermal titration calorimetry analyses of the SeTsr LBD with L-serine, norepinephrine (NE) , or 3,4-dihydroxymandelic acid (DHMA).
Figure 7—figure supplement 1.
Figure 7—figure supplement 1.. Comparison of SeTsr ligand-binding domain (LBD) structures solved at different pH.
Shown on the left is an overlay of SeTsr at pH 7.5–9.7 (PDB: 8FYV, dark blue) and pH 7–7.5 (PDB: 8VL8, light blue). Shown on the right is a stereo image of the overlaid L-Ser binding site with electron density shown for the pH 7–7.5 structure as blue mesh.
Figure 8.
Figure 8.. Relevance of bacterial vampirism in other systems.
(A) Sequence conservation of the Tsr ligand-binding domain among representative Enterobacteriaceae orthologues with residues of the L-serine ligand-binding pocket highlighted. (B) Biological distribution of Tsr orthologues. WHO priority pathogen genera are highlighted in red. (C, D) Response of C. koseri BAA-895 (n = 3, 37°C) and E. coli MG1655 to human serum (n = 3, 30°C), shown as max projections at indicated time points. (E) Quantification of chemotaxis responses. Plotted data shown are shown on separate y-axes as mean cells in the field of view averaged over 1 s. (F, G) Response of wildtype (WT) S. Typhimurium IR715 to horse serum or pig serum. (H) Overview of swine ex vivo colonic hemorrhagic lesion model. (I) Representative images of colonic mucosa before (top) and after (bottom) lancing of vasculature. (J, K) Representative images showing bacterial localization into colonic hemorrhagic lesions in co-inoculation experiments with WT (gfp) and cheY (dtom) (n = 4), or WT (gfp) and tsr (dtom) (n = 3) S. Typhimurium IR715. The lesion is shown in brightfield (BF, top) and gfp/dtom fluorescent channels (bottom). (L) Competitive indices of migration into lesions. The mucosa is set to a y-axis value of 0, and migration further into the lesion is reflected by increasing y-axis values. The x-axis is shown on a log scale. (M) Area under the curve (AUC) quantification of bacterial lesions localization shown in (L) (0–225 µM). Effect size (Cohen’s d) is noted. Data shown are means, and error bars show SEM.
Figure 9.
Figure 9.. Model of bacterial vampirism.
Serum contains high concentrations of L-Ser, and other chemoattractants, that are recognized by chemoreceptors, including Tsr, to drive Enterobacteriaceae taxis toward serum. Taxis to serum promotes colonization of enterohemorrhagic lesions and provides a bacterial growth advantage from nutrients acquired from serum. The bacterial behavior of seeking and feeding on serum, which we have defined as ‘bacterial vampirism’ may represent a risk factor for bacterial entry into the bloodstream.

Update of

Similar articles

Cited by

References

    1. Adams PD, Afonine PV, Bunkóczi G, Chen VB, Davis IW, Echols N, Headd JJ, Hung L-W, Kapral GJ, Grosse-Kunstleve RW, McCoy AJ, Moriarty NW, Oeffner R, Read RJ, Richardson DC, Richardson JS, Terwilliger TC, Zwart PH. PHENIX : a comprehensive Python-based system for macromolecular structure solution. Acta Crystallographica Section D Biological Crystallography. 2010;66:213–221. doi: 10.1107/S0907444909052925. - DOI - PMC - PubMed
    1. Aihara E, Closson C, Matthis AL, Schumacher MA, Engevik AC, Zavros Y, Ottemann KM, Montrose MH. Motility and chemotaxis mediate the preferential colonization of gastric injury sites by Helicobacter pylori. PLOS Pathogens. 2014;10:e1004275. doi: 10.1371/journal.ppat.1004275. - DOI - PMC - PubMed
    1. Aljarad Z, Mobayed BB. The mortality rate among patients with acute upper GI bleeding (with/without EGD) at Aleppo University Hospital: A retrospective study. Annals of Medicine and Surgery. 2021;71:102958. doi: 10.1016/j.amsu.2021.102958. - DOI - PMC - PubMed
    1. Belizário JE, Faintuch J. Microbiome and gut dysbiosis. Experientia Supplementum. 2018;109:459–476. doi: 10.1007/978-3-319-74932-7_13. - DOI - PubMed
    1. Beltran P, Plock SA, Smith NH, Whittam TS, Old DC, Selander RK. Reference collection of strains of the Salmonella typhimurium complex from natural populations. Journal of General Microbiology. 1991;137:601–606. doi: 10.1099/00221287-137-3-601. - DOI - PubMed

LinkOut - more resources