. 2024 Dec 18;110(1):238-253.
doi: 10.1210/clinem/dgae369.

Single-Cell Analysis of Subcutaneous Fat Reveals Profibrotic Cells That Correlate With Visceral Adiposity in HIV

Affiliations

Single-Cell Analysis of Subcutaneous Fat Reveals Profibrotic Cells That Correlate With Visceral Adiposity in HIV

Samuel S Bailin et al. J Clin Endocrinol Metab. .

Abstract

Context: Cardiometabolic diseases are common in persons with HIV (PWH) on antiretroviral therapy (ART), which has been attributed to preferential lipid storage in visceral adipose tissue (VAT) compared with subcutaneous adipose tissue (SAT). However, the relationship of SAT-specific cellular and molecular programs with VAT volume is poorly understood in PWH.

Objective: We characterized SAT cell-type specific composition and transcriptional programs that are associated with greater VAT volume in PWH on contemporary ART.

Methods: We enrolled PWH on long-term ART with a spectrum of metabolic health. Ninety-two participants underwent SAT biopsy for bulk RNA sequencing and 43 had single-cell RNA sequencing. Computed tomography quantified VAT volume and insulin resistance was calculated using the Homeostasis Model Assessment 2 Insulin Resistance (HOMA2-IR).

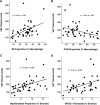
Results: VAT volume was associated with HOMA2-IR (P < .001). Higher proportions of SAT intermediate macrophages (IMs), myofibroblasts, and MYOC+ fibroblasts were associated with greater VAT volume using partial Spearman's correlation adjusting for age, sex, and body mass index (r = 0.34-0.49, P < .05 for all). Whole SAT transcriptomics showed PWH with greater VAT volume have increased expression of extracellular matrix (ECM)- and inflammation-associated genes, and reduced expression of lipolysis- and fatty acid metabolism-associated genes.

Conclusion: In PWH, greater VAT volume is associated with a higher proportion of SAT IMs and fibroblasts, and a SAT ECM and inflammatory transcriptome, which is similar to findings in HIV-negative persons with obesity. These data identify SAT cell-type specific changes associated with VAT volume in PWH that could underlie the high rates of cardiometabolic diseases in PWH, though additional longitudinal studies are needed to define directionality and mechanisms.

Keywords: HIV; inflammation; insulin resistance; single-cell RNA sequencing; visceral adipose tissue.


Figures

Figure 1.
Figure 1.
Visceral adipose tissue volume is associated with insulin resistance. (A-D) Odds ratio plots from the 25th to 75th percentile for the outcome of interest with effect size on the x-axis (square) and 95% CI (line), and covariable on the y-axis. Odds ratios were generated from an ordinal regression model for (A) fasting blood glucose (FBG), (B) homeostatic model assessment for insulin resistance 2 (HOMA2-IR), (C) hemoglobin A1c (HbA1c), and (D) triglyceride (TG) to high-density lipoprotein (HDL) ratio.
Figure 2.
Figure 2.
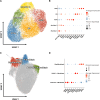
Single-cell analysis identifies macrophage and stromal subsets in subcutaneous adipose tissue. (A) Uniform manifold approximation and project (UMAP) for subcutaneous adipose tissue macrophage populations. (B) Dot plot showing selected macrophage gene markers on the x-axis and cell type on the y-axis. The dot size reflects the percentage of cells expressing the gene while the color reflects the scaled average expression. (C) UMAP for subcutaneous adipose tissue fibroblast populations. (D) Dot plot showing selected stromal gene markers on the x-axis and cell type on the y-axis. The dot size reflects the percentage of cells expressing the gene while the color reflects the scaled average expression.
Figure 3.
Figure 3.
Subcutaneous adipose tissue macrophage and fibroblast composition is associated with visceral adipose tissue volume. (A-D) Scatter plots with cell proportion (percent) on the x-axis and visceral adipose tissue (VAT) volume on the y-axis for (A) intermediate macrophages (IMs), (B) perivascular macrophages (PVMs), (C) myofibroblasts, and (D) MYOC+ fibroblasts. The partial Spearman r (adjusted for age, sex, and body mass index) and P value are shown.
Figure 4.
Figure 4.
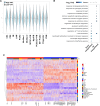
Regulatory transcriptional profile shifts towards lipid metabolism, inflammation, and fibrosis with greater visceral adipose tissue volume. (A) Distribution of expression scores for each cell type component for multicellular program (MP) 1 with kernel density estimates. (B) Over-representation analysis using Gene Ontology biological process for genes in the up and down compartments in MP1. Dot size represents the number of gene hits in the pathway and dot color represents the –log10 adjusted P value. (C) Average scaled expression of genes from MP1 sorted by expression and cell type (columns), across samples plotted with Ward D2 hierarchical clustering (rows) and labeled with visceral adipose tissue (VAT) volume quartile. Abbreviations: FIB, fibroblast; IM, intermediate macrophage; Mac, macrophage; Mo, monocyte; MT, methallothionein; LAM, lipid-associated macrophage; PreAd, preadipocyte; PVM, perivascular macrophage.
Figure 5.
Figure 5.
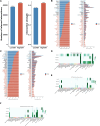
Intercellular communication analysis predicts enhanced interactions between immune cells and stromal cells through proinflammatory and fibrotic pathways. (A) Bar plot with the overall number of inferred interactions (left) and interaction strength (right) of the lowest visceral adipose tissue (VAT) volume tertile (blue) and highest VAT volume tertile (orange) predicted by CellChat. (B, C) Bar plot with ranked relative information flow (left) and overall information flow (right) on the x-axis and predicted ligand-ligand receptor pathways from source cell to target cells. Signaling in the highest VAT volume tertile is shown in orange while signaling in lowest VAT volume tertile is shown in blue. Pathways with significantly greater interaction with higher VAT volume based on Wilcoxon rank sum are labeled in orange while pathways with significantly greater interaction in lower VAT volume are labeled in blue (P < .05). (B) Stromal cells (source) to other subcutaneous adipose tissue cells (target). (C) Other subcutaneous adipose tissue cells (source) to stromal cells (target). (D) Heatmap showing the relative importance of each cell group based on the computed 4 network centrality measures of the TGF-β signaling network. (E) Heatmap showing the relative importance of each cell group based on the computed 4 network centrality measures of the WNT signaling network. (F) Heatmap showing the relative importance of each cell group based on the computed 4 network centrality measures of the chemerin signaling network.
Figure 6.
Figure 6.
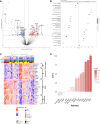
Whole tissue transcriptomics reveals proinflammatory, profibrotic, and altered adipocyte expression programs. (A) Volcano plot with average log2-fold change (x-axis) and -log10 adjusted P value (y-axis) for highest visceral adipose tissue (VAT) volume tertile vs lowest VAT volume tertile (reference). Genes that had ≥0.25 log2-fold change and adjusted P < .05 were colored red (higher expression) and blue (lower expression). Select genes important for adipogenesis, inflammation, and extracellular matrix deposition were labeled. (B) Gene set enrichment analysis (GSEA) using the WikiPathways. The top pathways are plotted with gene ratio on the x-axis and descriptive term on the y-axis, split by whether the pathway was over (activated) or under (suppressed) represented. The dot size represents the number of gene hits in the pathway and dot color represents the adjusted P value. (C) Heatmap of select genes important for adipogenesis, lipolysis, extracellular matrix deposition, and inflammation. Genes were scaled after log2-normalization of counts per million using edgeR. Batch effect was removed using Limma. Columns (participant) were plotted with Ward D2 hierarchical clustering. (D) Pathway activity inference from bulk RNA sequencing data using decoupleR with pathways plotted on the x-axis and weighted mean score on the y-axis. Positive scores are higher in persons with higher VAT volume. *P < .05.
Figure 7.
Figure 7.
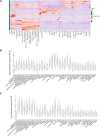
Differentially expressed genes with VAT volume map to intermediate macrophages and fibroblasts. (A) Heatmap of differentially expressed genes in the highest tertile VAT volume compared with the lowest tertile VAT volume. The average normalized gene expression (row) by cell type was scaled and plotted by cell type (column) using Ward D2 hierarchical clustering. The log2-fold changes from DESeq2 for each gene are shown on the left. (B) Averaged scaled expression program for differentially expressed genes that are positively associated with VAT volume plotted by cell type (x-axis). (C) Average scaled expression program for differentially expressed genes (P adjusted < .1) that are members of the extracellular matrix organization Reactome pathway, plotted by cell type (x-axis). Abbreviations: cDC, conventional dendritic cell; cMo, conventional monocyte; DC, dendritic cell; EC, endothelial cell; ECM, extracellular matrix; ILC, innate lymphoid cell; IM, intermediate macrophage; LAM, lipid-associated macrophage; Mac, macrophage; mNK, mature natural killer; Mo, monocyte; NK, natural killer; nMo, nonconventional monocyte; pDC, plasmacytoid dendritic cell; PVM, perivascular macrophage; TCM, T central memory; TEM, T effectory memory; VSMC, vascular smooth muscle cell.

Similar articles

Cited by

References

    1. Shah ASV, Stelzle D, Lee KK, et al. Global burden of atherosclerotic cardiovascular disease in people living with HIV: systematic review and meta-analysis. Circulation. 2018;138(11):1100‐1112. - PMC - PubMed
    1. Bischoff J, Gu W, Schwarze-Zander C, et al. Stratifying the risk of NAFLD in patients with HIV under combination antiretroviral therapy (cART). EClinicalMedicine. 2021;40:101116. - PMC - PubMed
    1. Nansseu JR, Bigna JJ, Kaze AD, Noubiap JJ. Incidence and risk factors for prediabetes and diabetes mellitus among HIV-infected adults on antiretroviral therapy: a systematic review and meta-analysis. Epidemiology. 2018;29(3):431‐441. - PubMed
    1. Ghaben AL, Scherer PE. Adipogenesis and metabolic health. Nat Rev Mol Cell Biol. 2019;20(4):242‐258. - PubMed
    1. Shah RV, Murthy VL, Abbasi SA, et al. Visceral adiposity and the risk of metabolic syndrome across body mass index: the MESA study. JACC Cardiovasc Imaging. 2014;7(12):1221‐1235. - PMC - PubMed

MeSH terms