Towards cascading genetic risk in Alzheimer's disease
- PMID: 38820112
- PMCID: PMC11292901
- DOI: 10.1093/brain/awae176
Towards cascading genetic risk in Alzheimer's disease
Abstract
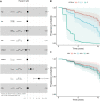
Alzheimer's disease typically progresses in stages, which have been defined by the presence of disease-specific biomarkers: amyloid (A), tau (T) and neurodegeneration (N). This progression of biomarkers has been condensed into the ATN framework, in which each of the biomarkers can be either positive (+) or negative (-). Over the past decades, genome-wide association studies have implicated ∼90 different loci involved with the development of late-onset Alzheimer's disease. Here, we investigate whether genetic risk for Alzheimer's disease contributes equally to the progression in different disease stages or whether it exhibits a stage-dependent effect. Amyloid (A) and tau (T) status was defined using a combination of available PET and CSF biomarkers in the Alzheimer's Disease Neuroimaging Initiative cohort. In 312 participants with biomarker-confirmed A-T- status, we used Cox proportional hazards models to estimate the contribution of APOE and polygenic risk scores (beyond APOE) to convert to A+T- status (65 conversions). Furthermore, we repeated the analysis in 290 participants with A+T- status and investigated the genetic contribution to conversion to A+T+ (45 conversions). Both survival analyses were adjusted for age, sex and years of education. For progression from A-T- to A+T-, APOE-e4 burden showed a significant effect [hazard ratio (HR) = 2.88; 95% confidence interval (CI): 1.70-4.89; P < 0.001], whereas polygenic risk did not (HR = 1.09; 95% CI: 0.84-1.42; P = 0.53). Conversely, for the transition from A+T- to A+T+, the contribution of APOE-e4 burden was reduced (HR = 1.62; 95% CI: 1.05-2.51; P = 0.031), whereas the polygenic risk showed an increased contribution (HR = 1.73; 95% CI: 1.27-2.36; P < 0.001). The marginal APOE effect was driven by e4 homozygotes (HR = 2.58; 95% CI: 1.05-6.35; P = 0.039) as opposed to e4 heterozygotes (HR = 1.74; 95% CI: 0.87-3.49; P = 0.12). The genetic risk for late-onset Alzheimer's disease unfolds in a disease stage-dependent fashion. A better understanding of the interplay between disease stage and genetic risk can lead to a more mechanistic understanding of the transition between ATN stages and a better understanding of the molecular processes leading to Alzheimer's disease, in addition to opening therapeutic windows for targeted interventions.
Keywords: APOE; Alzheimer’s disease; biomarker; longitudinal progression; polygenic risk.
© The Author(s) 2024. Published by Oxford University Press on behalf of the Guarantors of Brain.
Conflict of interest statement
The authors report no competing interests.
Figures


Comment in
-
Disentangling genetic risks for development and progression of Alzheimer's disease.Brain. 2024 Aug 1;147(8):2604-2606. doi: 10.1093/brain/awae237. Brain. 2024. PMID: 39018494 Free PMC article.
References
-
- Braak H, de Vos RAI, Jansen ENH, Bratzke H, Braak E. Neuropathological hallmarks of Alzheimer’s and Parkinson’s diseases. Prog Brain Res. 1998;117:267–285. - PubMed
MeSH terms
Substances
Grants and funding
- Brain Research UK
- P30 AG066518/AG/NIA NIH HHS/United States
- ALZ/Alzheimer's Association/United States
- National Institute for Health Research University College London Hospitals Biomedical Research Centre
- BHF_/British Heart Foundation/United Kingdom
- Italian Ministry of Health
- Weston Brain Institute
- 733051106/ZONMW_/ZonMw/Netherlands
- Early Detection of Alzheimer's Disease Subtypes (E-DADS) project
- ANR-19-JPW2-000/Agence Nationale de la Recherche
- WT_/Wellcome Trust/United Kingdom
- Alzheimer's Research UK
- EU Joint Programme-Neurodegenerative Disease Research (JPND) project
- MR/T046422/1/MRC_/Medical Research Council/United Kingdom
- 2019-2.1.7-ERA-NET-2020-00008/National Research, Development and Innovation Office
- 1191535/National Health & Medical Research Council
- 227341/Z/23/Z/WT_/Wellcome Trust/United Kingdom
- Wolfson Foundation

