. 2024 Sep 4;22(9):826-839.
doi: 10.1158/1541-7786.MCR-23-0904.

Clinically Relevant Humanized Mouse Models of Metastatic Prostate Cancer Facilitate Therapeutic Evaluation

Affiliations

Clinically Relevant Humanized Mouse Models of Metastatic Prostate Cancer Facilitate Therapeutic Evaluation

Raymond J Kostlan et al. Mol Cancer Res. .

Abstract

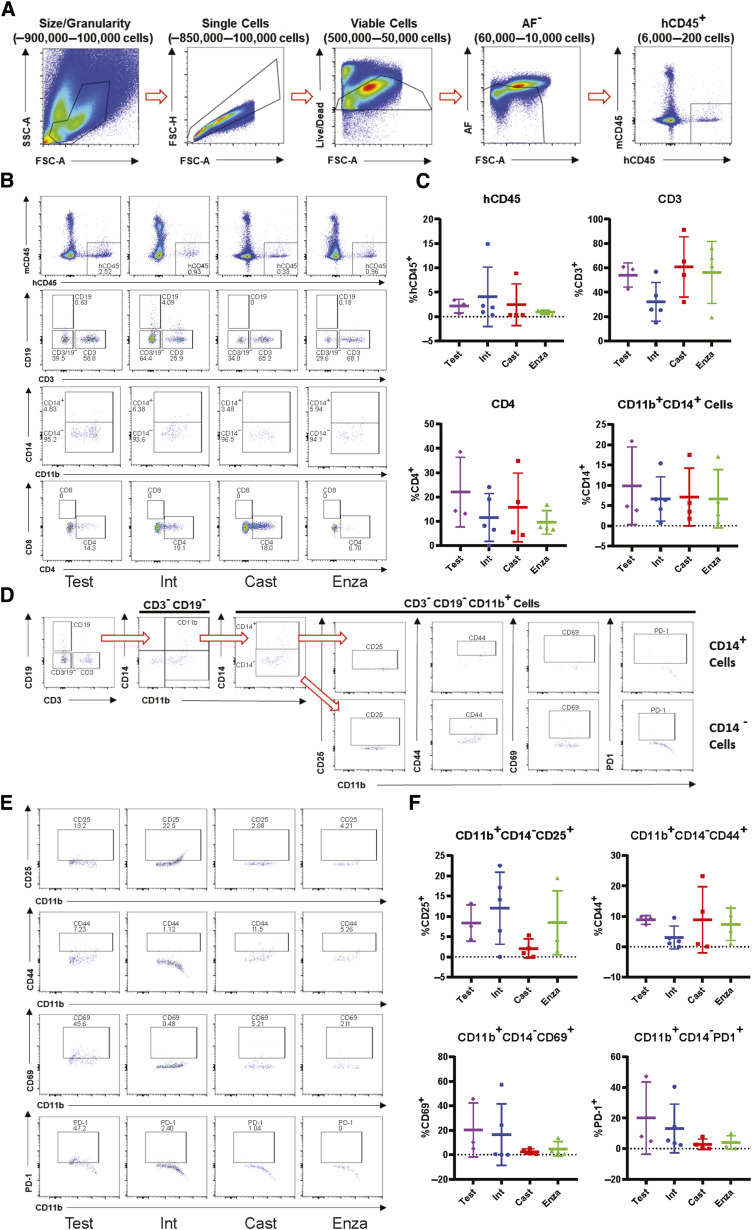
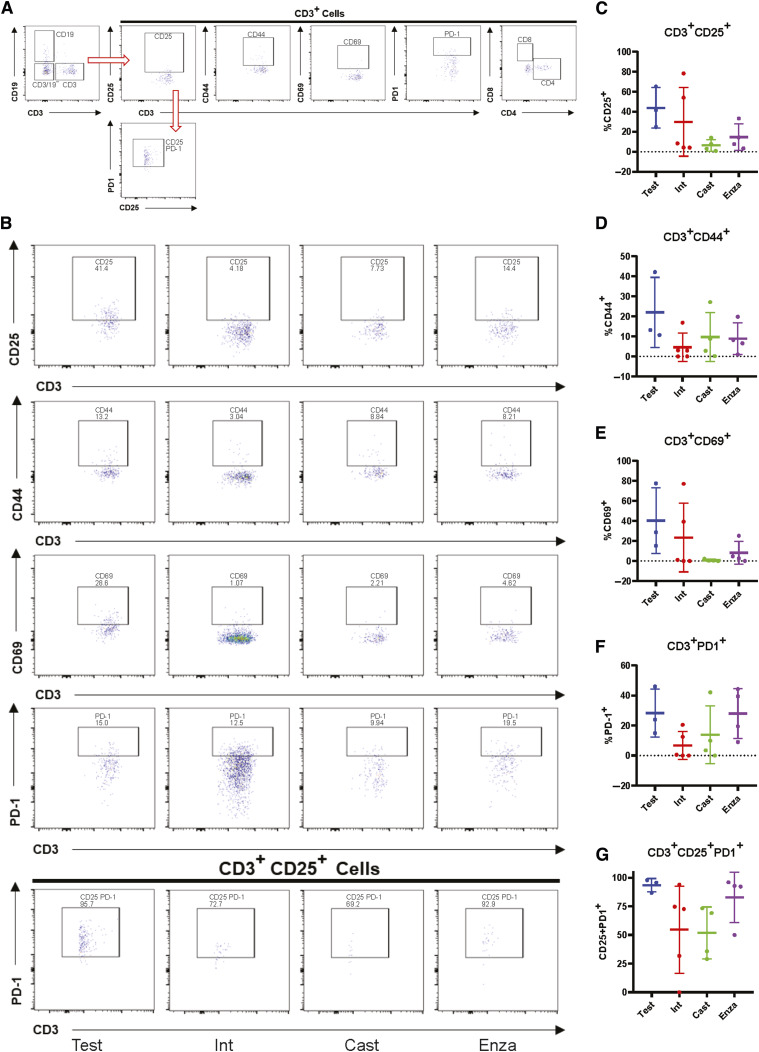
There is tremendous need for improved prostate cancer models. Anatomically and developmentally, the mouse prostate differs from the human prostate and does not form tumors spontaneously. Genetically engineered mouse models lack the heterogeneity of human cancer and rarely establish metastatic growth. Human xenografts are an alternative but must rely on an immunocompromised host. Therefore, we generated prostate cancer murine xenograft models with an intact human immune system (huNOG and huNOG-EXL mice) to test whether humanizing tumor-immune interactions would improve modeling of metastatic prostate cancer and the impact of androgen receptor-targeted and immunotherapies. These mice maintain multiple human immune cell lineages, including functional human T-cells and myeloid cells. Implications: To the best of our knowledge, results illustrate the first model of human prostate cancer that has an intact human immune system, metastasizes to clinically relevant locations, responds appropriately to standard-of-care hormonal therapies, and can model both an immunosuppressive and checkpoint-inhibition responsive immune microenvironment.


Conflict of interest statement

S. Kregel reports non-financial support from Taconic Biosciences during the conduct of the study. No disclosures were reported by the other authors.

Figures

None
Graphical abstract
Figure 1.
Figure 1.
Experimental setup and 22Rv1 growth in huNOG mice. A, Experimental schematic: HuNOG and NOG control mice were surgically castrated. One week following castration, control intact and castrated mice were injected subcutaneously with luciferase-transduced 22Rv1 human prostate cancer cells to assay organ-specific metastatic growth. Castrated mice were then randomized and treated with enzalutamide or vehicle control (intact mice also treated with vehicle). Primary tumors were measured every 2–3 days until endpoint. huNOG: Intact n = 9, Castrated n = 8, Castrated Enza n = 7. NOG: Intact n = 9, Castrated n = 5, Castrated Enza n = 9. BioRender.comB, Subcutaneous primary flank tumor volume growth measured over time. huNOG: Intact n = 18, Castrated n = 16, Castrated Enza n = 14. NOG: Intact n = 18, Castrated n = 10, Castrated Enza n = 18. C, Schematic of endpoint analysis: Prior to sacrifice, mice were injected with luciferin. At sacrifice, organs were analyzed ex vivo for metastatic growth using the IVIS bioluminescence system (PerkinElmer); images illustrate signal intensity and location. BioRender.comD, Quantification of average signal intensity per unit area of bioluminescence of mouse femurs. E, Representative IVIS images of 22Rv1 metastasis to femur. F, Histological validation (H&E stain) of the femoral metastases confirmed by a pathologist (Rahul Manan), with cancer cells seen in both the bone marrow and matrix of the epiphyseal head of a mouse femur (yellow arrow indicates 22Rv1 tumor mass). (A and C, Created with BioRender.com.)
Figure 2.
Figure 2.
Metastasis by 22Rv1 to additional clinically relevant organs in huNOG mice. A, Bioluminescent images taken of mouse brain. B, Quantified bioluminescence of brain metastasis. C, Bioluminescent images taken of mouse liver. D, Quantified bioluminescence of liver metastasis. E, Kidney (adrenal gland) bioluminescent images. F, Quantified bioluminescence of Kidney (tumor mostly in adrenal gland).
Figure 3.
Figure 3.
Activated T-cell immune profile in huNOG tumors. A, Gating strategy employed to determine T-cell activation status. B, Total percentage of CD45+ cells acquired from tumor tissue harvesting split between the intact control, castrated vehicle, and castrated with enzalutamide treatment. C, Percentage of CD3+ cells observed in the total CD45+ population. D, Percentage of CD3+ cells showing IFNγ expression via intracellular staining. E, Measurement of the percentage of CD4+ cells expressing IFNγ harvested from the spleen. F, Measurement of CD8+ cells expressing IFNγ from the spleen. G, Spleen bioluminescent metastasis signal quantification.
Figure 4.
Figure 4.
Metastasis by 22Rv1 to additional clinically relevant organs in huNOG-EXL mice. A, Bioluminescent images taken of femurs. B, Quantified bioluminescence of femur metastasis. C, Bioluminescent images taken of mouse brain. D, Quantified bioluminescence of brain metastasis. E, Bioluminescent images taken of mouse liver. F, Quantified bioluminescence of liver metastasis. G, Kidney (adrenal gland) bioluminescent images. H, Quantified bioluminescence of kidney (tumor mostly in adrenal gland).
Figure 5.
Figure 5.
Myeloid-support exhibits immuno-dampened profile in huNOG-EXL 22Rv1 xenograft tumors. A, Gating strategy used to determine presence of human CD45+ cells in the NOG-EXL model. B, Representative data showing the abundance of various immune cell populations; human leukocytes, CD19+ cells, CD3+ cells, and double negative cells; MDSC and activated myeloid cells; and helper T cells (CD4+) and cytotoxic T cells (CD8+; top to bottom). C, Quantitated data comparing human CD45, CD3, CD4, and CD11b populations in tumors isolated from testosterone-implanted vehicle, intact vehicle, castrated vehicle, and castrated enzalutamide treated mice. D, Gating strategy for determining the activation state of MDSCs (CD3 CD19 CD11b+ CD14). E, Representative data showing the activation state of the MDSC cells harvested from tumors under different treatment categories through the presence of the surface markers: CD25, CD44, CD69, and PD-1. F, Quantitated data showing the activation state of the MDSCs throughout the different treatments.
Figure 6.
Figure 6.
Immune-dampened profile of T cells in huNOG-EXL tumors. A, Gating strategy for determining the activation state of T cells and regulatory-like T cells. B, Representative data showing the activation state of the CD3+ cells harvested from tumors under different treatment categories through the presence of the surface markers: CD25, CD44, CD69, and PD-1 and regulatory-like cells (CD3+CD25+PD-1+). C, Quantitation showing the expression of CD25 (D), CD44 (E), CD69 (F), PD-1 (G) regulatory-like T cells.
Figure 7.
Figure 7.
Response of VCaP subcutaneous tumors to anti-PD1 immunotherapy and enzalutamide. A, huNOG primary tumor growth response and (B) NOG primary growth response to pembrolizumab, enzalutamide, and combination therapy. *, P > 0.05 when compared with vehicle control, **, P > 0.05 when compared with all other conditions. C, HLA (HLA-A, B, C) expression of a panel of benign prostate (BPH-1, 957e/hTERT, RWPE1, PNT-2), AR-positive prostate cancer (LNCaP, LAPC-4, VCaP, 22Rv1, CWR-R1) and AR-negative (PC3, DU145 and NCI-H660) cancer cell lines determined by Western blotting (representative blots show, experiment replicated three times). Corresponding AR blot and AR variant (AR-V7) detection. D, LNCaP, 22Rv1, and VCaP HLA response the AR agonist, R1881 (1 nmol/L), AR-antagonist enzalutamide (ENZA - 10 μmol/L), and vehicle control (CTRL) treatment for 24 hours. PSA is a canonical AR-target gene as a readout of AR modulation. E, Comparison of HLA expression between enzalutamide naïve and resistant cell lines (ENZR).

Update of

References

    1. He MX, Cuoco MS, Crowdis J, Bosma-Moody A, Zhang Z, Bi K, et al. Transcriptional mediators of treatment resistance in lethal prostate cancer. Nat Med 2021;27:426–33. - PMC - PubMed
    1. Kregel S, Chen JL, Tom W, Krishnan V, Kach J, Brechka H, et al. Acquired resistance to the second-generation androgen receptor antagonist enzalutamide in castration-resistant prostate cancer. Oncotarget 2016;7:26259–74. - PMC - PubMed
    1. Ittmann M. Anatomy and histology of the human and murine prostate. Cold Spring Harb Perspect Med 2018;8:a030346. - PMC - PubMed
    1. Berquin IM, Min Y, Wu R, Wu H, Chen YQ. Expression signature of the mouse prostate. J Biol Chem 2005;280:36442–51. - PubMed
    1. Sanmamed MF, Chester C, Melero I, Kohrt H. Defining the optimal murine models to investigate immune checkpoint blockers and their combination with other immunotherapies. Ann Oncol 2016;27:1190–8. - PubMed

Publication types